Lingrid | GOLD Correction Phase - Momentum Cooling Off ?OANDA:XAUUSD has reached the resistance zone near 3,650, stalling after a strong bullish run within the upward channel. The chart shows a clear top formation, with sellers defending this area and hinting at a potential corrective move. If gold fails to break and hold above 3,650, price could retrace toward 3,546 as the next key support. The overall structure still favors bulls in the longer term, but near-term momentum points to a pullback phase. Consolidation here may also depend on upcoming economic data.
💡 Risks:
A weaker-than-expected US CPI or labor data release could reignite strong buying and push gold beyond 3,650.
Geopolitical tensions may drive safe-haven demand, supporting further upside despite technical rejection.
A dovish Fed shift could restore bullish flows, reducing the likelihood of a sustained correction.
If this idea resonates with you or you have your own opinion, traders, hit the comments. I’m excited to read your thoughts!
Community ideas

GOLD → Retest 3620 - 3600 (imbalance zones) on the uptrendFX:XAUUSD is consolidating ahead of important news. The market is currently testing support, but the bullish pattern remains intact despite the intraday correction.
Gold is trading near $3650 in anticipation of US inflation data (CPI), which will determine the further trend. So far, the metal is consolidating below a record high of $3675.
High CPI data: will strengthen the dollar and weaken gold (bets on Fed easing will decline).
Low data: will push gold to new highs (the likelihood of aggressive rate cuts will be confirmed).
At the moment, the probability of a rate cut on September 17 is 92% (25 bps), with an 8% chance of 50 bps.
Technically, the chart is forming a consolidation against the backdrop of a bullish trend, the market is testing support, and if the bulls hold their ground in the key zone, traders may return to buying.
Resistance levels: 3638, 3649, 3657
Support levels: 3620, 3607, 3600
There is a battle for the 3620 zone. Consolidation above this zone will confirm bullish strength; otherwise, we can expect a deeper correction to the 3607-3600 zone to retest the imbalance area before further growth.
Best regards, R. Linda!

PPI Shock Pushes Bitcoin Higher – Fake Pump Before Drop?Bitcoin ( BINANCE:BTCUSDT ) has been making high momentum Sharpe moves over the last few days , which has made it a little difficult to trade, which is why I am still sticking to my previous analysis , and this analysis is an update of targets and even new entry points .
Bitcoin is currently moving near the Resistance zone($114,720-$113,580) , Reversal Zone(PRZ) , Cumulative Short Liquidation Leverage($114,510-$113,771) , Monthly Pivot Point , and Resistance lines = a set of Resistances
A few minutes ago, the US Core PPI m/m and PPI m/m data were released, which triggered a pump in Bitcoin . In my view, we should wait for Bitcoin to digest this shock and then continue its real trend .
Do you agree with me?
In terms of Elliott Wave theory , it seems that Bitcoin has completed microwave 5 of microwave C of the main wave Y , and we can expect a downtrend .
I expect Bitcoin to drop again to at least $111,600(First Target) .
Second Target: $110,883
Third Target: $110,000 and more dumps.
Stop Loss(SL): $114,923(Worst)
CME Gap: $117,235-$113,800
Cumulative Long Liquidation Leverage: $110,822-$109,752
Note: Be sure to follow capital management and do not take risks.
Please respect each other's ideas and express them politely if you agree or disagree.
Bitcoin Analysis (BTCUSDT), 1-hour time frame.
Be sure to follow the updated ideas.
Do not forget to put a Stop loss for your positions (For every position you want to open).
Please follow your strategy and updates; this is just my Idea, and I will gladly see your ideas in this post.
Please do not forget the ✅' like '✅ button 🙏😊 & Share it with your friends; thanks, and Trade safe.

GOLD → Consolidation before continuing growth to 3700 FX:XAUUSD resumed its growth on Friday, approaching the $3,650 level, amid growing expectations of aggressive Fed rate cuts and geopolitical risks. The metal remains near record highs and is poised for a fourth consecutive week of gains.
Key drivers: Probability of a 25 bp rate cut on September 17 — 92%, chance of a 50 bp cut — 8%. Markets are expecting three cuts in 2024. US plans to impose new tariffs on India and China are supporting demand for safe havens.
Gold remains in a bullish trend. The weak US economy and geopolitics are pushing it to new highs, but profit-taking at current levels is possible.
There is no news today, so trading may be relatively calm.
Technically, if the price does not retest 3738 but begins to consolidate near 3657 and attempts a breakout, the chances of continued growth will increase.
Support levels: 3638, 3630
Resistance levels: 3649, 3657
I expect the market to reach the liquidity zone of 3638 before returning to retest the trigger. However, if MM deems this maneuver unnecessary and forms a trading range between 3657 and 3649, then closing above 3657 could lead to another bullish distribution.
Sincerely, R. Linda!

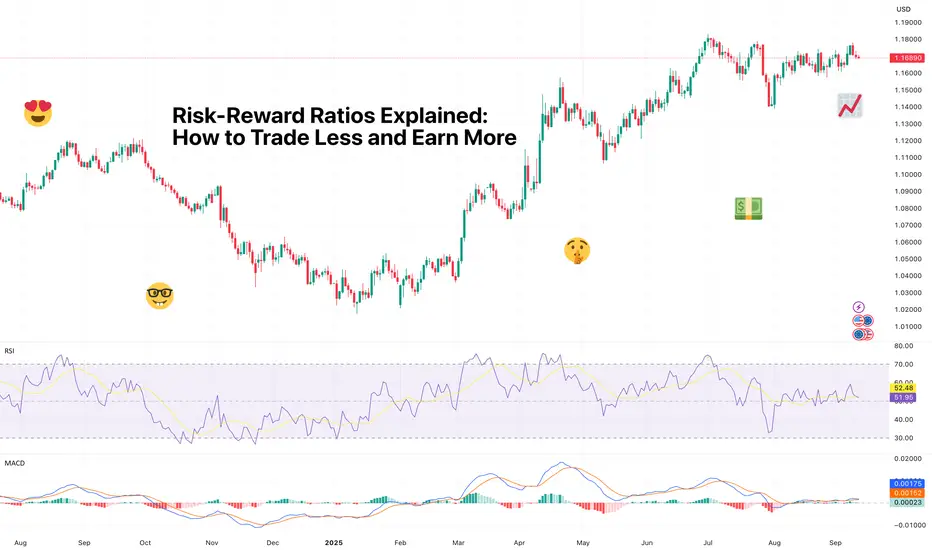
Risk-Reward Ratios Explained: How to Trade Less and Earn MoreIf you’ve been trading for a while, you’ve probably had one of those weeks where you take 15 trades, stress over every tick, barely sleep – and somehow, your P&L ends up red anyway.
Meanwhile, someone in your Discord chat casually posts their “one trade of the week” that banked more than your entire month.
The difference? They understand risk-reward ratios (unless they’re social-media influencers and have a course to sell). The ones that get risk-reward ratios right aren’t trading more, they’re trading less, better.
And that’s what we’re diving into today: how to use risk-reward to stop overtrading, focus on higher-quality setups, and finally give your capital the respect (and break) it deserves.
💡 What Risk-Reward Really Means
At its core, the risk-reward ratio (RRR) tells you how much you’re willing to lose compared to how much you aim to gain. But don’t let the simplicity fool you – mastering this concept separates the true traders from the exit liquidity.
Say you’re risking $100 to make $300. That’s a 1:3 risk-reward ratio – for every $1 on the line, you’re targeting $3 in return.
The beauty is, you don’t need to be right most of the time to make money. At a 1:3 ratio, you can lose six trades out of ten and still come out ahead. That flips the game from “I need to be right” to “I just need to manage risk.”
But, believe it or not, most traders do the opposite. They risk $300 to make $100, cut winners too early, and widen stops when trades go south. That’s not risk management; that’s donation season.
📐 Why This Isn’t Just About Math
Risk-reward ratios look clean on paper, but in real life, psychology can ruin everything.
Picture this:
You plan a beautiful 1:3 setup.
The trade starts working, you’re up 1R, and you panic.
You close early “just to lock in profits.”
If you’ve been around for a while, you’ve heard the saying “You never go broke taking profits.” True. But cutting winners early might mean missing out, hitting your goals slower or not hitting them at all.
Pro tip: once you’re up 1R, consider putting a stop at breakeven and let your take profit stay where you set it initially.
Because there’s a flip side, too. When trades go against you, emotions tell you to give it a little more room. You move your stop. Then you move it again. Suddenly, your carefully planned 1:3 trade becomes a 3:1 loser.
This is where discipline comes in. A risk-reward plan only works if you have the discipline to stick to it . Otherwise, you’re trading vibes, not setups.
🎯 The Sweet Spot for Most Traders
There’s no universal “best” ratio, but for most retail traders these setups work fine:
Day traders often aim for around 1:1 to 1:2
Swing traders typically prefer 1:3 to 1:4
Position traders can stretch to 1:5 or higher
Why? Higher timeframes give price more space to breathe. If you’re scalping, you can’t realistically aim for a 1:5 setup unless you enjoy watching charts like they’re Netflix and crying when spreads eat your edge.
But here’s where traders mess up: Instead of finding setups that naturally offer good ratios, they force them. They shrink stops to chase a flashy 1:6 RRR and end up getting wicked out by noise. Quality setups beat aggressive plays more often than not.
🚀 Asymmetric Risk-Return: The Home Run Setup
Let’s talk about asymmetric bets – trades where the upside massively outweighs the downside. Think 1:10, 1:15, or even 1:20 setups.
These are rare, but they’re game-changers when they hit.
Imagine risking $100 with a tight stop on a breakout setup. If price pops and you catch the move early, you could ride it for $1,500 or more. That’s a 15R trade – the kind that can pay for weeks, sometimes months, of smaller losses.
Here’s a recent example in FX:GBPUSD . The pair hit a double top in mid-August and immediately reversed, piercing the $1.3590 (a prior peak) by just 5 pips. Say you spotted that double-top formation and shorted with a 10-pip stop.
You’d survive the rise and then enjoy a 200-pip reward. That’s 20R in the bag, provided you exited right before the trend turned.
But here’s the trade-off:
You’ll get stopped out more often.
You need patience to let the winners actually run.
You have to accept discomfort – watching price retrace without panic-selling your position.
The market sharpshooters who master asymmetric setups don’t chase them every day. They stalk clean breakouts, major trend reversals, or high-conviction catalysts – and when the trade lines up, they size big, set a tight stop, and let the probabilities do the heavy lifting.
It’s less about being right every time and more about letting one big win offset multiple small losses.
🧩 Making Risk-Reward Work for You
Understanding ratios isn’t enough. You need a process:
Start with risk first
Decide how much you’re okay losing per trade – most pros cap it at 1–2% of account size.
Find logical stops, not emotional ones
Set stops based on structure – below support, above resistance, or at levels where your idea is simply wrong.
Set realistic targets
Don’t dream of 1:10 on a choppy Tuesday unless there’s a major catalyst to back it up.
Let math guide position sizing
Smaller stops mean larger position sizes for the same risk, but stay consistent with your capital exposure.
By planning before you enter, you flip the game from guessing to executing. That’s when risk-reward stops being theory and starts being strategy.
📈 Risk-Reward in Different Market Conditions
Markets change character, and your RRR should adapt too.
In strong trending markets , you can aim for bigger ratios since momentum carries trades further.
In range-bound conditions , scaling back to 1:1.5 or 1:2 makes sense – breakouts fail more often.
During news-heavy weeks , either widen stops or stay flat if you’re risk-averse. Chasing trades when Powell’s mic is on ? Risky business.
The smart traders bend their risk-reward ratios based on volatility instead of forcing the same plan everywhere.
🏖️ Trade Less, Profit More
Here’s the counterintuitive truth: the fewer trades you take, the more money you’ll likely make. In other words, less is more.
Focusing on high-quality setups with favorable RRRs means:
Less noise
Less overtrading
More time for actual analysis instead of gambling
You don’t need to catch every move. Stick to your RRR strategy, take care of the losses, and let profits take care of themselves.
🎯 The TradingView Edge
This is where tools make life easier:
Use Supercharts to visualize risk-reward zones before you enter.
Once inside a chart, navigate to the left-hand toolbar and spot the icon where it says Projection . Pick Long position for long risk-reward ratio, and Short position for short risk-reward ratio. Here’s a helpful tutorial in case you need some guidance.
Set alerts at key levels so you’re not glued to your screen.
Scan with screeners to find setups with volatility and structure that match your target ratios. heatmaps can help, too.
And finally, check out the newest product we launched, Fundamental Graphs , allowing you to compare plenty of metrics across multiple companies (we’re talking earnings, cash flows, net income, revenue, all that good stuff).
👉 The Takeaway
Risk-reward ratios aren’t a thing to consider – they’re a pillar of profitable trading. You don’t need to predict the market perfectly; you need to structure your trades so that your wins pay for your losses, and then some.
For most traders, the shift is simple:
Stop chasing every setup.
Start filtering for trades where the upside dwarfs the downside.
And when you get the rare asymmetric winner, ride it like your P&L depends on it – because it does.
Off to you : What’s your RRR strategy? Are you a defensive player or you’re chasing the asymmetric trades? Share your approach in the comments!
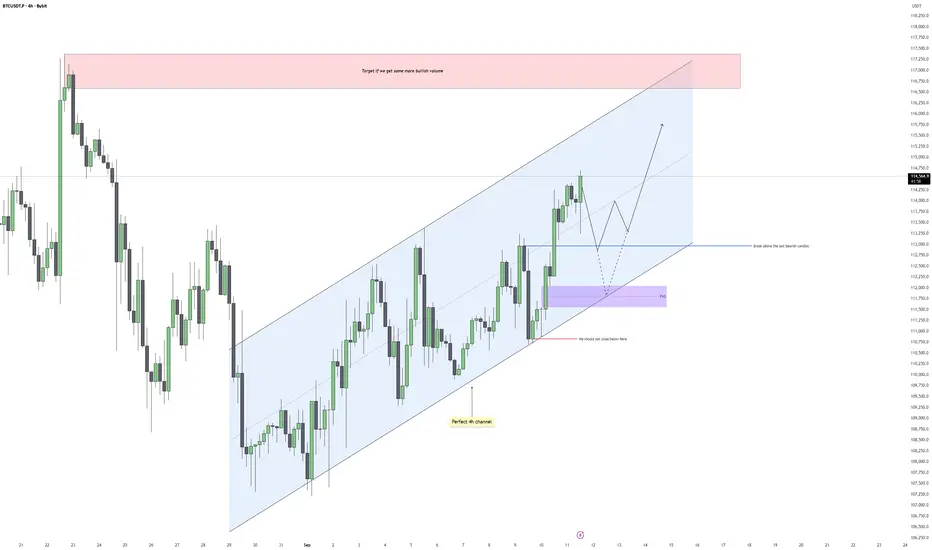
Bitcoin - Clearing the Gaps on the Way to 117kBitcoin continues to respect the ascending channel on the 4H chart, showing steady higher highs and higher lows with clean structure. Price has been climbing with solid bullish momentum, and each retracement so far has been contained within the channel. This gives us a clear framework to track both short-term pullbacks and the next potential leg higher.
Channel Dynamics
The channel is holding perfectly, with both the upper and lower bounds being respected almost to the point. As long as price trades within this structure, the bias remains bullish. A deep pullback into the lower side of the channel would not necessarily invalidate the setup, but we should avoid closing below the last key demand zone if we want to keep the bullish structure intact.
Fair Value Gaps Below
Before continuing higher, Bitcoin may dip back into inefficiencies left behind. A key fair value gap sits below around the 111,700–112,300 region, aligning with prior support. Price filling this gap would be healthy for the structure, giving bulls a better base to push from. If price respects that level, the probability of a continuation toward the channel highs increases significantly.
Bullish and Bearish Scenarios
On the bullish side, if we hold the demand zone and reclaim the blue structure line, price should attempt to sweep short-term highs and extend into the upper channel boundary. A clean break above would open the door to the red supply zone around 117,000–118,000. On the bearish side, any decisive close below the purple fair value gap would shift momentum and put pressure on the lower channel boundary, signaling weakness and invalidating the immediate bullish scenario.
Price Target and Expectations
If the structure continues to play out, I expect Bitcoin to first dip into the imbalance below, find support, then make another leg higher toward 116,500–118,000. This area is a logical liquidity pool where stops above recent highs are clustered, and also aligns with a major supply zone. That zone should be closely monitored for reactions and potential reversals.
Conclusion
Bitcoin remains in a constructive bullish channel, but gaps below need to be addressed before a push into higher liquidity levels. I will be looking for a retracement into the imbalance to set the stage for a continuation higher into the upper red supply zone. As long as we hold above the key demand region, the bullish play remains valid.
___________________________________
Thanks for your support!
If you found this idea helpful or learned something new, drop a like 👍 and leave a comment, I’d love to hear your thoughts! 🚀
ETHUSDT → Correction and hunt for liquidity ahead of growth BINANCE:ETHUSD is showing positive dynamics and breaking through the resistance conglomerate (consolidation boundary and downward correction line). The fundamental background is positive, and bulls are generally quite confident...
The cryptocurrency market, Bitcoin, and altcoins are awaiting a batch of positive news. Traders are waiting for interest rates to fall, which could attract additional capital to the cryptocurrency market, especially ETH.
The breakout of the correction resistance and consolidation resistance gives the market hope for growth. The global trend is bullish, and the fundamental background is positive. If the bulls hold their defense above 4488-4450, ETH may strengthen.
Resistance levels: 4661, 4783
Support levels: 4488, 4450
Technically, I expect a false breakdown of support (retest of the liquidity zone). If this maneuver ends with the price closing above 4488 and the formation of a confirming bullish pattern, then in this case, we can consider the continuation of growth.
Sincerely, R. Linda!

Gold will bounce from support area and continue to riseHello traders, I want share with you my opinion about Bitcoin. The market context for Gold remains firmly bullish, with the price action being guided by a well-established upward channel that has defined the trend for a significant period. The structure of this channel has been confirmed by multiple rotations between its support and resistance lines, originating from the deep buyer zone near the 3390 support level. Currently, after a rejection from the channel's highs, the price of XAU is undergoing a healthy corrective phase. This pullback has brought the asset into a critical confluence of support, defined by the 3630 - 3615 support area and the ascending support line of the channel itself. The primary working hypothesis is a long scenario, which anticipates that buyers will step in to defend this key support cluster. A confirmed bounce from this area would signal the conclusion of the corrective move and the resumption of the dominant upward trend. This would likely initiate the next impulsive wave higher within the channel's structure. Therefore, the TP is logically placed at 3735 points, a target that aligns with the upper resistance line of the channel and represents a new potential structural high. Please share this idea with your friends and click Boost 🚀

GOLD ROUTE MAP UPDATEHey Everyone,
This is the 1H chart route map we tracked this week - played out beautifully to completion.
After hitting 3658, we saw no further EMA5 cross and lock, which led to the rejection. As expected, the lower Goldturns acted as support, giving us the planned dip-buying opportunities.
First, 3638 held as support with multiple bounces.
Then we got a cross-and-lock break below 3638, which opened 3613.
That target was hit and provided a support bounce back into 3638 today.
Right now, price action is playing between 3613 and 3638. An EMA5 cross and lock at either level will determine the next range.
We will keep the above in mind when taking buys from dips. Our updated levels and weighted levels will allow us to track the movement down and then catch bounces up.
We will continue to buy dips using our support levels taking 20 to 40 pips. As stated before each of our level structures give 20 to 40 pip bounces, which is enough for a nice entry and exit. If you back test the levels we shared every week for the past 24 months, you can see how effectively they were used to trade with or against short/mid term swings and trends.
As always, we will keep you all updated with regular updates throughout the week and how we manage the active ideas and setups. Thank you all for your likes, comments and follows, we really appreciate it!
Mr Gold
GoldViewFX

Gold Next levelsThis chart analysis for XAUUSD (Gold vs USD, 1H timeframe) shows that price is currently holding above a rising trendline, indicating bullish momentum. The nearest support zone is around 3620, where price has already bounced. If the bullish structure continues, the upside targets are:
Target 1: 3657
Target 2: 3673
Target 3 / New High Zone: 3708
As long as price stays above the trendline and 3620 support, the outlook remains bullish with potential continuation towards new highs.

Latest Gold Price Update Today👋Hello everyone, what do you think about OANDA:XAUUSD ?
Today, gold continues to trade sideways around the $3,650 mark. The recent surge in new unemployment claims has negatively impacted the US Dollar, allowing XAU/USD to maintain its high position, despite August CPI data coming in slightly higher than analysts’ estimates.
From a technical perspective: The recent highs around $3,655 - $3,657 could serve as key resistance levels, beyond which gold might test its all-time high around $3,675. Additional buying orders could allow XAU/USD to continue its recent breakout and aim for the $3,700 level, especially as the H1 trendline shows signs of breaking.
The support levels to watch are $3,630 - $3,615 , and eventually the psychological $3,600 level. If these hold, short-term buying strategies remain favored. Remember, "The trend is your friend."
What do you think? How will gold move from here? Hit like if you agree with my analysis!
Good luck!

XAU/USD | Gold Faces Rejection Zone $3654–$3675 – Pullback AheadBy analyzing the gold chart on the 12-hour timeframe, we can see that the price has continued its rally since our last analysis, setting new highs one after another, with the latest peak at $3,675. Currently, gold is trading around $3,644, and we still don’t see any clear change in market structure to suggest a strong reversal.
However, the $3,654–$3,675 zone is considered a rejection block. If the price manages to close below this zone within the next 12 hours, I expect a price correction. The possible downside targets for this pullback are $3,635, $3,625, and $3,616.
Please support me with your likes and comments to motivate me to share more analysis with you and share your opinion about the possible trend of this chart with me !
Best Regards , Arman Shaban

XAUUSDHello Traders! 👋
What are your thoughts on GOLD?
Gold has entered a corrective phase after printing a new high and is currently consolidating within a clearly defined channel.
The price is fluctuating inside this channel and may even test the lower boundary before continuing higher.
As long as gold remains within the channel, sideways to slightly downward movement can be expected in the short term.
A bullish breakout above the channel would likely act as a trigger for the next impulsive move, potentially leading to a new all-time high.
Wait for a confirmed breakout before entering long. Premature entries within the range may face choppy action.
Don’t forget to like and share your thoughts in the comments! ❤️

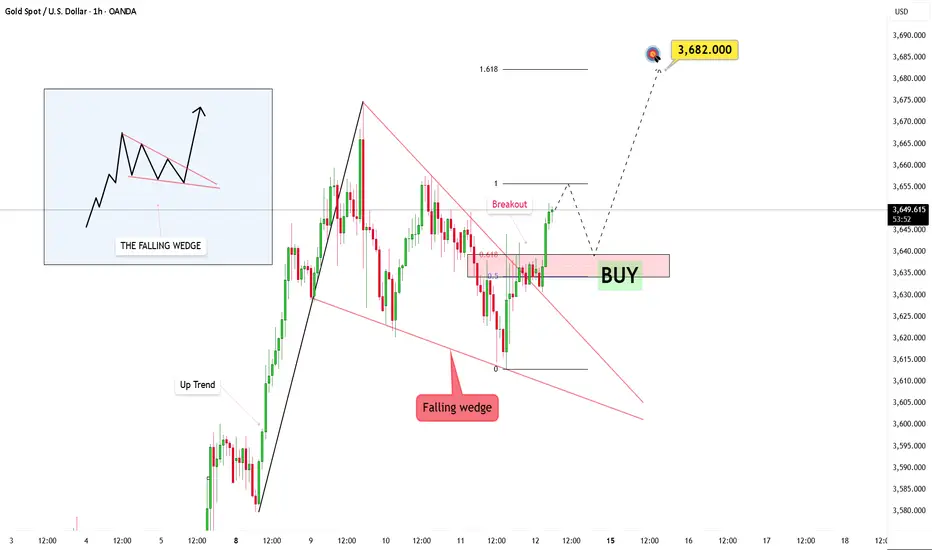
Gold Analysis: Falling Wedge Breakout and Bullish ForecastOANDA:XAUUSD The market is clearly forming a falling wedge, and recent price action suggests a potential shift is on the horizon. Price has begun breaking through this downward structure, which could be the early signs of a strong bullish move.
I’m waiting for the price to retrace back to the broken trendline. This will act as a confirmation, filtering out any false moves, while a retest of the structure will solidify the validity of the breakout. From here, my target is 3682.
The key now is to watch the pullback. If the market returns to the trendline with rising volume, it will add weight to the bullish case.
This trendline breakout is more than just a signal – it’s a story in the making. It represents a shift, and with the right volume, structure, and timing, this could be the start of a larger bullish phase.
Bitcoin will reach resistance line of channel and then dropHello traders, I want share with you my opinion about Bitcoin. The current market structure for Bitcoin is defined by a well-established upward channel that was formed after the price broke out of a prior triangle consolidation. This bullish pattern has been guiding the price action of BTC higher through a clear sequence of higher highs and higher lows between its dynamic support and resistance lines. The market has just completed another full upward rotation within this structure and is now positioned at a critical inflection point. Currently, the price is directly testing the upper boundary of the channel, which forms a powerful confluence of resistance with the horizontal 113500 - 114000 seller zone. This area has historically been a strong barrier where price has reversed on previous occasions. The primary working hypothesis is a short, rotational scenario, based on the expectation that sellers will once again defend this significant resistance confluence. A confirmed rejection from this seller zone would validate the integrity of the upward channel and likely initiate a new corrective swing to the downside, which would first need to break the current support level at 113500. Therefore, the TP is logically placed at 112400 points, a target that aligns perfectly with the ascending support line of the channel. Please share this idea with your friends and click Boost 🚀

Gold 30Min Engaged ( Bullish reversal Entry Detected )Time Frame: 30-Minute Warfare
Entry Protocol: Only after volume-verified breakout
🩸Bullish Reversal : 3645
➗ Hanzo Protocol: Volume-Tiered Entry Authority
➕ Zone Activated: Dynamic market pressure detected.
The level isn’t just price — it’s a memory of where they moved size.
Volume is rising beneath the surface — not noise, but preparation.
🔥 Tactical Note:
We wait for the energy signature — when volume betrays intention.
The trap gets set. The weak follow. We execute.
Intel - The breakout happens now!💰Intel ( NASDAQ:INTC ) will break out quite soon:
🔎Analysis summary:
For the past two decades, Intel has overall been moving sideways. While we witnessed significant swings during this period of time, Intel recently retested another strong support area. If Intel now breaks the short term resistance, we will officially see the bottom formation.
📝Levels to watch:
$25
SwingTraderPhil
SwingTrading.Simplified. | Investing.Simplified. | #LONGTERMVISION

TESLA BULLISH,READ NOTES SEP 11 2025Tesla is looking bullish to break this consolidation. Initial target would be $390. Now breakout is an expectation so always manage your risk.
NOTE: LOOKING BULLISH TO BREAKOUT

TRUMPUSDT - Clear bottom!The Trump token shouldn’t be treated like any other coin — it has backing from big companies and institutions, and more importantly, it’s directly tied to the U.S. President himself. 🇺🇸
Right now, the entire crypto market is forming a bottom that looks almost identical to the one in September 2024, right before the massive rally in October. That’s a strong signal of the next bull market, and naturally, a coin with Trump’s significance will capture a huge share of that upside.
Because honestly — if you can’t make money with Trump, you won’t make money in this market at all.
It has been consolidating for more than 200 days, building a massive symmetrical triangle. Once that breakout happens, the minimum target is $30, and it could hit that level easily in a very short time. Keep a close eye on it.
Best Regards:
Ceciliones🎯

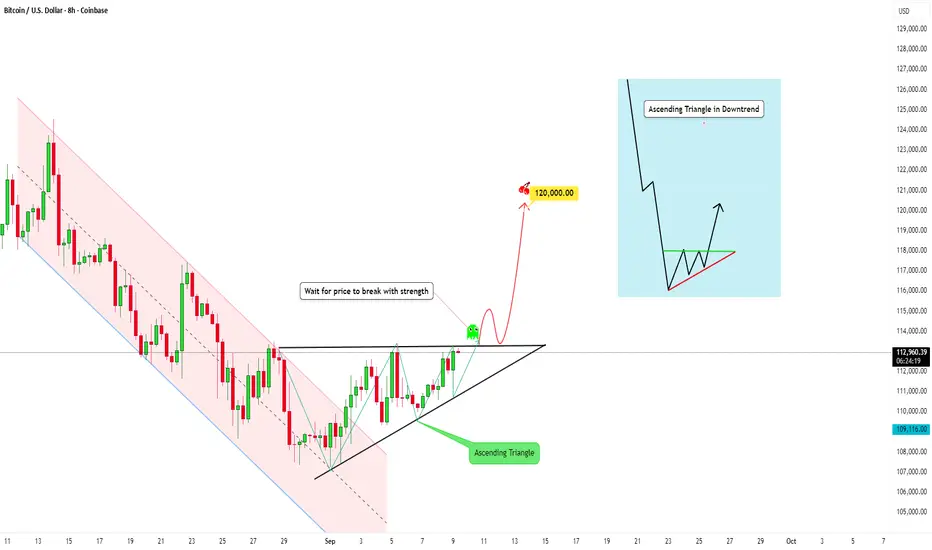
BTC has formed an Ascending Triangle in a DowntrendWhat is Happening Here?
If we take a look at Bitcoin, it's pretty interesting right now: we can observe an ascending triangle just formed. But this pattern took shape after a sharp drop in price.
An ascending triangle is a bullish continuation pattern:
- The resistance line stays horizontal (flat top).
- The support line is rising, creating higher lows.
So what does this mean?
This indicates that buyers are gradually pushing prices higher while sellers are consistently defending the resistance level.
And often with this pattern, the buying pressure overwhelms the sellers, causing a breakout to the upside.
🔹 Breakout expectation:
- Wait for breakout confirmation always! (strong candle close above resistance with volume), and/or on a retest of the broken resistance (now acting as support).
- With this pattern, if it breaks above strongly, the target can typically be measured by taking the height of the triangle and adding it to the breakout level.
🔹 Risk Factors:
- False breakouts can occur (price temporarily breaks resistance but falls back inside).
- If the pattern fails and price breaks below the rising trendline, it may signal bearish weakness.
✅ The reliability of the pattern increases on higher timeframes and with strong breakout volume.
In summary
An ascending triangle shows the following: Buyers are showing strength with rising lows, while resistance is being pressured repeatedly. A confirmed breakout above resistance could drive price toward a psychological target. Waiting for a strong breakout and possibly a retest helps reduce false signal risk.
Not financial advice, just sharing my thoughts on the charts.
Trade safely 😊
Silver Near PRZ – Bearish Reversal Incoming?Today I want to share with you an analysis of SILVER ( OANDA:XAGUSD ). In my opinion, in terms of technical analysis , Silver has a more regular chart than Gold( OANDA:XAUUSD ) these days.
Silver is currently trading near the Resistance line , Important Resistance lines , Yearly Resistance(2) and Potential Reversal Zone(PRZ) .
In terms of Elliott wave theory , it seems that Silver has managed to complete microwave 3 of the main wave 5 , and after the support lines are broken, we can expect a decline and completion of microwave 4 . The end of microwave 4 could follow Fibonacci levels .
Also, we can see the Regular Divergence(RD-) between Consecutive Peaks .
I expect Silver to fall to at least $40.51(First Target) AFTER breaking the support lines .
Second Target: $39.81
Stop Loss(SL): $42.18
Note: Today's US data release could cause a shock to Silver, but ultimately, Silver will continue its downward trend (at least to the first target).
Please respect each other's ideas and express them politely if you agree or disagree.
Silver/ U.S. Dollar Analyze (XAGUSD), 4-hour time frame.
Be sure to follow the updated ideas.
Do not forget to put a Stop loss for your positions (For every position you want to open).
Please follow your strategy and updates; this is just my Idea, and I will gladly see your ideas in this post.
Please do not forget the ✅' like '✅ button 🙏😊 & Share it with your friends; thanks, and Trade safe.

BTC Breaks Resistance: Eyes on 123KBTC Breaks Resistance: Eyes on 123K
Bitcoin continues its upward momentum, hitting our first target as expected.
Following the release of U.S. PPI data yesterday, BTC broke through the key resistance zone at 113,200—opening the path for further gains.
If the price holds steady at current levels, we could see more upside ahead.
Next key targets: 📍 117K 📍 120K 📍 123K
You may find more details in the chart!
Thank you and Good Luck!
❤️PS: Please support with a like or comment if you find this analysis useful for your trading day❤️

NZDUSD Hits Strong Resistances – Bearish Reversal Ahead?NZDUSD ( OANDA:NZDUSD ) is currently trading near the Resistance zone($0.6000-$0.5958) , Potential Reversal Zone(PRZ) , and Resistance lines .
From a classical technical analysis perspective, NZDUSD seems to be completing the Ascending Broadening Wedge Pattern .
From an Elliott wave theory perspective, NZDUSD seems to have completed the microwave C of the microwave Y of the main wave B . So we should wait for the next bearish waves .
Also, we can see the Regular Divergence(RD-) between Consecutive Peaks .
I expect NZDUSD to drop to at least $0.5890(First Target) .
Second Target: $0.5865
Third Target: $0.5828
Stop Loss(SL): $0.5983
Note: Today's US data release could cause a shock to NZDUSD, but ultimately, NZDUSD will continue its downward trend (at least to the first target).
Please respect each other's ideas and express them politely if you agree or disagree.
New Zealand Dollar/ U.S. Dollar Analyze (NZDUSD), 1-hour time frame.
Be sure to follow the updated ideas.
Do not forget to put a Stop loss for your positions (For every position you want to open).
Please follow your strategy and updates; this is just my Idea, and I will gladly see your ideas in this post.
Please do not forget the ✅' like '✅ button 🙏😊 & Share it with your friends; thanks, and Trade safe.
