XAU GOLD WELL WELL WELNow we are making the new ATH for the following few month, with the following continue till 6,600$ after retest 5200-4900$ and forming potential triangle
Community ideas

"Nasty Pattern" Bull Trap; False Breakout Above 7000SPX opened this morning above mythical big number 7000.
What appeared to be a very bullish breakout,
has suddenly turned lower.
What is happening ?
A potential false breakout above 7000.
Now price is in a "descending wedge" pattern moving lower,
and bullish traders who bought the breakout are trapped.
An extremely bearish technical occurrence, should it play out.
A move below 6970, would confirm that something very bearish is brewing.
SPX Last 6976.75
THE_UNWND
WOODS OF CONNECTICUT

“Bearish Price Action Analysis After Rejection at Key ResistanceAfter an extended bullish rally, price has reached a key supply zone where strong selling pressure emerged, leading to a clear rejection from the highs. This rejection signals weakening bullish momentum and the presence of institutional selling at premium prices. The subsequent move lower indicates a bearish corrective phase, with price now heading toward a previously established demand/support zone. Failure to reclaim the prior highs and the formation of lower intraday highs suggest a short-term bearish market structure. If price breaks and closes below the support zone, it would confirm bearish continuation and increase the probability of a deeper pullback. Until then, any upside moves are likely to be corrective rather than impulsive.


Gold Decision Map – XAUUSD Structured Expansion & Decision Zones🟡 Gold Decision Map – XAUUSD
TradingView | Daily Decision Framework
🔹 Fundamental Context
Gold’s sharp rise was not news-driven, but the result of a structural release of accumulated pressure.
The move unfolded in a risk-off geopolitical environment, allowing price to expand without meaningful resistance.
This created a controlled expansion, not a random spike.
🔹 Current Market State
Structured Expansion – Managed Pullback
Primary structure: Bullish
Current behavior: Cooling phase after strong expansion
No confirmed reversal signals at the time of publishing
🔴 Upper Decision Zone
5275 – 5295
Primary rejection / acceptance area
Suitable for:
Short-term selling
Profit-taking
Position reduction
Continuation requires clear acceptance above 5295
🟡 Balance Zone – No Trade Area
5205 – 5245
Neutral price behavior
No directional edge inside this range
Trading inside the balance is methodologically rejected
🟢 Repricing Zones (Buy on Behavior)
5145 – 5185
Primary repricing area
Suitable for rebuilding long exposure
Requires:
Stabilization
Downside rejection
Absorption behavior
5075 – 5110
Deep repricing zone
Defensive buy only
A break below weakens the short-term bullish scenario
🚫 No-Trade Conditions
Any price action inside 5205 – 5245
Entries taken without price reaching a defined decision zone
🔺 Upper Expansion Levels (Reference – Not Daily Targets)
5310
5340
5385 – 5400
Used for structural assessment and scenario planning, not execution.
🧭 Execution Framework
Sell / reduce: 5275 – 5295
Buy (conditional): 5145 – 5185
No trade: 5205 – 5245
Acceptance above 5295 → expansion continuation
Break below 5145 → invalidate short-term buy
🧠 Core Rule
Decisions at zones, not in the middle.

The end of the NVDA run. Back below $100 incomingNVDA has had a great run over the last few years, but now that run looks to be coming to an end.
As you can see from the chart, we've tested the upper resistance and have now formed a head and shoulders top. If/once price breaks below the blue trend line, that should signify the end of the run for NVDA.
I think price is likely to go back to revisit the lower supports back down at $66-77.
Let's see what happens over the coming months.

Gold Prices Consolidate at High Levels: $5470-$5600Gold Prices Consolidate at High Levels: $5470-$5600
Following the Fed's decision early this morning, spot gold experienced significant volatility, exhibiting a typical "buy the rumor, sell the news" pattern.
**Sharp Surge:** Influenced by the Fed's pause in interest rate cuts (maintaining rates at 3.50%-3.75%) and its dovish stance, gold prices strongly broke through the key psychological level of $5500 in early Asian trading, reaching a historical high of $5598.75 per ounce.
This rollercoaster ride stemmed primarily from two technical reasons:
First, the price had risen dramatically in a short period, placing gold in a severely overbought zone, necessitating a correction;
Second, short-term bulls chose to take profits after the key positive news was priced in, leading to the price pullback.
**Core Structure:** Despite the significant intraday volatility, the overall bullish trend remains intact.
**Key Support Levels:** The $5250-$5300 range is a significant area of previous trading volume.
**Key Support Levels:** Four key factors converged:
1. While the January decision "paused rate cuts," it explicitly ruled out a rate hike, and Chairman Powell released dovish signals, emphasizing that action would be taken if inflation falls or the labor market weakens.
The market interpreted this as the accommodative stance remaining unchanged, with rate cuts merely postponed. This lowered real interest rate expectations, directly benefiting gold.
2. Global central banks' net gold purchases reached 1,120 tons in 2025, with January 2026 purchases setting a new record.
This is not merely a tactical deployment, but a long-term strategic reflection of global reserve asset diversification and weakening confidence in the US dollar, providing a solid floor for gold prices.
3. Weakening market confidence in fiat currencies (especially the US dollar) and concerns about uncertainty surrounding US fiscal policy jointly fueled the "sell US" trade.
The US dollar index fell to a four-year low, making dollar-denominated gold cheaper for holders of other currencies, further stimulating demand.
4. The current geopolitical situations in the Middle East and Russia-Ukraine relations remain unresolved. Model calculations show that geopolitical risk premiums now account for 47% of the total risk premium for gold, significantly prolonging the duration of safe-haven capital inflows into gold.
Short-term Trading: The current market volatility is extremely high, presenting both opportunities and risks.
Pay attention to: $5480-$5470 (current support) and $5250-$5300 (key support). If gold prices pull back to these levels and stabilize, it could present a good short-term trading opportunity.
Strict stop-loss orders must be set to protect against sharp fluctuations caused by unforeseen events.
Intraday Trading Strategy:
BUY: $5490-$5500
SL: $5480-$5470
tp: $5550-$5600
Friendly Reminder: Be cautious when shorting.
Thank you for your attention. Welcome to discuss in my channel. I will use my expertise to guide your trading.

SUIUSDT 1,760% profits potential with 5X leverage —LONG tradeYou know the very famous saying, "buy when the market is red." It is good to buy when the market is red but we have to take into consideration the context of this buying, the broader market.
Is the market bullish as a whole? Does the chart in question have bullish potential?
SUIUSDT is now moving within the "opportunity buy-zone." This is what I call a really good entry zone or great prices. This is the best ever when it comes to a possible entry for a leveraged trade. Not only the price is right but the timing, timing is truly great.
This chart setup has a very strong bullish bias and we expect very strong growth, and fast; within days.
Here you have the full trade-numbers:
_____
LONG SUIUSDT
Leverage: 5X
Potential: 1760%
Allocation: 4%
Entry zone: $1.26 - $1.45
Targets:
1) $1.77
2) $2.05
3) $2.50
4) $2.87
5) $3.24
6) $3.77
7) $4.44
8) $5.55
9) $6.38
Stop: Close weekly below $1.25
_____
Thanks a lot for your continued support.
I will continue to share more as this type of opportunity doesn't repeat very often. The time is now to take action.
If you are reading this now, you have really good timing. You are well aligned. Keep up the good work.
I am wishing the best for you.
Namaste.

BTC/USDT 1H Chart Review🔍 Market Structure
• Price is in an ascending channel (higher lows, higher highs).
• Currently, we are in the middle of the channel, after a rejection from above.
⸻
📉 Price Action
• 90,500–90,800 → strong resistance (upper zone + previous rejections).
• The last upward impulse has been reversed, but without breaking the structure.
• Retracement candles are relatively short → no aggressive supply.
⸻
🧱 Key Levels
Resistance:
• 90,500 – local high / reactions
• 91,600 – upper band of the channel (target at breakout)
Support:
• 88,650 – key mid-support (very important decision level)
• 87,400 – lower band of the channel (must hold for bulls)
⸻
📊 RSI Stochastic
• RSI Stochastic in the oversold zone (<20)
• This is a signal for a potential bounce, but:
• candle confirmation needed (e.g., bullish engulfing / higher low)
⸻
🧠 Scenarios
🟢 Baseline Scenario (more likely)
• Defense at 88,600
• Rebound up the channel
• Test at 90,500
• On breakout → 91 600
👉 Typical buy-the-dip setup
⸻
🔴 Negative scenario
• 1H close below 88,600
• Quick move to 87,400
• Loss of 87,400 = structure changes to corrective

DeGRAM | GOLD will retest the support line📊 Technical Analysis
● XAU/USD is holding above the rising support line inside an ascending channel, with buyers defending pullbacks after a strong impulsive breakout.
● Price has consolidated below minor resistance near 5,530 and is attempting continuation toward the upper channel boundary around 5,595–5,650, confirming bullish short-term structure.
💡 Fundamental Analysis
● Ongoing geopolitical uncertainty and expectations of eventual monetary easing continue to support demand for gold on intraday dips, favoring upside continuation.
✨ Summary
● Gold remains supported within a rising channel.
● Short-term upside toward 5,595–5,650 is favored while price holds above 5,500.
-------------------
Share your opinion in the comments and support the idea with a like. Thanks for your support!

Long on thyssenkrupp nucera AG & CO. KGaA (Ticker NCH2)
XETR:NCH2
Technicals:
- the price has been glued to the 9.23 resistance level and zone for a month
- a breakout above this level opens the path to close the gap from Oct 22
- the month-long accumulation suggests that large-scale capital is building a position within the 8.77 – 9.20 range
- the recent squeeze to the 0.23 fibo is nothing more than a stop-loss hunt targeting late-entry passengers who jumped on the train
- scenario invalidated if 2 bar close below 8.77
Fundamentals:
- alkaline water electrolysis (AWE) is considered one of the most reliable and scalable
- maintains a strong balance sheet (net cash position), allowing it to finance expansion without incurring expensive debt
- a large order backlog provides high visibility for future revenue
- however, profitability remains questionable. Despite being profitable at the gross margin level, operating profit frequently fluctuates near zero or turns negative
- increasing pressure from Chinese companies adds fuel to the fire regarding the asset's future valuation
Conclusion:
- this trade represents an interesting speculative position on a breakout of the monthly resistance zone
- but a wider stop at 8.33 is only justified if the Take Profit (TP) is set at 11.65. While theoretically achievable, this target is not guaranteed and would likely require strong fundamental catalysts
# - - - - -
⚠️ Signal - Buy ⬆️
✅ Entry Point Term - 9.13
# - - - - -
🛑 SL - 8.76
🤑 TP - 10.46
⚙️ Risk/Reward - 1 : 2.85 👌
⌛️ Timeframe - 3 months 🗓
# - - - - -
Good Luck! ☺️
DISCLAIMER: Not financial advice. Everyone must make trading decisions at their own risk, guided only by their own criteria and strategy for opening or not opening a trade.

GOLD to fall.History shows our emotions may be quite eratic at the individual scale, but once you zoom out things begin to seem quite cyclical. Here I propose to you a massively overpriced asset fuelled by many factors from global instability to AI. Supposing humanity doesn't go on an exponential curve from here out and simply implode... I predict here +/- $500 is the optimal position to short.

Beautiful Bullish Divergence. SLGB Analysis
CMP 2.87 (28-01-2026)
Beautiful Bullish Divergence.
Stock may start its uptrend if it crosses 3.75 with Good Volumes.
It may easily touch 5+ easily then.

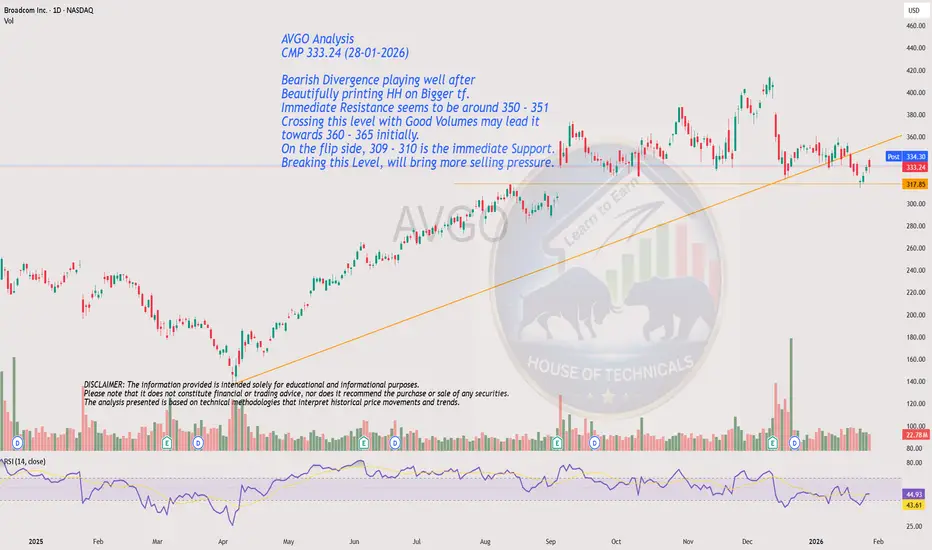
Beautifully printing HH on Bigger tf.AVGO Analysis
CMP 333.24 (28-01-2026)
Bearish Divergence playing well after
Beautifully printing HH on Bigger tf.
Immediate Resistance seems to be around 350 - 351
Crossing this level with Good Volumes may lead it
towards 360 - 365 initially.
On the flip side, 309 - 310 is the immediate Support.
Breaking this Level, will bring more selling pressure.

Gold - Trump is crashing metals soon!🥊Gold ( OANDA:XAUUSD ) is retesting major resistance now:
🔎Analysis summary:
Yes, Gold has been creating an insane rally of 190% over the past couple of months. And so far, Gold also remains totally bullish. But looking at the higher timeframes, Gold is now sitting at a massive resistance trendline and clearly ready for a shorter term correction.
📝Levels to watch:
$5,000
SwingTraderPhil
SwingTrading.Simplified. | Investing.Simplified. | #LONGTERMVISION

Bullish continuation?Cable (GBP/USD) could fall towards the pivot, which acts as a pullback support, and could bounce to the 1st resistance.
Pivot: 1.3668
1st Support: 1.3550
1st Resistance: 1.3849
Disclaimer:
The opinions given above constitute general market commentary and do not constitute the opinion or advice of IC Markets or any form of personal or investment advice.
Any opinions, news, research, analyses, prices, other information, or links to third-party sites contained on this website are provided on an "as-is" basis, are intended to be informative only, and are not advice, a recommendation, research, a record of our trading prices, an offer of, or solicitation for, a transaction in any financial instrument and thus should not be treated as such. The information provided does not involve any specific investment objectives, financial situation, or needs of any specific person who may receive it. Please be aware that past performance is not a reliable indicator of future performance and/or results. Past performance or forward-looking scenarios based upon the reasonable beliefs of the third-party provider are not a guarantee of future performance. Actual results may differ materially from those anticipated in forward-looking or past performance statements. IC Markets makes no representation or warranty and assumes no liability as to the accuracy or completeness of the information provided, nor any loss arising from any investment based on a recommendation, forecast, or any information supplied by any third party

EURJPY H1 | Bullish Bounce Off Key SupportMomentum: Bullish
Price is currently above the ichimoku cloud.
Buy entry: 182.836
- Pullback support
- 78.6% Fib retracement
- 100% Fib projection
Stop Loss: 182.123
- Multi-swing low support
Take Profit: 183.602
- Multi-swing high resistance
High Risk Investment Warning
Stratos Markets Limited (fxcm.com/uk), Stratos Europe Ltd (fxcm.com/eu):
CFDs are complex instruments and come with a high risk of losing money rapidly due to leverage. 69% of retail investor accounts lose money when trading CFDs with this provider. You should consider whether you understand how CFDs work and whether you can afford to take the high risk of losing your money.
Stratos Global LLC (fxcm.com/en): Losses can exceed deposits.
Please be advised that the information presented on TradingView is provided to FXCM (‘Company’, ‘we’) by a third-party provider (‘TFA Global Pte Ltd’). Please be reminded that you are solely responsible for the trading decisions on your account. Any information and/or content is intended entirely for research, educational and informational purposes only and does not constitute investment or consultation advice or investment strategy. The information is not tailored to the investment needs of any specific person and therefore does not involve a consideration of any of the investment objectives, financial situation or needs of any viewer that may receive it. Past performance is not a reliable indicator of future results. Actual results may differ materially from those anticipated in forward-looking or past performance statements. We assume no liability as to the accuracy or completeness of any of the information and/or content provided herein and the Company cannot be held responsible for any omission, mistake nor for any loss or damage including without limitation to any loss of profit which may arise from reliance on any information supplied by TFA Global Pte Ltd.
Stratos Trading Pty. Limited (fxcm.com/au):
Trading FX/CFDs carries significant risks. FXCM AU (AFSL 309763), please read the Financial Services Guide, Product Disclosure Statement, Target Market Determination and Terms of Business at fxcm.com/au

Gold Enters Distribution — Liquidity Will Decide the Next LegGold is no longer in the same phase it was a few sessions ago and this chart makes that transition very clear through a clean Wyckoff Market Cycle lens.
After an extended accumulation phase around five thousand to five thousand eighty, smart money built positions quietly while price moved sideways and volatility compressed. That base provided the fuel for the next phase: a sharp and aggressive markup, where price expanded impulsively from the accumulation range and accelerated higher with wide candles and minimal pullbacks. This is classic markup behavior urgency, poor structure, and a clear imbalance between buyers and sellers.
That markup leg carried gold directly into the five thousand five hundred to five thousand five hundred eighty region, where price is now stalling around the Point of Control (POC). This is not random. The POC represents the price area where the highest volume has recently transacted in other words, where large players are most active. When price reaches this zone after a vertical move, the market often transitions from expansion to distribution.
The current price action inside the highlighted box shows all the early signs of distribution: overlapping candles, failed continuation attempts, repeated swings within a defined range, and increasing time spent at highs without further upside progress. Liquidity-wise, this range is designed to absorb late breakout buyers while allowing stronger hands to gradually offload inventory. Each push higher inside the range invites new longs, and each pullback tests their conviction a textbook process of liquidity harvesting.
From a structural perspective, this does not yet mean an immediate crash. Distribution phases often take time. Price can continue ranging, creating multiple false bullish signals, before the market commits to a markdown. However, once acceptance occurs below the lower boundary of the distribution zone roughly below five thousand four hundred the probability shifts decisively toward a deeper corrective move, with downside liquidity resting closer to five thousand two hundred and potentially five thousand one hundred.
Macro context strengthens this reading. While gold remains structurally bullish on higher timeframes due to persistent geopolitical risk, central bank demand, and long-term currency debasement concerns, short-term positioning has become crowded. The recent vertical rally reflects aggressive speculative participation rather than fresh defensive flows. When positioning becomes one-sided, the market’s priority shifts from trending to rebalancing and that is exactly what distribution accomplishes.
Market psychology is also aligned with this phase. Sentiment is still optimistic, targets are being raised, and dips are aggressively bought all typical near the end of a markup leg. True bearish phases rarely begin when fear is high; they begin when confidence is excessive and structure quietly deteriorates.
Key takeaway: Gold has completed accumulation and markup. It is now rotating in a high-level distribution range near five thousand five hundred. As long as price remains inside this zone, expect volatility, fake breakouts, and liquidity games. A confirmed breakdown below the range would open the door for a controlled markdown toward lower demand zones not as a trend reversal, but as a necessary reset before the next major cycle resumes.

AUDUSD – Higher Timeframe Setup (D1)Price is trading into a major HTF resistance / supply zone (~0.69871) that previously acted as strong distribution. The recent move up looks corrective, forming lower highs inside a broader bearish structure. Liquidity is likely resting above this zone (“stops”), which often gets swept before a strong bearish expansion.
If price rejects this zone, the higher-timeframe bias favors a continuation to the downside, with downside targets toward the 0.55 liquidity area marked below.
Bias: Bearish below HTF resistance
Idea: Wait for rejection → sell confirmation → ride the HTF move
📌 I trade structure, liquidity, and HTF zones — not indicators.
If you want to learn how to spot these setups early and trade them with confidence, follow me and check my 90-day trading plan.
Trade with a plan. Trade with structure.

$GME Only UpI strongly believe we’re on the edge of an aggressive move upward in the coming weeks. The recent convertible notes were for a large amount—with no detailed breakdown of where that money is going. Could Ryan be planning an acquisition? A major expansion? No one knows for sure.
But here's what we do know: the last time this exact playbook unfolded, the stock exploded.
Don’t let the fear-mongering shills shake you out of your position. In my opinion, this is the perfect time to buy. I'm holding firm.
They can't liquidate me.
My Position:
• Market Value: $5,062.71
• Today’s Return: –$1,220.49 (–19.42%)
• Total Return: –$708.54 (–12.28%)
• Average Cost: $25.53
• Shares: 226.01
• Portfolio Diversity: 91.14%
I was hoping for a breakout sooner, but the momentum got clipped by another capital raise. Still, Ryan is active on X, even reposting criticism—which tells me he’s very aware of the pressure, and he’s not backing down. Something is brewing. I trust him. But this time, I’ll remember to take profits on the way up.
I also wouldn’t be surprised if we see more convertible notes in the near future.
Let’s see how this plays out.
Just my opinion—not financial advice.

ACHR (Archer Aviation) – Structured Long SetupTimeframe: Daily
Bias: Long continuation / base breakout
Current Price: ~8.86
This is a technically clean, rule-based long setup built around Bill Williams’ Alligator + Fractal structure, with defined risk and asymmetric upside.
Technical Context
ACHR put in a clear downtrend through November, then transitioned into a basing phase with higher lows.
Price has now closed above a bullish fractal while the Alligator is opening (jaw, teeth, lips separating), signaling a shift from consolidation to trend development.
Recent candles are holding above short-term moving averages and compressing near R1, suggesting energy building rather than rejection.
Volume has stabilized after the selloff, consistent with absorption rather than distribution.
Alligator + Fractal Read
Bullish fractal break = directional trigger.
Lips (fast MA) crossing and staying above teeth and jaw = trend activation.
Alligator “waking up” after being tangled = higher probability of follow-through, not a chop trade.
Key Levels
Entry Zone: 8.70–8.90 (current consolidation range)
Invalidation / Stop: ~7.55–7.60
Loss of this level breaks the higher-low structure and puts price back below the Alligator.
Upside Targets (Pivot-based):
R2: ~9.67
R3: ~10.27
R4: ~10.88
R5: ~11.49
Trade Structure
Risk/Reward: ~2.0–2.1R to first meaningful target
This is not a momentum chase; it’s an early trend entry following confirmation.
Best case: price holds above R1, grinds higher, and expands toward R3–R4 as trend traders step in.
Failure case: acceptance back below the Alligator → exit quickly, no thesis left.
What Would Invalidate the Bull Case
Daily close back below the Alligator cluster.
Failure to hold above the broken fractal level.
Expansion lower with increasing volume (distribution signal).
Summary
ACHR is transitioning from base to potential trend. The Alligator opening + bullish fractal break provides a clear, objective long signal with defined risk. As long as price holds above the Alligator and prior structure, the path of least resistance is higher toward the upper pivot levels.

IBM Earnings Play: QS V4 Bull Call SpreadIBM QuantSignals V4 Earning 2026-01-28
Technical & AI Insight
Current Price: $294.96
Katy AI Bias: Neutral, 40% confidence → signals uncertainty
Polymarket Beat Probability: 90% → strong crowd conviction
200-Day MA Support: $275.02 – long-term bullish floor
50-Day MA: $301.73 – short-term resistance
IV Rank: 41.3% → moderate, lower IV crush risk
Implied Move: $20 (~6.8%)
Risk Architecture
RISK GRADE: Extreme (Binary Event)
Thesis Error: Price drops below $288.07 → invalidates bullish setup
Exit Protocol: Scale 50% at Target 1; trail 15% on remaining 50%; hard exit by next session post-earnings
Tactical Notes
Technical consolidation near VWAP ($294.64) – shows institutional balance
MACD bearish short-term (-0.77), RSI neutral (49)
Crowd intelligence strongly bullish → high-probability asymmetric upside if earnings beat
Post-earnings guidance will determine final price direction
