NQ Monthly/Weekly Analysis!Good Month/Week!
FA Analysis:
1- New FED's Head: Done!
Free money and rate cuts will come later. Meanwhile, market will make pressure of the FED and Sell the news.
2- High Risk:
2.1- USA Internal Affairs: Minnesota & ....
Market started paying attention to the situation in USA and high potential expansion to other areas.
Also, all Pool Results are showing Trump loosing support even from people who voted for him. So the impacts on the mid-election will be considerate.
2.2- Overseas Wars: Imminent one with Iran (most likely this week!)
Trump is using tariffs as a leverage to get what he wants from Europe and the rest of the world.
3- Macroeconomic factors:
3.1- Last Friday, Inflation data (i.e., PPI) showed an Overshoot. Market will pay a strong attention to the next Inflation data. Any other overshoot will jeopardize the free money and rate cuts.
3.1- Earnings Season:
So far, earnings were between inline and disappointing. So we won't get a push up from this side.
4- Upcoming weekly FA data:
The month will start with very relevant date from CBs, economic data, in particular NFP.
Good data will be considered good for equities and vice-versa for bad data.
In conclusion: Most of the above FA factors converge towards a Negative Outlook for US Equities/NQ .
TA Analysis
Monthly TF:
The Monthly candle is Bearish.
Price is below TL.
The target to achieve is 18800. It won't be straightforward!
Weekly TF:
Same as Monthly, we got a bearish Weekly close.
(From Yearly Outlook:
NQ is in the 1st wave down which comprises an Initial Wave, a Retrace, and an Impulsive Wave.
I mentioned that the Initial wave is very slow. Based on the Weekly chart, I think NQ has completed both the Initial Wave and the Retrace Wave.
From last week, NQ has started the Impulsive Wave. The Impulsive Wave is supposed to be very quick and insane.)
Daily TF:
The daily close is also bearish. Still price is within HH-HL. I think price will go south immediately to create a new LL.
In conclusion: All TFs are BEARISH. A continuation down is the least resistance.
(Note: Market might open with a down gap).
Happy Month/Week Everyone!
(Note: If you enjoy the analysis, give it a thumbs up and if you've a different view, please share it!)
Community ideas

GOLD (XAU/USD) – HTF Demand + Liquidity Sweep Setup CoOkie!The recent monthly close lower in Gold appears to be a deliberate liquidity repositioning event, rather than a structural trend reversal. Price was marked down into discounted levels to facilitate sell-side liquidity absorption and the mitigation of higher-timeframe inefficiencies left from the prior impulsive advance.
Post-close, price established a defined Asia session range, which was subsequently leveraged during the London session via a Judas-style move, drawing liquidity beneath Asia lows and internal structure. This maneuver delivered price into a well-defined HTF demand / discount PD array (4,760 – 4,540).
Current behavior within this zone suggests institutional accumulation, with selling pressure being absorbed rather than extended. Provided price remains accepted above the demand low, the broader bullish market structure remains intact.
The higher-timeframe draw on liquidity continues to favor the upside, with New York session expansion expected following a lower-timeframe structural shift. Primary objectives remain the buy-side liquidity pools positioned above prior highs and premium PD arrays.
🎯 Upside Liquidity Objectives:
• 5,257 – Prior structure high / internal liquidity
• 5,591 – External range liquidity
• 6,029 – 6,310 – HTF premium distribution zone
📉 Risk / Invalidation: Sustained acceptance below 4,537 would negate the accumulation thesis and require reassessment of the higher-timeframe bias.

Bitcoin dump to $74000 today Just opened a new short on #bitcoin
Aiming for $74000
Stoploss: $79300
+2RR roughly
DTT strategy applied. TIme sensitive

EURCAD SHORTMarket structure bearish on HTFs 3
Entry at both Weekly and Daily AOi
Weekly Rejection at AOi
Previous Weekly Structure Point
Daily Rejection at AOi
Previous Daily Structure Point
Daily EMA retest
Around Psychological Level 1.62000
Touching EMA H4
H4 Candlestick rejection
TP: WHO KNOWS!
Entry 115%
REMEMBER : Trading is a Game Of Probability
: Manage Your Risk
: Be Patient
: Every Moment Is Unique
: Rinse, Wash, Repeat!
: Christ is King.

Overlap resistance ahead?Loonie (USD/CAD) is rising towards the pivot, which is an overlap resistance and could reverse to the 1st support.
Pivot: 1.3750
1st Support: 1.3426
1st Resistance: 1.3914
Disclaimer:
The opinions given above constitute general market commentary and do not constitute the opinion or advice of IC Markets or any form of personal or investment advice.
Any opinions, news, research, analyses, prices, other information, or links to third-party sites contained on this website are provided on an "as-is" basis, are intended to be informative only, and are not advice, a recommendation, research, a record of our trading prices, an offer of, or solicitation for, a transaction in any financial instrument and thus should not be treated as such. The information provided does not involve any specific investment objectives, financial situation, or needs of any specific person who may receive it. Please be aware that past performance is not a reliable indicator of future performance and/or results. Past performance or forward-looking scenarios based upon the reasonable beliefs of the third-party provider are not a guarantee of future performance. Actual results may differ materially from those anticipated in forward-looking or past performance statements. IC Markets makes no representation or warranty and assumes no liability as to the accuracy or completeness of the information provided, nor any loss arising from any investment based on a recommendation, forecast, or any information supplied by any third party

USDJPY H4 | Heading Towards 50% Fib ResistanceBased on the H4 chart analysis, we could see the price rise towards our sell entry level at 155.64, which is a pullback resistance that aligns with the 50% Fibonacci retracement.
Our stop loss is set at 157.27, which is a pullback resistance that is slightly below the 78.6% Fibonacci retracement.
Our take profit is set at 153.53, which is a pullback support.
High Risk Investment Warning
Stratos Markets Limited fxcm.com Stratos Europe Ltd fxcm.com
CFDs are complex instruments and come with a high risk of losing money rapidly due to leverage. 69% of retail investor accounts lose money when trading CFDs with this provider. You should consider whether you understand how CFDs work and whether you can afford to take the high risk of losing your money.
Stratos Global LLC fxcm.com Losses can exceed deposits.
Please be advised that the information presented on TradingView is provided to FXCM (‘Company’, ‘we’) by a third-party provider (‘TFA Global Pte Ltd’). Please be reminded that you are solely responsible for the trading decisions on your account. Any information and/or content is intended entirely for research, educational and informational purposes only and does not constitute investment or consultation advice or investment strategy. The information is not tailored to the investment needs of any specific person and therefore does not involve a consideration of any of the investment objectives, financial situation or needs of any viewer that may receive it. Past performance is not a reliable indicator of future results. Actual results may differ materially from those anticipated in forward-looking or past performance statements. We assume no liability as to the accuracy or completeness of any of the information and/or content provided herein and the Company cannot be held responsible for any omission, mistake nor for any loss or damage including without limitation to any loss of profit which may arise from reliance on any information supplied by TFA Global Pte Ltd.
Stratos Trading Pty. Limited fxcm.com
Trading FX/CFDs carries significant risks. FXCM AU (AFSL 309763), please read the Financial Services Guide, Product Disclosure Statement, Target Market Determination and Terms of Business at fxcm.com

Bullish momentum to extend?WTI Oil (XTI/USD) could fall towards the pivot and could bounce to the 1st resistance.
Pivot: 62.70
1st Support: 60.25
1st Resistance: 71.24
Disclaimer:
The opinions given above constitute general market commentary and do not constitute the opinion or advice of IC Markets or any form of personal or investment advice.
Any opinions, news, research, analyses, prices, other information, or links to third-party sites contained on this website are provided on an "as-is" basis, are intended to be informative only, and are not advice, a recommendation, research, a record of our trading prices, an offer of, or solicitation for, a transaction in any financial instrument and thus should not be treated as such. The information provided does not involve any specific investment objectives, financial situation, or needs of any specific person who may receive it. Please be aware that past performance is not a reliable indicator of future performance and/or results. Past performance or forward-looking scenarios based upon the reasonable beliefs of the third-party provider are not a guarantee of future performance. Actual results may differ materially from those anticipated in forward-looking or past performance statements. IC Markets makes no representation or warranty and assumes no liability as to the accuracy or completeness of the information provided, nor any loss arising from any investment based on a recommendation, forecast, or any information supplied by any third party

DEFEND THE IRON FLOOR ($62.50) CODENAME: THE VOLUME VACUUMINSTITUTIONAL FOOTPRINT (Volume & Flow)
The Signal: Volume on this sharp pullback to $63.30 has completely evaporated. The last 4H candle clocked in at just 7.3k volume against an average of 45k. The Diagnosis: This is a "Supply Vacuum." The sellers have left the building. When price drops but volume vanishes (-83% below average), it means the "Smart Money" is not selling—they are holding. This is purely retail noise/profit-taking. The Reality: The market is drifting lower on thin air. This is the classic setup for a "V-Shape" reversal the moment a buyer steps in.
ALGORITHMIC FRONTIER (Resistance Zones) Current Ceiling: $63.96 (4H EMA 20)
The Barrier: We are currently trading below the short-term institutional average. The algorithms are programmed to "fade the rips" into $64.00 until the trend re-aligns. The Pivot: A 4H candle close back above **$64.00** flips the automated systems from "Neutral/Sell" to "Chase." That is the breakout level.
MOMENTUM GAUGE (Oscillators) Status: RESET & RECHARGED.
The Reading: The 4H RSI has cooled off to 50.83. Meaning: The "Overbought" heat from the previous rally is gone. The oscillator is sitting dead-center on the 50 line. This is the perfect launchpad—it means we have full capacity to rally back to $70 without hitting resistance from the indicators.
STRUCTURAL FOUNDATION (Key Support) The Confluence: $62.46 - $62.52
4H EMA 50: $62.46
Daily EMA 200: $62.52 Analysis: We are sitting on top of the most critical technical floor on the chart. The convergence of the medium-term trend (4H) and the long-term trend (Daily) creates a "Golden Support" zone. The Verdict: As long as price holds above **$62.50**, the macro bull thesis is bulletproof.
COMMANDER'S VERDICT The chart shows a textbook "Volume Contraction Pattern" on top of major support.
Bullish Case: Buyers defend the $62.50 confluence and push price back above $64.00. Bearish Case: A high-volume breakdown below $62.40 opens the trapdoor to $60.00.
Strategic Action:
Accumulation Zone: $62.50 - $63.00 (Buying the institutional floor).
Confirmation: Wait for the reclaim of $64.00.
Hold the line. 👻

Ethereum update —The positive within the negativeI know everything looks pretty bad right now because we have a bearish continuation but not everything is lost.
Yesterday, Ethereum produced a very strong red candle with a long lower wick—I am looking at the chart up-close. Today, while the action is full red it remains within yesterday's wick low. The day is not over but staying within this low can signal that the down-move is over. If the down-move is over, up next we go.
Going up next can be a major development because of the force of the bearish wave. Billions upon billions were liquidated worth of long positions, the bears won this time, but the war is not over, the market will continue to fluctuate.
Even the daily RSI now entered the oversold range. This is no minor development, the last time the RSI traded this low was April 2025, with the same conditions, coming from a strong bearish move. As soon as this level was hit, Ethereum started to grow for months.
The RSI in isolation doesn't work. The smaller altcoins are not producing a strong reversal, there is no bullish action at all. Normally, a reversal for the big projects is anticipated by a strong breakout on the smaller projects.
We wait and see. The bearish move is over-extended. It would not be over-extended only if we are witnessing the main portion of the bearish cycle. In that case, then it can go straight down for months. If this isn't the climax, which is likely, we can easily go up.
We need more time. It doesn't look as good as before. It is weak but, from the bottom we grow. Hold strong.
Namaste.

Altcoins at Risk of a Bigger Drop Alongside BitcoinPoint 1:
In the past, breaking the 100-week moving average led to a 48% drop.
This has happened again and could result in a decline to around $420 billion market cap.
Point 2:
A rising wedge pattern that leads to a bearish move has formed, just like before.
Additionally, Bitcoin is following its 4-year cycle like clockwork, which points to a potential drop (refer to the notes in my previous analysis for details).
All geopolitical and macro factors suggest that altcoins are not an attractive option right now.
This is not financial advice—stay alert and stay safe.

BULLA PERPETUAL TRADE SELL SETUP Short from $0.39200BULLA PERPETUAL TRADE
SELL SETUP
Short from $0.39200
Currently $0.39200
Targeting $0.33100 or Down
(Trading plan IF BULLA
go up to $0.44 will add more shorts)
Follow the notes for updates
In the event of an early exit,
this analysis will be updated.
Its not a Financial advice

BTCUSDT – Higher Timeframe Uptrend | Pullback into POI & HVN ZonBitcoin remains in a clear higher-timeframe bullish structure, evolving inside a well-defined ascending channel.
After the recent distribution at the channel high, price is now pulling back toward a confluence zone:
🔹 POI aligned with Golden Zone (Fibonacci)
🔹 High Volume Node (HVN) acting as a potential support area
🔹 Sell-side liquidity taken, opening the door for a reactive bounce
This zone represents a high-probability reaction area where responsive buyers may step in if the auction accepts value above the HVN.
🔍 Scenarios:
Bullish continuation: acceptance above the POI → rotation back toward channel highs
Failure scenario: clean acceptance below HVN → deeper rotation toward lower value areas
📈 As long as price holds within the channel and above key value, the primary bias remains bullish.
Not financial advice. Always manage risk.

FDAX1FDAX1! refers to the front-month DAX Futures contract traded on the Eurex exchange. It's a cash-settled derivative based on the DAX index, tracking Germany's top 40 blue-chip companies, with each point valued at €25 per contract.
10-year German government bond yields (Bond yields) significantly affect FDAX1, as rising yields typically pressure DAX futures prices downward through higher discount rates on equities and shifts in investor preference toward bonds.
Mechanism of Influence
Rising Bond yields make bonds more attractive relative to stocks, prompting capital outflows from equities like the DAX, which depresses FDAX1 prices. They also increase corporate borrowing costs, hurting profit expectations for DAX-listed firms.
ECB rate decisions directly influence both FDAX1 (DAX futures) and German Bund yields through monetary policy signals on interest rates, inflation control, and economic growth outlooks.
Impact on Bond Yields
Rate cuts by the ECB lower short-term rates, pushing down longer-term Bond yields as investors anticipate easier policy; for instance, a 25bps cut to 2.50% in June 2025 widened eurozone yield spreads amid fiscal pressures. Hikes or hawkish guidance raise yields by signaling tighter conditions, increasing borrowing costs and term premiums, as seen with Bonds nearing 2.90% post-policy pauses.
Impact on FDAX1
Dovish ECB moves (cuts or QE) boost FDAX1 by reducing discount rates on future earnings and supporting equity valuations, though offset by trade risks; European stocks often rose modestly after such announcements. Hawkish decisions pressure DAX futures downward via higher yields competing with stocks and squeezing corporate margins.
#stocks #dax

GBPAUD (Short)News pushed priced lower, this is a potential sell pullback entry... Should at least target the structure low and the overall TP is the Daily demand low.

Gold (XAUUSD) – Simple Sell IdeaGold (XAUUSD) – Simple Sell Idea
Gold was moving up in a strong uptrend for many days.
Price was following a clear trend line support and making higher highs.
Now price reached a strong resistance / sell zone (red box area).
From this zone we can see rejection candles and a small trend line break, which shows buyers are getting weak and sellers are entering the market.
Plan Idea:
If price stays below the red zone, market can move down.
First target can be the nearest support level.
If support breaks, price may fall more to the next lower support.
Simple Explanation:
Up trend finished.
Price hit strong sell area.
Sellers are active.
Possible short-term down move expected.
Always use Stop Loss and proper Risk Management.
This is only an idea, not financial advice

My humble opinion about King crypto coin BTCIt's not much, but it's honest work.
Analysis based on vibe, i mean its low, target is high.
Money flow, bullish turtle formation.
Let's hope for the best.
I wish everyone a wonderful 2026 year.

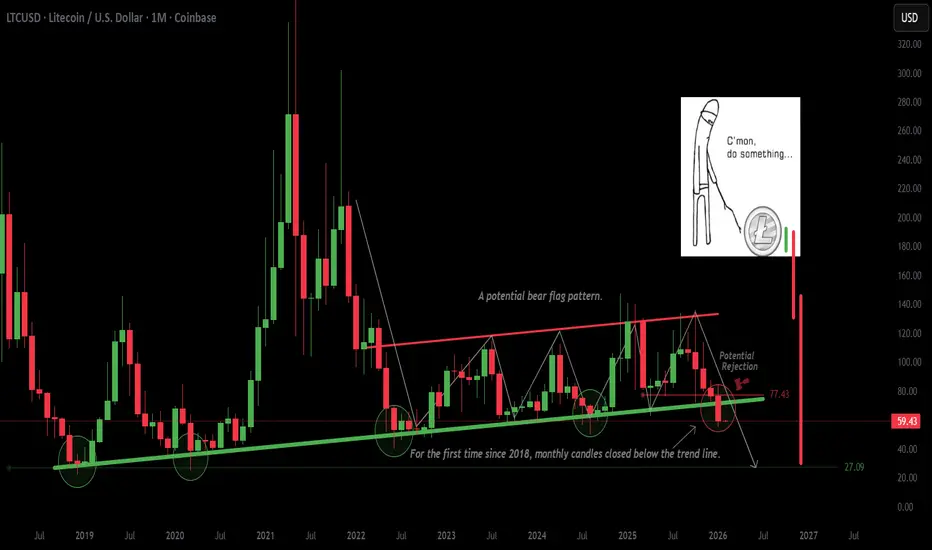
LitecoinLitecoin in potential bearish flag pattern.
Broken trend line from 2018.
Likely to test trend line in the $70 area.
If rejected, likely to start correction to $30 area.
Invalidation if close above trend line.
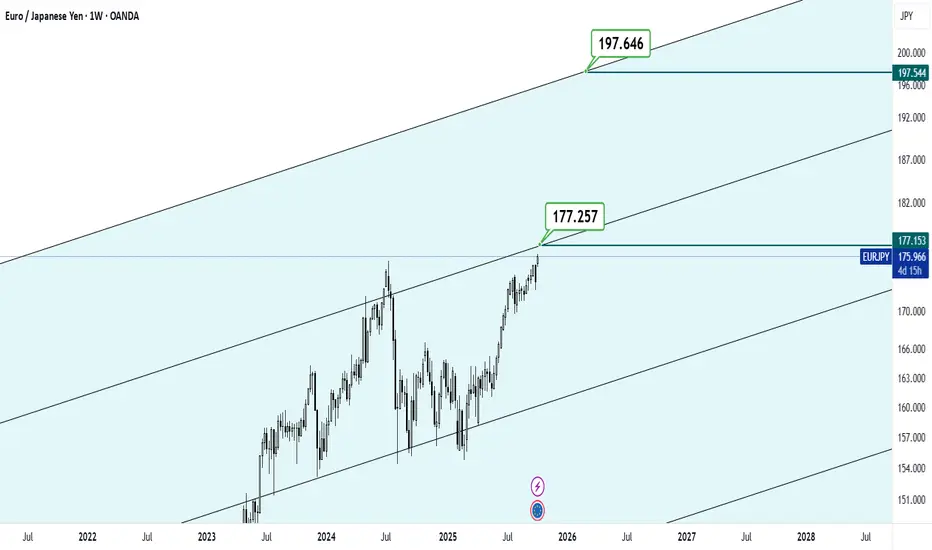
I think we should think about bigger price targets in EURJPY witWhat appears to be dynamic trends and support and resistances suggest higher price targets for this symbol!
I have two price targets in mind, short term and long term, which I have labeled in the image!
Good luck
GOLD FIB+STRUCTURE PREDICTED THE SELLOF ZONE 100%MARKET STRUCTURE ALWAYS INFORM US OF EVERY REACTION.
NOTHING LIKE MANIPLUATION IN THE FINANCIAL MARKET,WHAT WE HAVE IS DEMAND AND SUPPLY ZONE.
I WANT PRICE TO RETUREN TO THE NECKLINE OF THE INVERTED HEAD AND SHOULDER ON 4HR CHART AND I WILL BUY FROM THAT FLOOR..
EVERY RALLY HAVE A STARTING POINT .
what is gold ???
Gold is a precious metal and chemical element (Au, atomic number 79) prized for its rarity, malleability, luster, and resistance to corrosion, serving as currency, jewelry, and industrial material for millennia. Central banks buy and store gold primarily as a safe-haven reserve asset to diversify portfolios, hedge against inflation and currency devaluation, and mitigate geopolitical risks.
Key Properties
Gold's density (19.3 g/cm³), conductivity, and chemical inertness make it ideal for electronics, dentistry, and investment bars/coins. Unlike fiat currencies, its fixed supply prevents arbitrary expansion, preserving value over time.
Central Bank Motivations
Central banks hold about 36,000 tonnes globally (over 20% of all mined gold) for these reasons:
Diversification: Reduces reliance on USD or bonds; gold inversely correlates with the dollar, rising when it falls.
Inflation hedge: Fixed supply counters money printing that erodes currency value.
Geopolitical stability: No counterparty risk; neutral and seizure-resistant amid tensions
Liquidity and credibility: Easily swapped for any currency, bolsters national economic confidence.
Gold is a precious metal prized for its scarcity, durability, and role as a store of value, chemically inert and historically used in currency, jewelry, and reserves. Under Basel III banking regulations, physical allocated gold (bullion in vaults) is classified as a top Tier 1 asset with 0% risk weighting for capital requirements, equivalent to cash or sovereign bonds.
Basel III Treatment
Basel III, post-2008 reforms, upgraded gold from Tier 3 (previously discounted 50% for liquidity) to Tier 1 High-Quality Liquid Asset (HQLA) status as of July 2025, allowing banks to count it at 100% market value toward core reserves. This applies only to allocated physical gold, not unallocated "paper gold" like ETFs, which face higher funding costs.
Reasons for Tier 1 Status
Zero Risk: No credit or counterparty risk, unlike bonds tied to issuers.
Liquidity: Easily sold globally during crises, with deep markets.
Diversification: Negative correlation to fiat currencies and stocks, hedging inflation/systemic shocks.
Stability: Fixed supply bolsters bank solvency without maturity or default worries.
This elevates gold's institutional demand, tying into central bank buying trends and physical backing .
Gold prices exhibit a strong inverse relationship with both the US Dollar Index (DXY) and the 10-year US Treasury yield (US10Y), driven by opportunity cost, dollar strength, and safe-haven dynamics—rising yields/DXY typically pressure gold lower, while falls support it. Divergences occur when this expected inverse pattern breaks, signaling potential reversals or regime shifts like policy changes or crises.
Core Mechanisms
Higher US10Y yields raise the "opportunity cost" of non-yielding gold, making interest-bearing assets attractive; real yields (nominal minus inflation) matter most, with negative values bullish for gold. DXY strength (from yields attracting capital) makes dollar-denominated gold costlier for foreigners, adding downward pressure—historical correlations: gold-DXY at -0.63, gold-real rates at -0.82.
Divergence Examples
Divergences signal anomalies:
Yield-DXY split: US10Y falls (e.g., 6% drop below 4.5% in Feb 2025) while DXY rises (testing 107.6), pressuring gold despite lower yields due to dollar dominance.
Decoupling periods: 60-day DXY-US10Y correlation dips as seen in 2020-2021 crises.
Breakdowns: Extreme risk-off rallies both gold and bonds, or central bank buying overrides yields.
GOLD IS THE NEW MONEY AND HAS ALWAYS BEEN MONEY,SO IF YOUR DONT HAVE PHYSICAL GOLD YOU DONT HAVE GOLD ,FORGET ABOUT PAPER GOLD YOU ARE TRADING.
#GOLD #XAUUSD

Energy Select Sector SPDR Fund #XLE is ready to repeat the heroiXLE is a U.S. energy sector ETF from the SPDR lineup ⚙️🇺🇸
🧩 What’s inside the fund
The largest oil & gas giants:
▪️ Exxon Mobil ⛽
▪️ Chevron Corporation 🛢️
▪️ ConocoPhillips 🏭
▪️ EOG Resources ⛏️
▪️ Schlumberger 🔧
👉 The first two positions account for ~40–45% of the fund’s weight.
📈 When XLE rises
▪️ Oil price growth (Brent, WTI) 🛢️📈
▪️ Inflation 💸
▪️ Rotation from tech into value 🔄
▪️ Demand for “real assets” 🧱
📉 When XLE falls
▪️ Oil price decline 🛢️📉
▪️ Recession / demand slowdown 🧊
▪️ Risk-off sentiment in commodities 🚫
🎯 For a trader
XLE is a convenient tool to:
▪️ Trade the oil cycle 🛢️
▪️ Capture sector rotation 🔄
▪️ Hedge against inflation 🛡️
▪️ Follow the medium-term commodity trend ⏳
🚀 Upside potential
If oil reverses and forms a sustainable uptrend, XLE shows a potential upside of up to +60% with a target area near $76.84 🎯
When oil begins to turn, XLE typically reflects this move more cleanly and smoothly than individual oil stocks.

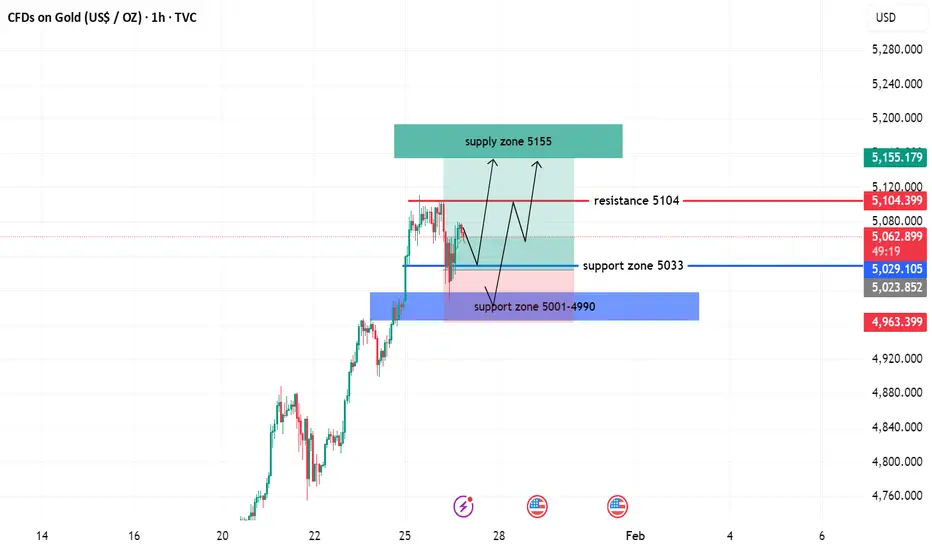
XAUUSD BULLISH ANALYSIS(READ CAPTION)Hi trader's what do you think about gold
Gold is currently showing bullish price action, with the market holding above key support levels. Buyers remain in control, and any short-term pullbacks are considered potential buying opportunities within the overall uptrend.
🟢 Primary Support: 5033
The 5033 level is acting as a strong bullish support. As long as price stays above this level, the bullish momentum is expected to continue.
🟢 Second Support Zone: 5001 – 4990
This zone represents a strong demand and accumulation area. If price retraces into this zone, buyers are likely to step in again. A clear break below 4990 would weaken the bullish structure.
📈 Market Bias
Above 5033 → Bullish trend remains valid
Pullback toward 5001–4990 → Possible buy zone
Below 4990 → Bullish setup invalidated
Overall, the market structure supports a buy-on-dips strategy while price holds above key support zones.
please don't forget to like comment and follow
GBPUSD - 1/2/2026GBPUSD and EURUSD have similar ideas.
Wait for price to break the demand zone with a close, potentially opening up the idea of further downside.
In the interim i will be looking for a pull back to the failed demand zone and a reversal or alternatively to the supply zone above for a reversal to hold to the target 1.
Target 1 and 2 will require me to take some profits and watch for a break of these demand zone.
I will keep an eye out for a reversal to jump into a bullish trade from any of the targets if the demand zones hold and the entry presents itself. The target for the bullish move will be the Daily supply zone above the latest high.

Sell euraudStrong sell continues now
Weekly and daily overbought now
Bearish correction starts now 500 pips min.. target
