The Final Ascent: BTC's $165K Launchpad Before the Great ResetBuckle up. This isn't just another chart; it's the roadmap for the most critical phase of Bitcoin's current cycle. We're witnessing the final act of a masterpiece play out right now, and understanding this structure is the key to navigating what comes next.
Here’s the brutal, beautiful truth laid out by the tape:
The Setup: From Compression to Ignition
Remember the agonizingly long consolidation? That was the massive Falling Wedge throughout 2022 and early 2023. It was a pressure cooker, squeezing out weak hands and building immense energy. The major breakout from that Falling Wedge was the spark. It wasn't just a rally; it was the official signal that the bull market was back on. That breakout launched us into the next, more powerful pattern the Rising Wedge.
The Current Play: The Rising Wedge Journey
We are now deep inside this ascending channel. Each higher high and each higher low is creating this converging pattern a classic Rising Wedge. This is the market's way of climbing a wall of worry on a wave of increasing optimism and liquidity. But make no mistake, this structure is inherently bullish yet exhausting. It's the final leg up, the last major push to suck in every last bit of momentum before the fuel runs out.
The Target: The Cycle Peak
The geometry of this wedge is pointing to a final, spectacular blow-off top. The most probable target for the peak of this wedge is $165,000. I wouldn't be surprised to see a slight extension in the euphoria that could tag $170,000, but that's the ceiling. Based on the rhythm of this move, the clock is ticking towards a November 2025 finale. Mark it.
The Inevitable: The Great Bear & The Golden Accumulation Zone
This is the most critical part. A Rising Wedge resolution is almost always the same: a violent breakdown. The fallout from this peak will be brutal a proper crypto winter. It will shake out every over leveraged dreamer. This bear market will find its ultimate bottom, its point of maximum financial opportunity, in the $54,000 - $60,000 zone. That is not a typo. That will be the generational buying opportunity. The mother of all dips. ACCUMULATE THERE.
The Next Chapter: The $500K Horizon
That 2027 bottom won't be the end. It will be the foundation for the next cycle. The recovery from that $60k zone will be the start of Bitcoin's next, truly historic run towards a target that seems crazy today $500,000. This isn't hopium; it's the logical progression of the four year cycle, adoption curves, and the patterns that have always governed this market.
The Bottom Line:
We are in the final, parabolic stage. Target $165K+ by Nov 2025. Then, prepare for the storm. The real-life changing wealth won't be made at the top; it will be made by those with the courage and dry powder to buy relentlessly in the $54k-$60k pit of despair in 2027.
This is the plan. Trade accordingly.
Community ideas

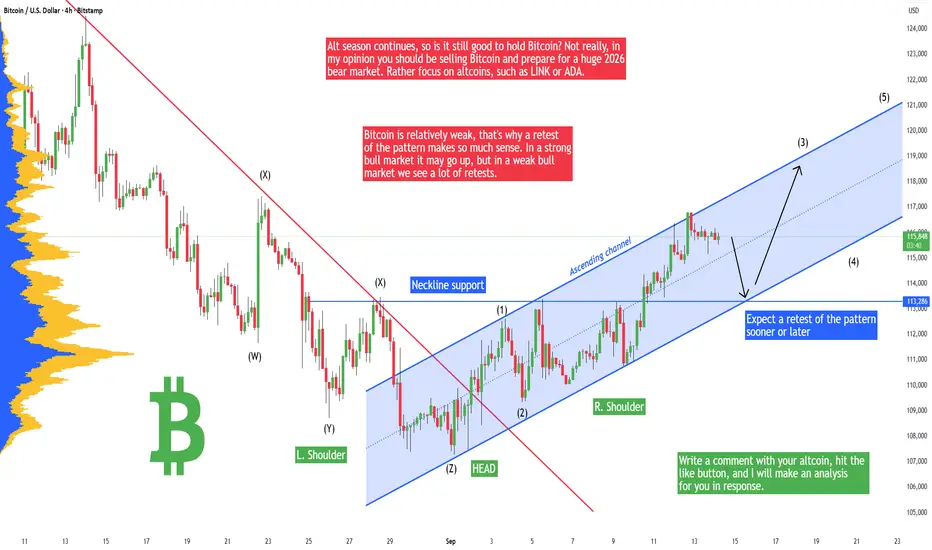
Bitcoin - Must go down to retest this pattern + new ATH soon!Bitcoin recently broke out of the head and shoulders pattern and made a pretty strong uptrend. That's a sign of strength that Bitcoin will be ready to continue in the uptrend and go to a new all time high, but not yet! I still think that Bitcoin should retest the previous Head and Shoulders pattern at around 113,300 USD. It's because this is an important liquidity level and there are a lot of orders from traders, in other words - it's a strong point of interest.
Alt season continues, so is it still good to hold Bitcoin? Not really, in my opinion you should be selling Bitcoin and prepare for a huge 2026 bear market. I expect Bitcoin to go down to 60k - 70k, but this is for another analysis. I really do not recommend buying Bitcoin, rather focus on altcoins, such as LINK or ADA. There is a potential of 50% to 200% profit in the next weeks, this is not possible on Bitcoin!
Bitcoin is relatively weak, that's why a retest of the pattern makes so much sense. In a strong bull market it may go up, but in a weak bull market we see a lot of retests. It's even possible that Bitcoin will go a little bit below the head and shoulders neckline to test the 112k level or so. So be prepared for it!
Write a comment with your altcoin + hit the like button, and I will make an analysis for you in response. Trading is not hard if you have a good coach! This is not a trade setup, as there is no stop-loss or profit target. I share my trades privately. Thank you, and I wish you successful trades!
XAUUSDHello Traders! 👋
What are your thoughts on Gold?
Gold has entered a corrective phase after printing a new high and is currently consolidating within a clearly defined channel.
The price is fluctuating inside this channel and may even test the lower boundary before continuing higher.
As long as gold remains within the channel, sideways to slightly downward movement can be expected in the short term.
A bullish breakout above the channel would likely act as a trigger for the next impulsive move, potentially leading to a new all-time high.
This week, the U.S. interest rate decision will be in the spotlight, which could significantly impact gold’s next move.
Wait for a confirmed breakout before entering long. Premature entries within the range may face choppy action.
Don’t forget to like and share your thoughts in the comments! ❤️

Bitcoin Ready To Moon Or Crash Crowd Mindset DecidesIs now the time to buy, or should we run away?
Why do most traders make the wrong move at the most critical moment?
Bitcoin today is not just an asset, it’s a live psychology test of the entire crowd.
Hello✌️
Spend 2 minutes ⏰ reading this educational material.
🎯 Analytical Insight on Bitcoin:
Bitcoin has convincingly broken above its three-week resistance with strong bullish momentum 📈. Trading volume is exceptionally high, suggesting a continuation toward new highs. The first target indicates a potential 7% gain, while the next major level could reach $124,000 🚀.
Now , let's dive into the educational section,
🧠 Greed The Hidden Enemy of Traders
Greed often begins with a simple thought: “Let’s hold a little longer, maybe it goes higher.” That single idea has wiped out millions of dollars in this market. In bull runs, crypto is designed to trigger this feeling. Green candles in a row, optimistic news, and analysts calling for unrealistic targets all convince traders to keep holding.
😨 Fear The Trigger of Wrong Sells
If greed traps you at the top, fear traps you at the bottom. The moment screens turn red, fear dominates. Panic spreads through news headlines, social posts, and rumors. Your mind wants to escape pain, so you smash the sell button.
🐳 Whales and Their Psychological Games
Whales are the best psychologists in the market. They know how the crowd thinks, fears, and reacts. By injecting sudden buy or sell pressure, they create fake moves that trigger thousands of liquidations.
For example, in futures markets whales often manipulate price just enough to hit stop-loss clusters. Retail traders believe “the market is against me,” but in reality they are against themselves. The whales don’t move price randomly they move it exactly where the crowd’s emotions are most vulnerable.
🔍 Why Technical Analysis Alone Is Not Enough
Indicators are great, but they can’t explain why you panic at support or get greedy at resistance. A trendline won’t tell you why you exit right before a reversal. Technical analysis is only the map; trading requires controlling emotions while driving on that map.
That’s why two traders can look at the same chart and get completely different results: one profits because he manages his psychology, the other loses because he doesn’t.
🚀 Ready for Explosion or Collapse?
Right now Bitcoin stands at a turning point. Macro news, trading volumes, and the Fear and Greed Index all show a sensitive zone. A single spark could push BTC into new highs or deep corrections.
But the real driver won’t be candles or lines it will be the crowd’s reaction to them. If traders once again follow fear and greed blindly, the cycle repeats. If they finally learn to step aside from the crowd, they have a real chance to win.
📊 TradingView Tools and Market Psychology
When it comes to Bitcoin, nothing is more important than understanding crowd sentiment. The Fear and Greed Index is one of the best tools you can integrate into TradingView charts for a bigger picture. When this index shows extreme fear, it means the majority is selling and that’s exactly where big players step in. On the other hand, extreme greed often signals serious danger.
Another useful TradingView feature is the Volume Profile indicator. It shows where most trades occurred and in which zones traders are mentally trapped. When you combine this with the Fear and Greed Index, you get a clear vision of when the crowd is about to face either a massive breakout or a brutal sell-off.
You can also apply Sentiment Indicators and Social Volume Tools directly on TradingView charts to see how emotions reflect in real-time. For example, when social discussion around Bitcoin spikes while price stays flat, the market is quietly preparing for a major move. This makes your analysis more than just price action; it becomes a psychological guide for every trader reading it.
🎯 Conclusion
Bitcoin’s market is not just numbers and charts it’s a battlefield of emotions. With the right tools on TradingView, you can see crowd psychology more clearly and prepare ahead of the masses. The secret to survival is simple: manage your emotions before the market manages them for you.
💡 Five Golden Advices for Survival in This Market
Always define your exit plan before entering a trade, never after.
If everyone is buying with excitement, pause the market usually rewards those who wait.
In moments of extreme fear, don’t rush to sell; check volume and sentiment indicators on TradingView first.
Never risk all your capital on one position; proper risk management is your lifeline.
Treat your emotions as an indicator; if you feel extreme fear or excitement, that’s your signal to wait, not to act.
✨ Need a little love!
We pour love into every post your support keeps us inspired! 💛 Don’t be shy, we’d love to hear from you on comments. Big thanks, Mad Whale 🐋
📜Please make sure to do your own research before investing, and review the disclaimer provided at the end of each post.

Revealing The Secrets Of Pro Traders👋Hello everyone, if you’re just starting out with trading, this post is for you.
Trading can be exciting, but if you’re not careful, you’ll quickly become prey. Here are 5 common mistakes beginners often make:
1. Opening Too Many Positions At Once
When I first started, I thought using high leverage would help me make money quickly. But opening multiple trades at once can wipe out your account after just a small market reversal.
Example: A trader uses high leverage to buy XAUUSD, but when the price drops 10%, his account gets completely “burned.”
Solution: Always assess your personal conditions, calculate the profit you expect, how much loss you can handle, and set clear goals. I actually have a formula for this — if you’d like to know, just leave me a comment below.
2. Chasing Losses… And Losing Even More
It’s that feeling of desperation, right? You take a big loss on your first trades, then try to win it all back in the next ones, doubling down again and again… only to lose more.
I know the feeling of wanting to recover your money right away. But trying to chase losses by overtrading only makes things worse. Stop when you realize you’re acting out of emotion. Sometimes it’s better to accept a small loss and wait for a better opportunity, rather than risk blowing your account completely. That’s a hard lesson I learned from multiple wipeouts.
3. Ignoring Risk Management
Tell me you’re not guilty of this one. Many beginners think stop-losses or take-profits aren’t necessary because they believe they’ll “get lucky.” But skipping risk management is exactly why accounts get wiped out.
Example: A trader ignores stop-loss, and then unexpected news hits the market. The price reverses instantly, and the account vanishes “in a heartbeat.”
That’s why I always remind my students: set TP and SL on every trade and keep a close eye on important market news.
4. FOMO – The Fear of Missing Out
This is one of the feelings almost all of us experience when trading. Forget being an expert for a moment—when you’re new and see prices skyrocketing, with everyone around you buying, it feels like if you don’t jump in right now, you’ll miss your chance. But this impatience often leads to poor decisions. You end up buying without proper market analysis, and when losses come, you don’t even understand why—it’s simply because you were chasing the crowd.
5. The Biggest Factor – Lack of Knowledge
This one overshadows all the other mistakes. Many beginners rely only on tips from others or “tricks” without understanding indicators, technical analysis, or trading strategies. Maybe you’ve thought: “I just need to follow what others do, the market will be fine.” But in the long run, if you don’t fully understand your actions, you can’t control risk and the market will eventually knock you down. At that point, you’ll be left either begging for help or starting from scratch with your learning—too late.
In summary, success in trading comes down to three essentials:
Managing emotions
Managing risk
Continuously building knowledge and practicing consistently
In the coming posts, I’ll share more valuable lessons to help you overcome these challenges. You can study them, practice in a demo account, and then apply them to real trading when you’re ready. It will be incredibly useful.
If today’s lesson resonated with you and you’re excited for the next posts, hit the like button🚀—I’d love your support.
Good luck!

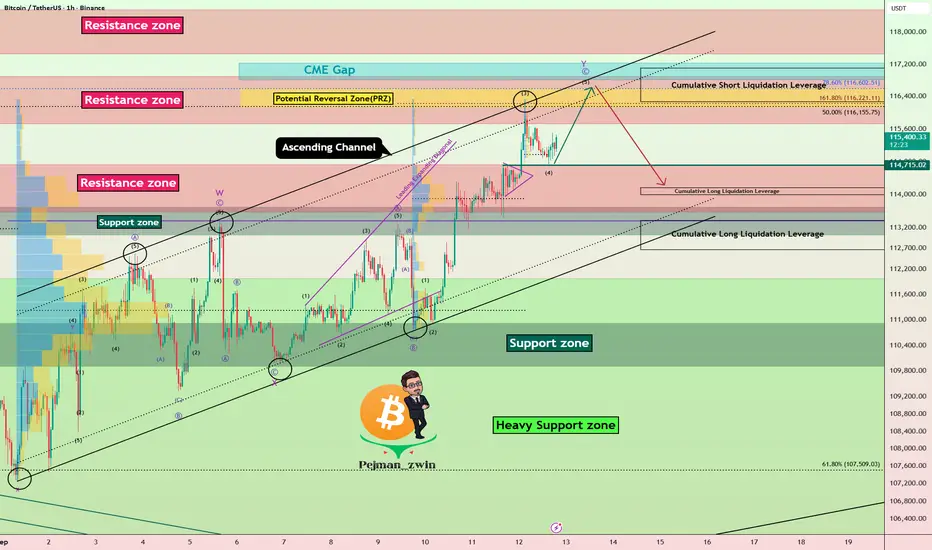
Bitcoin Roadmap | Short termBitcoin ( BINANCE:BTCUSDT ) has been experiencing a lot of volatility over the past 10 days, and the reasons for these movements could be the announcement of US indices + geopolitical issues Those who were in favor of Bitcoin caused Bitcoin to pump .
Bitcoin's movements over the past 10 days have managed to form an Ascending Channel .
In terms of Elliott Wave theory , Bitcoin appears to be completing microwave 5 of microwave C of the main wave Y .
I expect Bitcoin to try to complete main wave Y , and if we find signs of a reversal in the Resistance zone($116,900-$115,730) and Potential Reversal Zone(PRZ) , we can expect a further decline . Also, it is expected that the CME Gap($117,235-$116,820) will eventually be completed in the main wave Y .
Cumulative Long Liquidation Leverage: $114,165-$113,989
Cumulative Long Liquidation Leverage: $113,370-$112,664
Cumulative Short Liquidation Leverage: $117,102-$116,266
Please respect each other's ideas and express them politely if you agree or disagree.
Bitcoin Analysis (BTCUSDT), 1-hour time frame.
Be sure to follow the updated ideas.
Do not forget to put a Stop loss for your positions (For every position you want to open).
Please follow your strategy and updates; this is just my Idea, and I will gladly see your ideas in this post.
Please do not forget the ✅' like '✅ button 🙏😊 & Share it with your friends; thanks, and Trade safe.
GOLD WEEKLY CHART MID/LONG TERM ROUTE MAPWeekly Chart Update
3659 Target Achieved, Rejection at 3659 & now Range Play Between Key Levels
As projected, price delivered into the 3659 target after securing a weekly body close above 3576, just as anticipated. This completed the next upside step in sequence.
However, despite momentum into 3659, we did not see a candle body close and EMA5 lock above this level. The lack of confirmation left a rejection in place, establishing 3659 as firm resistance while 3576 now acts as immediate support. Price action is currently playing within this range, and a decisive break above or below will determine the next directional move.
Current Outlook
🔹 3659 Target Achieved
The weekly structure unfolded exactly as expected, with the 3576 breakout leading to a clean push into 3659.
🔹 Rejection at 3659
No body close above 3659 leaves this level as strong resistance for now. Without lock confirmation, bullish continuation into 3732 remains unconfirmed.
🔹 Range Play Between 3659 & 3576
We now look for a confirmed break above 3659 to unlock 3732, or a breakdown below 3576 that would risk pulling price back into the prior channel range.
Updated Levels to Watch
📉 Support – 3576 & 3482
Key floors for maintaining bullish structure. A break back below 3576 puts 3482 in play as the next test.
📈 Resistance – 3659 / Next Objective 3732
3659 remains the ceiling. A sustained close above here opens 3732 as the next target zone.
Plan
Price is consolidating between 3659 resistance and 3576 support. The next move depends on which boundary breaks:
Above 3659: Unlocks 3732 with bullish continuation.
Below 3576: Signals rejection and risks a deeper correction into 3482.
Thanks as always for your support,
Mr Gold
GoldViewFX

Bitcoin –> Inverse Head & ShouldersHello guys!
On the 4H chart, Bitcoin completed an inverse Head & Shoulders.
The measured target of the pattern lies near $118K, aligning with a strong resistance zone.
This level should be watched closely, as it may act as a potential reversal area.
If price rejects around $118K, we could see a pullback towards $115K – $114K.
A confirmed breakout above $118K with volume would invalidate the reversal scenario and open the way for higher levels.
Key zones:
🎯 Target / Resistance: $117.5K – $118K
Possible Reversal Zone: $118K
📉 Support: $115K – $114K
Disclaimer: As part of ThinkMarkets’ Influencer Program, I am sponsored to share and publish their charts in my analysis.

2026 Precious Metals ETF Playbook: GDX SIL PPLT Parabolic Rally🚀 2026 Precious Metals Playbook: Why GDX, SIL & PPLT Could Go Parabolic
________________________________________
🏁 Gold’s 2025 melt-up has flipped the script: spot blew through records and major banks now float targets near $3,800 by late-2025 and ~$3,900 by mid-2026. With expected Fed cuts, a softer USD, and persistent central-bank buying, the macro setup could keep miners turbocharged into 2026.
🧲 At the same time, robust demand (ETF inflows + central banks) even with real yields elevated shows that “fear and fiscal” have joined real rates as primary drivers. That’s the kind of buyer base that can underpin a blow-off leg higher in gold.
🔥 The gamma-squeeze setup is real in commodities too: heavy call buying can force dealers to chase deltas in futures, adding fuel to upside. If momentum reignites, gold’s second leg could shock even the bulls.
⚡️Silver is riding a different (but rhyming) story: persistent structural deficits and 14-year-high prices, with industry demand led by solar PV, electronics, EVs—and increasingly high-end compute/AI infrastructure where silver-bearing solders, contacts, and power electronics are critical.
☀️Macro tailwinds for silver’s industrial side look alive into 2026: PV installations, grid storage rollouts, and electrification keep factory demand stout—even with ongoing thrifting. Sheer volume growth can still outmuscle intensity declines.
🛠️Platinum’s bull case hinges on multi-year market deficits, entrenched autocatalyst substitution from palladium, and optionality from the early hydrogen economy. Supply hiccups in South Africa, paired with steady auto/industrial draws, can squeeze inventories quickly.
________________________________________
🎯 Aggressive 2026 Scenarios & Targets
🧭 Premise: a “second-leg” melt-up where gold futures extend from ~$3,500 toward ~$7,000 (+100%) via treasury-to-hard-assets rotation and options-driven squeezes; silver plays catch-up with an industrial/safe-haven crescendo; platinum rides persistent deficits and auto/hydrogen demand.
GDX — VanEck Gold Miners ETF
Aggressive 2026 price target: $150–$220 (vs. ~$70 now).
Why it could happen:
• 💹 Margin math: with AISCs roughly anchored, every +$1000/oz in gold drops largely to miner margins, historically producing 2–3× sensitivity in equities vs. the metal.
• 🔁 Flow catalysts: ETF inflows, central-bank buying, CTA trend signals, and options gamma dynamics can stack.
• 🏦 Treasury rotation: if real yields slide and fiscal angst lingers, the allocation shift into gold miners can snowball.
SIL — Global X Silver Miners ETF
Aggressive 2026 price target: $95–$130 (vs. ~$66 now).
Why it could happen:
• 🏭 Industrial drumbeat: PV growth into 2026 + electrification keeps factory demand strong—even with thrifting.
• 🧮 Deficit persistence: multiple years of market deficits tighten balances and prime upside tails.
• 🧠 AI halo effect: data-center buildouts and advanced packaging sustain electronics demand where silver’s conductivity wins, adding narrative firepower to price action.
PPLT — abrdn Physical Platinum Shares
Aggressive 2026 price target: $250–$375 (vs. ~$128 now).
Why it could happen:
• ⛏️Deficits, again: without a step-change in mine supply, persistent market shortfalls can spark violent repricing.
• 🚗 Sticky substitution: platinum that replaced palladium in gasoline autocats is embedded in designs—demand that doesn’t easily reverse.
• 🔋 Optionality: PEM electrolyzers/fuel cells (hydrogen) magnify the upside if policy or energy security tightens timelines.
________________________________________
🧭 2026 Primary Drivers to Track
🏛️Monetary & macro: Fed path, USD, and real yields remain core—if they trend down, gold’s opportunity cost falls and risk-hedging bids rise.
🏦 Official sector: Central-bank purchases have become a structural pillar—watch for continuity (or pauses) in monthly updates.
📈 Flows & positioning: ETF creations, futures options open interest, and CTA signals can amplify moves far beyond fundamentals (gamma-squeeze dynamics).
Industrial pulse (silver): PV installations, EV production, grid/storage rollouts, and semiconductor packaging demand. Even with thrifting, sheer volume growth can drive sustained demand. 🔌
________________________________________
🔍 Other High-Octane Catalysts To Watch
🧩 Policy whiplash: tariffs, clean-energy incentives, and regional manufacturing policies can shift where PV growth lands, but global additions remain robust into 2026.
🌍 Geopolitical risk: commodity sanctions, shipping disruptions, and elections tend to feed gold’s safe-haven bid and can intermittently kink PGM supply chains.
⚙️South Africa power stability: any setbacks could crimp platinum supply; under-investment keeps the system fragile even with recent improvements.
________________________________________
🧱 Positioning Blueprint (conceptual, not advice)
🧮 In a $7k gold blue-sky, miners should outrun the metal (margin + duration), silver miners should over-beta gold if the PV/AI/EV demand boom continues, and platinum offers clean metal-beta through PPLT. Platinum miners could add torque but also carry South Africa–specific risks.
⚠️Risks: inflation re-acceleration forcing hikes, a USD surge, ETF liquidation waves, PV-demand disappointments, or supply snap-backs could maul these targets; miners also carry idiosyncratic risks (cost inflation, permitting, geopolitics).
________________________________________
🎯 Targets (2026 “go-for-it” bull case)
• 🎢 GDX: $150–$220 on 2–3× torque to a gold melt-up, plus multiple expansion.
• 🧪 SIL: $95–$130 if silver sprints on deficits + PV/AI/EV demand, with miners over-beta.
• 🧰 PPLT: $250–$375 with sustained platinum deficits and sticky auto substitution.

Gold Price Outlook – Bulls in Control👋Hello everyone, let’s take a look at OANDA:XAUUSD today!
Over the past week, gold has moved steadily upward, holding above the psychological 3,600 USD zone. At present, the bulls remain in control, keeping price action around 3,645 USD.
Gold continues to benefit from a weaker USD following recent economic data. Rising unemployment claims and expectations that the Fed will maintain a dovish stance have provided strong support for gold to stay above 3,600 USD.
From a technical perspective, the precious metal is extending its rally toward key Fibonacci expansion targets. The 2.618 extension is being tested, with potential to push higher toward the 3.618 level. This aligns with the Elliott Wave structure, where wave (3) is near completion, likely followed by a brief correction into wave (4), before a breakout into wave (5).
The next psychological targets are 3,700 and 3,800 in the medium term. The main trend remains bullish, with critical support resting at 3,550 – 3,600 USD. As long as gold holds above this zone, the strategy of buying on dips to capture wave (5) remains valid.
What do you think about gold’s outlook? Share your thoughts in the comments!
Good luck!

GOLD 1H CHART ROUTE MAP UPDATE & TRADING PLAN FOR THE WEEKHey Everyone,
Please see our updated 1h chart levels and targets for the coming week.
We are seeing price play between two weighted levels with a gap above at 3653 and a gap below at 3622. We will need to see ema5 cross and lock on either weighted level to determine the next range.
We will see levels tested side by side until one of the weighted levels break and lock to confirm direction for the next range.
We will keep the above in mind when taking buys from dips. Our updated levels and weighted levels will allow us to track the movement down and then catch bounces up.
We will continue to buy dips using our support levels taking 20 to 40 pips. As stated before each of our level structures give 20 to 40 pip bounces, which is enough for a nice entry and exit. If you back test the levels we shared every week for the past 24 months, you can see how effectively they were used to trade with or against short/mid term swings and trends.
The swing range give bigger bounces then our weighted levels that's the difference between weighted levels and swing ranges.
BULLISH TARGET
3653
EMA5 CROSS AND LOCK ABOVE 3653 WILL OPEN THE FOLLOWING BULLISH TARGETS
3678
EMA5 CROSS AND LOCK ABOVE 3678 WILL OPEN THE FOLLOWING BULLISH TARGET
3702
EMA5 CROSS AND LOCK ABOVE 3702 WILL OPEN THE FOLLOWING BULLISH TARGET
3727
EMA5 CROSS AND LOCK ABOVE 3727 WILL OPEN THE FOLLOWING BULLISH TARGET
3747
EMA5 CROSS AND LOCK ABOVE 3747 WILL OPEN THE FOLLOWING BULLISH TARGET
3768
BEARISH TARGETS
3622
EMA5 CROSS AND LOCK BELOW 3622 WILL OPEN THE FOLLOWING BEARISH TARGET
3585
EMA5 CROSS AND LOCK BELOW 3585 WILL OPEN THE SWING RANGE
3556
3528
As always, we will keep you all updated with regular updates throughout the week and how we manage the active ideas and setups. Thank you all for your likes, comments and follows, we really appreciate it!
Mr Gold
GoldViewFX

Euro will reach seller zone and then start to fallHello traders, I want share with you my opinion about Euro. The market for the Euro is currently positioned at a critical inflection point, as a prolonged period of consolidation appears to be nearing its resolution. After transitioning from a prior downward channel, the price action for EURUSD has been contained within a large symmetrical triangle, a pattern of contracting volatility. This structure has been defined by a clear descending resistance line and an ascending support line, anchored by the major seller zone and the buyer zone. At present, the asset has rallied from the support line and is now directly testing the upper boundary of this triangle. This area represents a powerful confluence of resistance, where the dynamic trendline meets the horizontal seller zone near the 1.1730 Resistance Level. The primary working hypothesis is a short, rotational scenario, based on the expectation that this resistance will hold. A confirmed rejection from this 1.1730 - 1.1750 area would validate the integrity of the triangle and signal that another major swing to the downside is underway. Therefore, the TP is logically placed at 1.1620 поинтов, a key target located in a high-liquidity area on the path towards the main 1.1575 support level. Please share this idea with your friends and click Boost 🚀

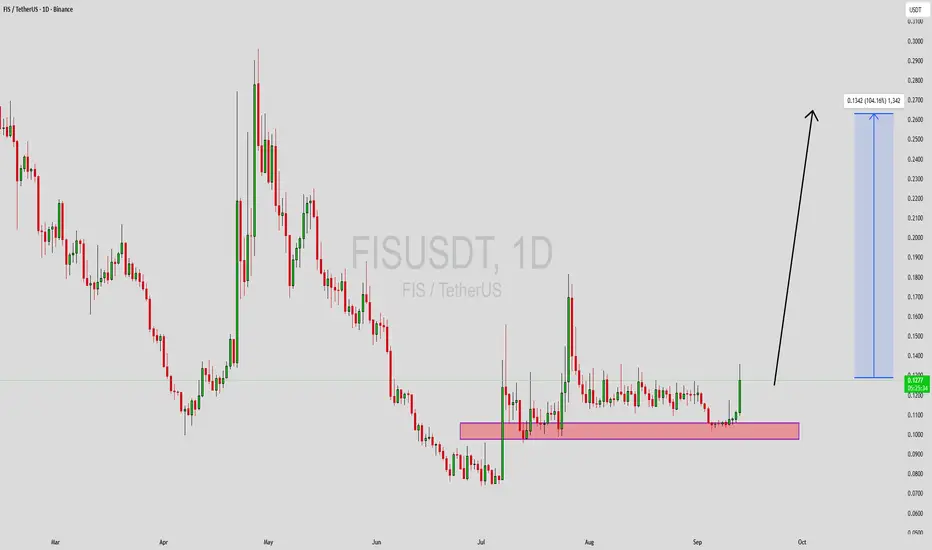
FISUSDT Forming Bullish MomentumFISUSDT is showing a strong breakout move after consolidating for weeks in a key support accumulation zone. The daily chart highlights bullish momentum with price breaking out from its base, supported by increasing volume that signals rising investor interest. This kind of structure often leads to explosive upside moves as market sentiment shifts in favor of buyers.
With an expected gain potential of 90% to 100%+, this breakout setup offers traders a solid opportunity for high returns. The chart projection points toward a significant upside rally, and the current breakout zone could serve as the foundation for further continuation.
Investors are starting to pay close attention to FIS as the breakout gains traction, positioning it as one of the most promising setups in the market right now. A sustained close above the breakout level may confirm the next bullish leg, paving the way toward higher resistance levels.
✅ Show your support by hitting the like button and
✅ Leaving a comment below! (What is You opinion about this Coin)
Your feedback and engagement keep me inspired to share more insightful market analysis with you!
Gold Correction After ATH – Bearish Waves Ahead?Gold( OANDA:XAUUSD ) has been in a correction mode for the past four days after creating a new All-Time High (ATH) . The question is whether the correction will continue or not.
Over the past 4 days, US indices were released, but Gold was not greatly affected by these indices, although the manner in which the US indices were announced was in favor of Gold ( Maybe gold is saturated with buying. ).
Gold is currently trading in the Support zone($3,644-$3,636) and near the Support line.
In terms of Elliott Wave theory , it seems that Gold has completed the Double Three Correction structure(WXY), and we can expect bearish waves .
I expect Gold to break the Support zone($3,644-$3,636) AFTER breaking the Support line and fall to at least $3,624(First Target) .
Second Target: Support lines
Stop Loss (SL) = $3,662
Please respect each other's ideas and express them politely if you agree or disagree.
Gold Analyze (XAUUSD), 15-minute time frame.
Be sure to follow the updated ideas.
Do not forget to put a Stop loss for your positions (For every position you want to open).
Please follow your strategy; this is just my idea, and I will gladly see your ideas in this post.
Please do not forget the ✅ ' like ' ✅ button 🙏😊 & Share it with your friends; thanks, and Trade safe.

Scenarios vs. Certainties: The Shift Serious Traders MakeWhy Certainty Destroys Traders
Every losing trader I’ve ever met had one thing in common: they wanted certainty.
“This setup will definitely work.”
“This pair must go up.”
But markets don’t work like that. They don’t reward certainty — they reward adaptability. The difference between amateurs and professionals? Amateurs bet on one fixed outcome. Professionals prepare for scenarios.
________________________________________
The Trap of Certainty
When you lock your mind on just one outcome, two things happen:
• You become emotionally tied to it — when it fails, you spiral.
• You ignore new information — even when the chart screams something changed.
That’s how a manageable trade turns into a disaster.
________________________________________
Building Scenarios Instead of Certainty
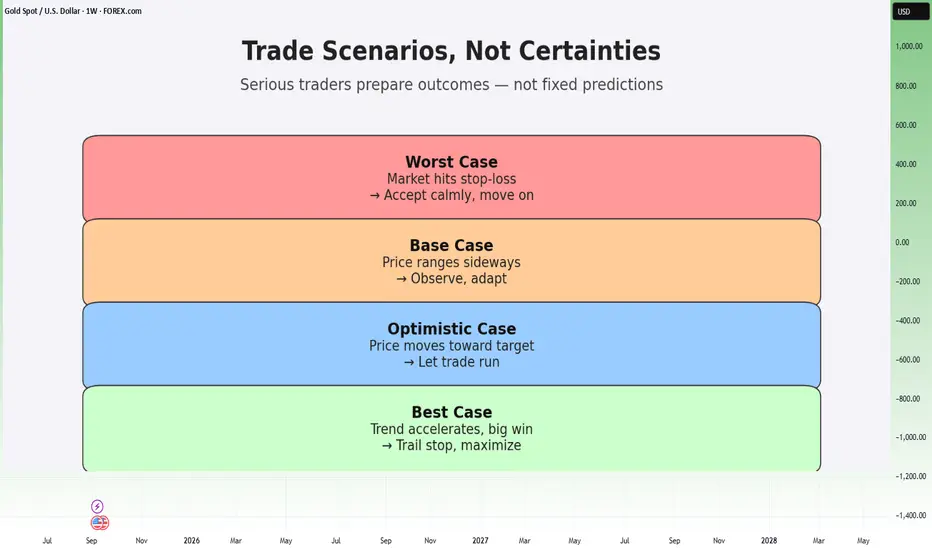
A professional trader prepares a mental map of outcomes before taking a position:
1. Worst Case
• Market goes directly against your entry
• Hits stop-loss
• ✅ Response: Accept loss calmly, move on
2. Base Case
• Price fluctuates, stays inside a range
• No clear follow-through yet
• ✅ Response: Observe, adapt, maybe scale out, close all or adjust stop
3. Optimistic Case
• Price moves steadily toward target
• Smooth momentum, plan unfolds
• ✅ Response: Let the trade run, stick to plan
4. Best Case
• Trend accelerates, profit exceeds expectations
• Move continues further than projected
• ✅ Response: Move take profit further, trail stop, lock in gains, maximize opportunity
________________________________________
Why This Works
• You’re emotionally prepared: no outcome shocks you.
• You stay flexible: adapting without panic.
• You build consistency: no more swinging between overconfidence and despair.
________________________________________
How to Apply This Today
1. Before entry, write down at least 3–4 scenarios (worst, base, optimistic, best).
2. Decide in advance: what will you do in each case? Close early, adjust, or let it run?
3. After the trade: review which scenario played out and how you reacted.
Do this for 10 trades, and you’ll notice less stress, more clarity, and better discipline.
________________________________________
Conclusion – From Gambler to Strategist
Amateurs crave certainty. Professionals build scenarios.
The market will always surprise you — but if you’ve already prepared for multiple paths, you’ll never be caught off guard. That’s how you stay disciplined, calm, and profitable.
________________________________________
👉 Challenge for you: On your next trade, write down at least three scenarios before you enter. Track which one unfolds. This habit alone can transform your trading mindset. 🚀
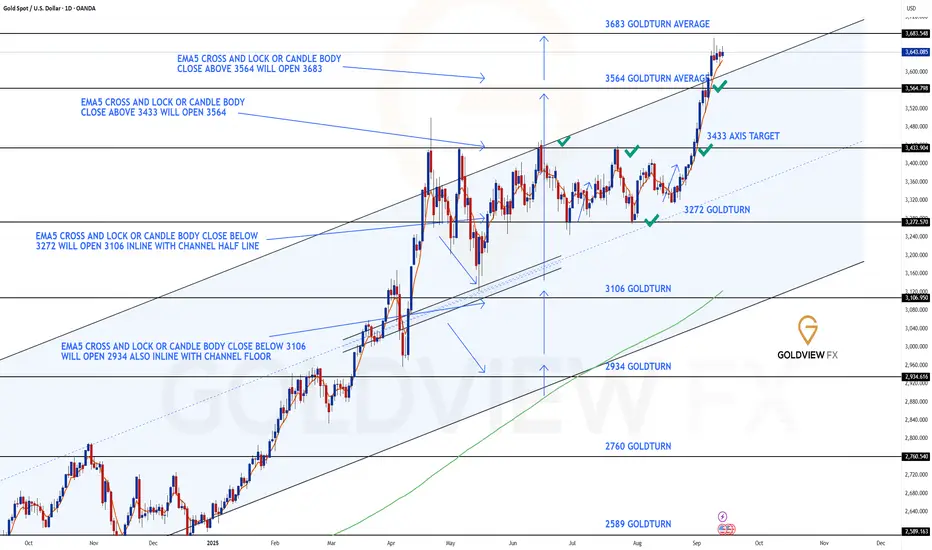
GOLD DAILY CHART ROUTE MAPDaily Chart Update
3564 Target Hit, Fresh Gap at 3683 & Breakout Confirmation
As projected in our previous update, the 3564 target has now been reached perfectly following EMA5 lock confirmation above 3433. This milestone completes the initial breakout structure and validates the bullish momentum sequence laid out earlier.
With 3564 achieved, price action has now opened a long-range gap toward 3683. The EMA5 cross and lock above 3564 provides strong continuation evidence, but we must now monitor whether support can be sustained above the channel top. A successful hold here will confirm continuation higher; however, a break back within the channel would classify this as a fake breakout attempt.
Current Outlook
🔹 3564 Target Reached
Upside momentum played out as expected, with EMA5 lock above 3433 providing early confirmation. The move delivered a clean hit of the 3564 target zone.
🔹 Next Objective – 3683
Momentum now extends toward 3683, with EMA5 lock above 3564 giving weight to this projection. Sustaining price above the channel top remains crucial to validating the next leg higher.
🔹 Breakout Validation Needed
Continuation depends on maintaining support above channel resistance. Failure to hold here risks invalidating the breakout and shifting price back into the prior range.
Updated Key Levels
📉 Support – 3272 (pivotal floor)
📉 Short-Term Supports – 3433 & 3564
📈 Resistance / Next Upside Objective – 3683
Thanks as always for your continued support,
Mr Gold
GoldViewFX
CHFJPY – Bulls Eye Fresh Highs as Momentum BuildsCHFJPY has been grinding higher after bouncing from its recent lows, and price is now testing resistance with strong bullish intent. The market is respecting its upward channel structure, and with both the franc and yen playing safe-haven roles, the battle comes down to relative central bank stances. At the moment, the Swiss franc looks stronger, keeping the upside path intact.
Current Bias
Bullish – CHFJPY continues to trend higher, with buyers in control toward key resistance.
Key Fundamental Drivers
CHF: The Swiss National Bank (SNB) remains cautious but is less dovish than the BoJ, allowing CHF to retain strength.
JPY: The yen is supported by safe-haven flows but capped by BoJ’s slow exit from ultra-loose policy.
Rate spreads: The differential continues to lean in favor of CHF versus JPY.
Macro Context
Interest rates: SNB has signaled less urgency to cut compared to other central banks, while BoJ is still defending easy policy despite yield adjustments.
Growth: Japan shows modest economic expansion, while Switzerland’s economy remains steady, backed by low inflation.
Geopolitical: Risk sentiment plays a key role—when risk aversion spikes, both CHF and JPY strengthen, but CHF has recently outperformed.
Primary Risk to the Trend
A sudden shift in BoJ policy or a sharp risk-off wave could swing momentum toward JPY, cutting CHFJPY’s upside potential.
Most Critical Upcoming News/Event
SNB policy outlook and any intervention chatter.
BoJ commentary around yield curve control and inflation targets.
Leader/Lagger Dynamics
CHFJPY often acts as a lagger, following broader safe-haven demand trends shaped by USDJPY and EURCHF. It tends to react after JPY crosses move, rather than leading.
Key Levels
Support Levels: 184.79, 183.84
Resistance Levels: 185.74, 186.70
Stop Loss (SL): 183.84
Take Profit (TP): 186.70
Summary: Bias and Watchpoints
CHFJPY bias is bullish, with SL at 183.84 and TP at 186.70. CHF’s relative resilience against JPY keeps the upside favored, especially as SNB remains firmer compared to BoJ. The key watchpoints are SNB policy tone and Japanese yield commentary, which could shift the balance. Unless JPY strengthens sharply on safe-haven demand, CHFJPY looks set to test higher resistance levels.

NZDUSD Pullback Toward 0.59300 Within Ongoing UptrendHey Traders, in the coming week we are monitoring NZDUSD for a buying opportunity around the 0.59300 zone. The pair is trading in an uptrend, with price currently correcting toward this key support/resistance level.
Structure: The broader bias remains bullish, though price is pulling back after recent highs.
Key level in focus: 0.59300 — an important area where buyers may look to step in and resume the upward trend.
Fundamentals: Broader USD weakness and improving risk sentiment continue to favor commodity-linked currencies like NZD, making this level one to watch closely.
Trade safe,
Joe.

THE KOG REPORT THE KOG REPORT:
In last week’s KOG Report we said we would be looking for price to attempt the lower red box, and if held a move upside would be available into the box above. This move worked well for traders and the entry came exactly from our Excalibur red box. We then ideally wanted the higher box to give us a RIP, however, as you can see price broke above first on our indicators and then on the box shared with everyone else. Hence invalidating the short trade and activating the long which was then shared in our updates through the week.
We managed to trade between the boxes and of course Excalibur our trusted algo again performed with the pin point target levels.
A decent week in Camelot, not only on Gold, but on the other instruments we trade and analyse as well.
So, what can we expect in the week ahead?
I would expect Monday and early Tuesday to be the main days for movement before FOMC this week which may bring volume, but initial thoughts are we’re priced in! For that reason, we’ll share this report and say it’s applicable until Wednesday, which is when we will share the KOG Report for FOMC.
We have support below at the 3620-12 region which is a big range and will need to be monitored if attacked early in the week. If this level holds, an opportunity to long may be available to trades targeting the all time high again and most likely beyond in attempt for the 3700 region. It’s that region we would like to monitor again for a possible short, unless we break below the 3610 level.
The path shows the possible route, a move downside, then up where there are 3 levels to monitor, and a potential move downside in our opinion. It is as usual, subject to change and will be updated if through the week. For now, we’re still stretched with sentiment near neutral, we need to complete the swing upside with the key level of support being the 3606-10 level in extension. If we break below there, we have a clean reversal and what bears will want, is to see the low 3500’s at least! This level could be a possibility on Wednesdays FOMC, so stay tuned!!
In summary:
We want to see this move down commence so longs are with caution for us at the moment with the hope that one of these resistance levels can give us a major RIP. We need to monitor this carefully and will be implementing a scalp only strategy upside for now.
KOG’s Bias of the week:
Bullish above 3610 with targets above 3655, 3667, 3671 and above that 3686
Bearish on break of 3610 with targets below 3605, 3597, 3580, 3565 and below that 3540
RED BOX TARGETS:
Break above 3645 for 3654, 3657, 3670, 3685 and 3702 in extension of the move
Break below 3630 for 3620, 3610, 3605, 3597 and 3885 in extension of the move
Please do support us by hitting the like button, leaving a comment, and giving us a follow. We’ve been doing this for a long time now providing traders with in-depth free analysis on Gold, so your likes and comments are very much appreciated.
As always, trade safe.
KOG

BTC should fall to 96,000$ within the next 10 days!As expected, we predicted the pump to 114,228$ and now the bearish leg should start in tremendous fashion.
check out our page for how accurate our calls have been through SPX to BTC.

Bitcoin - Heading lower after hitting resistance?Introduction
Looking at the current 4-hour Bitcoin chart, we can see that price action is moving into a crucial zone. After a strong upward move, Bitcoin has reached an area of resistance where multiple factors align, making it an important level to watch. The chart highlights fair value gaps (FVGs) both above and below, which are key points that could influence the next move. By analyzing these areas, we can form a clearer idea of the potential short-term trend and what traders might expect in the coming days.
Bearish 4h FVG resistance and liquidity grab
At the moment, price is testing a strong resistance level, which coincides with a 4-hour fair value gap. This area has already absorbed much of the short-side liquidity, meaning that stop losses from traders positioned against the uptrend have been triggered. This liquidity grab often signals exhaustion in the upward move and can serve as the starting point for a retracement. The resistance zone is proving to be difficult to break, and if the market fails to hold above it, we could see a shift in momentum toward the downside.
4h bullish FVG to hold
Just below the current price, there is a 4-hour bullish fair value gap that could act as support in the short term. If buyers step in and defend this area, it may temporarily stabilize the market and create a bounce. However, if this support fails to hold, it would open the path for further downside movement. The chart suggests that a break below this level would likely drive Bitcoin toward the next major target around the $112,000 region. This makes the bullish FVG a key decision point for the market.
Target for the short
If Bitcoin cannot sustain its position above the highlighted resistance zone, the downside target becomes more clear. The lower 4-hour fair value gap, sitting closer to $112,000, is marked as the target for the short. This is where price is likely to be drawn in order to rebalance inefficiencies left behind in the chart. Traders looking for bearish opportunities would see this as the logical area to aim for, as the market often gravitates toward unfilled gaps after liquidity grabs at the top.
Final thoughts
In conclusion, Bitcoin is currently at a critical point. The resistance area combined with the 4-hour FVG has absorbed liquidity, creating the possibility for a downward move. The short-term bullish FVG below is the level to watch, as a break here could confirm bearish continuation toward $112,000. On the other hand, if buyers manage to hold the current support, the structure may remain intact and prevent deeper downside. Overall, the chart suggests that the path of least resistance may now be lower, unless the market proves otherwise by breaking convincingly above resistance.
-------------------------
Thanks for your support. If you enjoyed this analysis, make sure to follow me so you don't miss the next one. And if you found it helpful, feel free to drop a like 👍 and leave a comment 💬, I’d love to hear your thoughts!

GOLD 4H CHART ROUTE MAP UPDATE & TRADING PLAN FOR THE WEEKHey Everyone,
Please see our updated 4h chart levels and targets for the coming week.
We are seeing price play between two weighted levels with a gap above at 3655 and a gap below at 3615. We will need to see ema5 cross and lock on either weighted level to determine the next range.
We will see levels tested side by side until one of the weighted levels break and lock to confirm direction for the next range.
We will keep the above in mind when taking buys from dips. Our updated levels and weighted levels will allow us to track the movement down and then catch bounces up.
We will continue to buy dips using our support levels taking 20 to 40 pips. As stated before each of our level structures give 20 to 40 pip bounces, which is enough for a nice entry and exit. If you back test the levels we shared every week for the past 24 months, you can see how effectively they were used to trade with or against short/mid term swings and trends.
The swing range give bigger bounces then our weighted levels that's the difference between weighted levels and swing ranges.
BULLISH TARGET
3655
EMA5 CROSS AND LOCK ABOVE 3655 WILL OPEN THE FOLLOWING BULLISH TARGETS
3696
EMA5 CROSS AND LOCK ABOVE 3696 WILL OPEN THE FOLLOWING BULLISH TARGET
3738
BEARISH TARGETS
3615
EMA5 CROSS AND LOCK BELOW 3615 WILL OPEN THE FOLLOWING BEARISH TARGET
3583
EMA5 CROSS AND LOCK BELOW 3583 WILL OPEN THE FOLLOWING BEARISH TARGET
3545
EMA5 CROSS AND LOCK BELOW 3545 WILL OPEN THE FOLLOWING BEARISH TARGET
3509
EMA5 CROSS AND LOCK BELOW 3509 WILL OPEN THE SWING RANGE
3458
3409
EMA5 CROSS AND LOCK BELOW 3409 WILL OPEN THE SECONDARY SWING RANGE
3360
3320
As always, we will keep you all updated with regular updates throughout the week and how we manage the active ideas and setups. Thank you all for your likes, comments and follows, we really appreciate it!
Mr Gold
GoldViewFX

ETH to 3,054$ in NO TIME!You can expect what's written on the title. Check my profile out, you'll be astonished how accurate this page is. Lastly, this pump was also predicted in our last post.
