Bitcoin - Sacrificed by the banks! (100k, then 130k - buy here)Bitcoin and the whole crypto market have been dropping heavily these days. And I know why! You may wonder, why is Bitcoin in such a weak uptrend, and why do the majority of altcoins never grow, or after a small pump, a huge dump follows? Finally, I bring you the answer to this important question many of you are wondering about.
You know that the world is basically controlled by these 2 companies, BlackRock and Vanguard. So every time you visit a supermarket, you can be sure that 95% of all items are from 1 major company, so they are pretty much telling you what to eat and drink. That's public information; everyone can verify it. There is really nothing special or secret about it.
So there is no doubt that the financial markets are manipulated by whales (banks, governments, and big funds). They can very easily move the price in whatever direction they want. And because altcoins have a very low market cap, they made the price action look like a pump and dump scheme. So every time you buy a coin, you end up in a loss, because they use altcoins as a casino. That's their game, and that's how they make money in crypto. There is really no real uptrend or downtrend on altcoins; in fact, the majority of the time the market has been going down, and only sometimes do we see a big pump, but that's just a temporary event. You can be sure that the market will go down again. Please boost and comment if you agree with you.
Now, everyone is buying coins such as XRP, but what if I tell you that XRP will drop heavily in 2026 to 0.6 USD? The current price is 2.8 USD, so that's a huge crash. Yeah, the majority will find out that this was a scam, and they will sell with an 80% loss on their account into the hands of banks.
So what about Bitcoin? I expect Bitcoin to hit 100k in the next weeks! I think this is a very strong buyable support, but we need more data to confirm another uptrend to 130k! Write a comment with your altcoin, hit the like button, and I will make an analysis for you in response.
Community ideas

Gold weekly setup for new athThis chart shows a 1-hour analysis of XAU/USD (Gold vs. US Dollar).
Price is currently around $3,759, slightly above the key support trend line.
Important support levels are marked near $3,755, $3,735, and $3,723, where buyers may step in.
The short-term bullish scenario points to a possible rebound from support toward the $3,800 target, with a continuation higher to a new all-time high at $3,817.
If the price fails to hold above the support zone, it could retest lower levels before resuming an upward move.
Overall, the outlook suggests bullish momentum remains strong, with buyers targeting $3,800–$3,817, but the market may experience pullbacks before continuing higher.

Make Money Quickly Every Second👋Hello everyone!
Today, I want to share a simple yet effective scalping strategy, particularly suitable for those trading gold. With this strategy, you can optimize your profits and minimize risks during trading.
To achieve this, the first thing you need to do is create a strategy that suits your goals (profit targets, risk tolerance). I usually set my stop loss around 30 - 50 pips per trade and divide the profit into three main stages.
⭐️ Example of a Buy XAUUSD trade:
📉 ENTRY: $3,750
❗️ SL: $3,745 (50 pips)
✅ TP1: $3,753 (30 pips)
✅ TP2: $3,755 - $3,757 (50-70 pips)
✅ TP3: $3,760 ++ (>= 100 pips)
📌 TP1 – 30 Pips
If the price moves in your favor and hits $3,753 (equivalent to 30 pips), you can close part of the position if the entry was bad, and move the stop loss to the entry price ($3,750) to ensure you don't incur any loss if the market reverses.
📌 TP2 – 50-70 Pips
Close part of the profit, and move the stop loss to TP1 if you want to keep the position open. Now your SL is at $3,753, which guarantees the remaining profit and, in case of a sudden reversal, you’ve already secured 30 pips in profit.
📌 TP3 – Close All Positions
✅Close the remaining position to secure all profits and wait for future trading opportunities.
Notes:
Only use a small portion of your capital per trade to minimize risk.
Always keep up with news and technical analysis to make timely decisions (whether to hold or close the position).
Patience: Don’t rush to close the position if the market is still moving in your favor.
I hope this strategy helps you trade more effectively. Don’t forget to like this post to support me🚀, as I have more exciting content waiting for you.
Good luck!

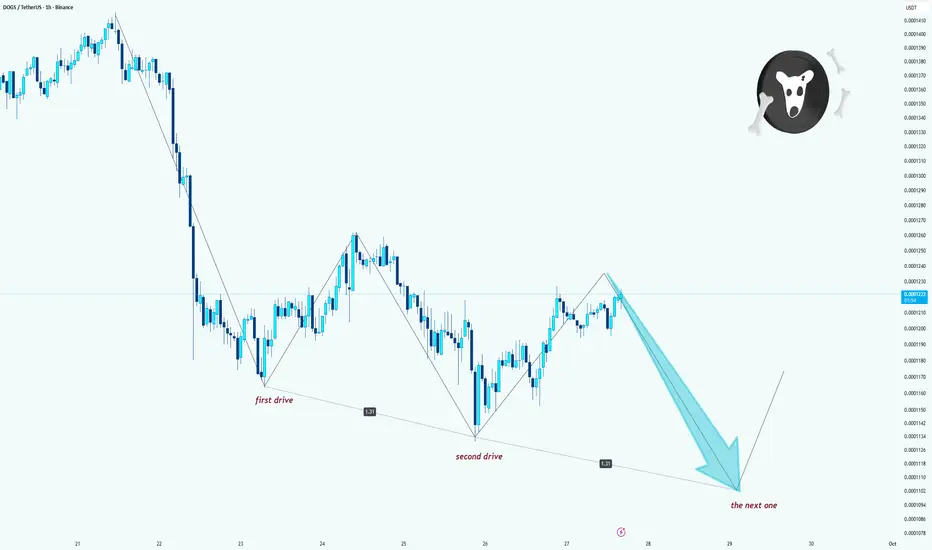
DOGS/USDT – Three Drives PatternHello guys!
The chart is shaping into a classic three-drives pattern.
We already saw the first drive and the second drive, complete with similar extensions.
Now, the market seems to be setting up for the third drive lower, which could push the price into the 0.000110 – 0.000115 area.
If this structure works out, that zone may provide a potential reaction or reversal point. For now, momentum remains bearish until the third leg completes.
Plan:
Bearish bias short-term, looking for the next drive to the downside.
September 2025 Market Summary Gold and ForexProjectSyndicate Market Summary September 2025
📊 MTD performance
🟡 GOLD (XAUUSD): 3,759.65 | +286.65 (+8.31%)
💶 EURUSD: 1.1702 | +16 pips (+0.14%)
💷 GBPUSD: 1.3392 | −112 pips (−0.83%)
💴 USDJPY: 149.19 | +211 pips (+1.43%)
📈 SPX: 6,637.97 | +236.46 (+3.69%)
📈 NDX: 24,503.57 | +1,483.10 (+6.44%)
________________________________________
🗞 September overview
• 🇺🇸 The Fed cut 25 bps on September 17 and flagged the possibility of further cuts this year, reinforcing a softer USD bias and boosting gold demand.
• 🇪🇺 The ECB held rates on September 11, though left the door open for easing later.
• 🇬🇧 The Bank of England held rates and slowed quantitative tightening on September 18.
• 🇯🇵 The BoJ maintained a “hawkish hold” on September 19, started unwinding ETF/REIT holdings, and signaled possible rate risks into October — supporting JPY on abrupt USD strength.
• 🟡 Gold made a fresh intramonth high near ~$3,790, before settling slightly lower.
• Stronger U.S. economic data mid-month (jobs, yields) briefly undercut rate cut expectations, leading to a temporary gold dip, but the momentum has largely resumed.
• Tariff announcements and trade-policy uncertainty added safe-haven tailwinds to gold.
________________________________________
🟡 Gold Market Overview – September 2025
✨ Key Highlights & Drivers
• All-time high revisit: Spot gold pushed toward $3,790 mid-month on renewed enthusiasm for Fed easing and weaker USD.
• Volatility around economic surprises: Upside surprises in US data (jobs, GDP) triggered brief USD strength that pressured gold, but the downside was limited.
• Fed narrative remains gold’s ally: The dovish pivot (25 bps cut + future cuts flagged) continues to lend structural support to gold.
• ETF & institutional flows: Inflows into gold ETFs have reaffirmed investor appetite for safe-haven exposure.
• Risk / geopolitical spillovers: Oil price jitters, trade frictions, and general macro uncertainty underpin demand for non-correlated assets.
• Technical posture: After surging, gold has found interim support in the region of ~$3,650–3,700, with resistance clustering near $3,800. A sustained break above the latter could open targets toward $3,900+.
📊 Performance Recap
Gold has posted one of its strongest monthly performances of 2025, currently up ~8.7 % MTD.
Stronger parts of the rally were clustered around rate cut confirmation and safe-haven demand spikes.
🔍 Risks & Watch-Outs
• A surprise resurgence in U.S. economic strength (inflation, jobs) could push rate markets back toward dovish skepticism, pressuring gold.
• A re-strengthening USD (driven by rates or yield spreads) will be headwind for dollar‐priced gold.
• Central bank actions: further buying or selling by official sectors could tilt balance.
• Technical overextension: short-term pullbacks or consolidations are plausible given the sharp run-up.
________________________________________
💱 FX Landscape – September 2025
• EURUSD: The pair remains stuck under ~1.1700, recovering modestly from USD spikes but lacking strong directional conviction.
• GBPUSD: Under pressure through the month, sliding toward 1.3350 as sterling weakens on yield differentials and global risk dynamics.
• USDJPY: Strength in yields and risk dynamics have nudged USDJPY higher, though BoJ vigilance and intervention risk temper runaway moves.
Broader theme: while risk sentiment supports carry / USD strength, central bank policy cycles and macro surprises are injecting volatility and preventing runaway trends.
________________________________________
📝 Summary & Key Takeaways
✅ What Worked in September
• Gold leveraged dovish central bank messaging and USD softness to consistently outperform across risk regimes.
• Positioning toward safe havens paid off in a month marked by macro surprises and geopolitical noise.
• FX markets remained choppy, with no clear trending momentum — caution was rewarded.
⚠️ What to Watch Going Forward
• U.S. data flow — especially inflation, jobs, and PCE — could reshape Fed expectations and thus gold/FX direction.
• USD momentum — a reversal in dollar strength could compress gold gains; sustained USD weakness could accelerate the bull run.
• Intervention / central banks — any surprises from BoJ, PBoC, or central banks stepping into gold or FX markets could upend positioning.
• Technical zones — if gold can break and hold above $3,800, it may open new leg toward $3,900+; failure may invite a pullback toward $3,650–3,700.

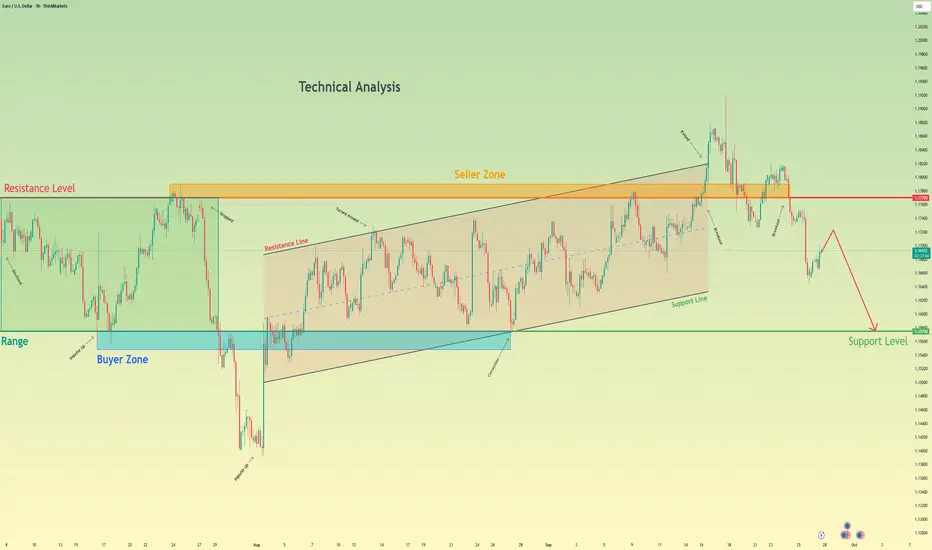
Euro will Fall Towards the 1.1575 Support LevelHello traders, I want share with you my opinion about Euro. The market for the Euro has recently shown a significant sign of weakness, with a failed breakout above the key 1.1770 Resistance Level. After a sustained rally within an upward channel, the price of EURUSD pushed into the 1.1770 - 1.1790 seller zone but failed to find acceptance, quickly reversing back below the broken levels. This 'bull trap' has invalidated the immediate bullish momentum and shifted the short-term market structure to a bearish bias. Currently, after the initial sharp decline from the highs, the asset is in a minor corrective bounce. In my mind, this price action represents a low-momentum pause before the next wave of selling. I expect that this small upward movement will soon be exhausted, and the price will continue its bearish movement downwards. A failure to produce a strong rally from these levels confirms that sellers have regained control. Therefore, I have placed my TP for this trend-continuation scenario at the major 1.1575 support level. This target is a logical objective, as it represents the next significant area of historical support and aligns with the 1.1575 - 1.1548 buyer zone. Please share this idea with your friends and click Boost 🚀
Disclaimer: As part of ThinkMarkets’ Influencer Program, I am sponsored to share and publish their charts in my analysis.
Bitcoin’s Next Big Move: Buy the Dip Before $138K!Hello guys!
Bitcoin is once again at a critical stage, and the chart is giving us a clear roadmap for the next move. Let’s break it down:
Current Setup
Price is holding above $108K–109K and has shown strength around the $103K support zone.
The structure remains bullish as long as BTC trades above $100K.
Strategy
1- Entry zones for buying:
Current market price (~$109K)
Support zone around $103K (a good second chance for buyers).
2- Stop-loss: Around $99K, just below the psychological and structural support of $100K.
3- Target: Upside potential points toward $138K , which aligns with the next major resistance zone.
⚠️ Risk Factor
If BTC breaks below $100K, the bullish phase ends, and we should expect a bearish shift in momentum. In that case, caution and defensive trading will be the smarter play.
📌 Conclusion
For now, the play is simple:
👉 Stay bullish and buy dips while BTC is above $100K.
👉 Watch the $103K zone for re-entries.
👉 Protect your capital with a $99K stop-loss.
👉 Aim high-> the next big target sits around $138K.

BTCUSD Short: Fading the Rally in a Bear ChannelHello, traders! The price auction for BTCUSD has been in a clear bearish phase since its rejection from the SUPPLY ZONE 2 near 115200. This has established a well-defined descending channel that has been guiding the price lower through a series of impulsive declines and corrective rallies, confirming that sellers have the initiative.
Currently, after testing the lower support line of the channel, the price is in the midst of a corrective bounce. This upward move is carrying the auction towards the upper boundary of the channel, which represents a major area of dynamic resistance.
My scenario for the development of events is that this corrective rally will fail upon testing the channel's resistance line, which aligns with the SUPPLY ZONE around the 111000 level. I expect this area to hold as strong resistance, causing a rejection and a continuation of the primary downtrend. The take-profit is therefore set at 107000, targeting a new lower low within the channel. Manage your risk!

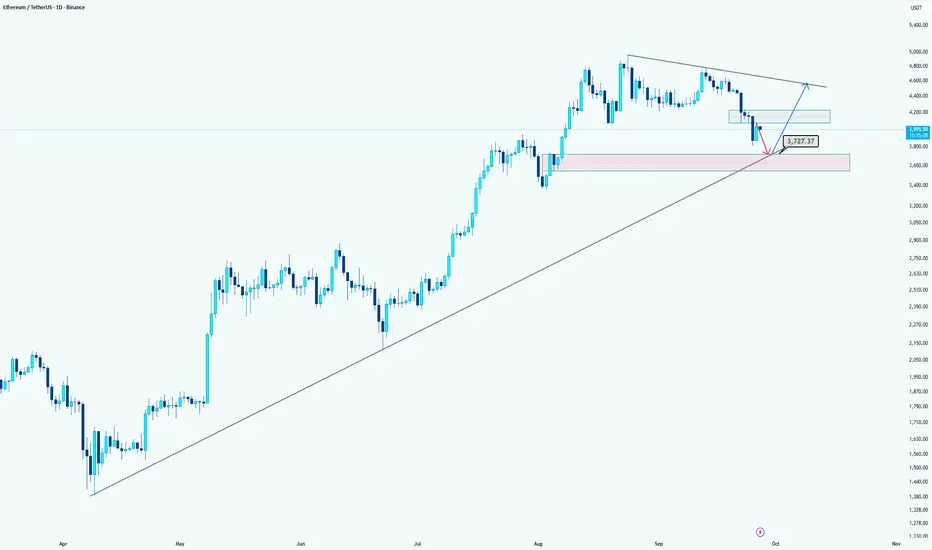
Ethereum: Levels to WatchHi guys!
Ethereum is currently showing weakness after failing to break higher. The price is likely to retest the MPL zone around $3727, which also aligns with the long-term ascending trendline, making it a strong confluence support.
The pink area highlights a potential demand zone where buyers may step in. If the market confirms bullish signals in this area, a long position toward the descending trendline resistance could be considered. However, extra confirmations are recommended before entering long.
Summary:
Short-term target for shorts: $3727 (MPL plus trendline support).
Watch the pink zone for potential long entries, but wait for confirmation.
Let's see what will happen!
The Power of Confluence – Turning Chaos into Clarity!Most traders lose because they jump on the first signal they see. A trendline break, an RSI crossover, a candlestick pattern… But in isolation, these signals are weak and often misleading.
The market rewards patience and confluence; when multiple factors align at the same level, turning noise into clarity.
📈 Why Confluence Matters
Think of trading signals like witnesses in court. One alone may be unreliable. But when several confirm the same story, the probability of truth skyrockets. The same applies to trading setups.
🔑 Types of Confluence
- Structure + Trendline: A horizontal support aligning with a rising trendline.
- Fib + Zone: A 61.8% retracement overlapping with a demand area.
- Pattern + Level: A double bottom forming right on a key support.
- Multi-Timeframe: Weekly support intersecting with a daily trendline.
- The more elements lining up, the stronger the zone becomes.
📊 Example
Imagine Bitcoin approaching $107,500. On the weekly, it’s a major structure. On the daily, a falling wedge support. On the 4H, RSI is oversold. Alone, each signal is average. Together, they form a high-probability buy zone.
⏳ The Takeaway
Confluence isn’t about predicting the market; it’s about stacking probabilities in your favor. Instead of chasing every move, wait for the market to whisper the same message from different angles. That’s where consistency is built.
What’s your favorite type of confluence setup? 🤔
⚠️ Disclaimer: This is not financial advice. Always do your own research and manage risk properly.
📚 Stick to your trading plan regarding entries, risk, and management.
Good luck! 🍀
All Strategies Are Good; If Managed Properly!
~Richard Nasr

BTCUSDTHello Traders! 👋
What are your thoughts on BITCOIN?
Bitcoin is still moving inside an upward channel.
After its strong rally, the price has entered a corrective phase and is now positioned around the midline of the channel.
We expect the correction to extend toward the support zone and the lower boundary of the channel after some short-term fluctuations.
From that area, a potential rebound could trigger the next bullish wave.
If support holds, Bitcoin is likely to resume its upward movement toward the upper boundary of the channel.
As long as the price stays above the key support area, the medium-term outlook remains bullish.
What do you think? Will Bitcoin bounce from the channel bottom and head for the top again?
Don’t forget to like and share your thoughts in the comments! ❤️

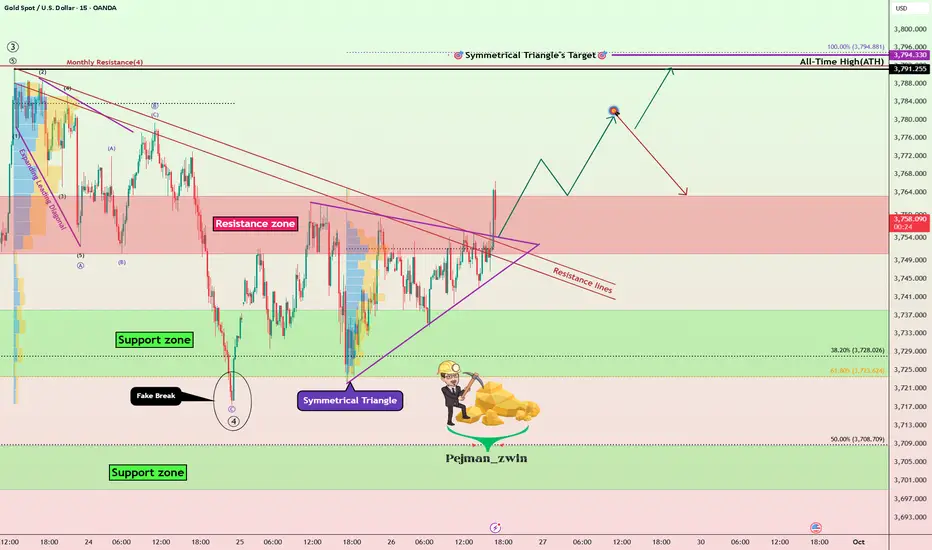
Gold Roadmap: Breakout Confirmed –New ATH or Another Correction?Gold ( OANDA:XAUUSD ) as I expected in the previous idea (Short and Long positions hit the target).
First of all, I should say that this analysis is for the short term and on a 15-minute time frame.
Gold seems to have managed to break the Resistance lines, Resistance zone($3,763-$3,750), and the upper line of the symmetrical triangle in the past few minutes.
I expect Gold to rise to at least $3,779, and then there are two scenarios for Gold: creating a new All-Time High, OR re-correcting.
Stop Loss(SL): $3,741.7
Please respect each other's ideas and express them politely if you agree or disagree.
Gold Analyze (XAUUSD), 15-minute time frame.
Be sure to follow the updated ideas.
Do not forget to put a Stop loss for your positions (For every position you want to open).
Please follow your strategy; this is just my idea, and I will gladly see your ideas in this post.
Please do not forget the ✅ ' like ' ✅ button 🙏😊 & Share it with your friends; thanks, and Trade safe.
Wolfspeed Inc Stock completed wave 2 in Flat formation pattern at 1.29$.
3rd Motive powerful wave in progress Now, and it's Target price 14$ - 15$
5th wave Target price = 17$ - 18$ .
Highly & Strongly recommended for BUY 💥 Now.
Buy as much as you can before ignition starting UP soon 🔊🔊🔊🔊🔊🔊🔊🔊🔊🔊

Arbitrum (ARB): Looking For Buy Entry | 2 Zones To Keep an EyeArbitrum caught our attention with potential buy zones that we might be seeing pretty soon. We are looking for slight downward movement from here toward the major CME gap, which would be an ideal area for a buy entry, once we form the proper MSB there, so that's what we are looking for.
Swallow Academy

Bitcoin - It is either $50.000 or $1.000.000!🪅Bitcoin ( CRYPTO:BTCUSD ) remains undecided:
🔎Analysis summary:
For the past couple of months, Bitcoin has been consolidating. With the two recent all time highs, we could see a similar pattern to what we saw back in 2021, followed by a bear market. But so far, Bitcoin remains bullish with the underlying trend continuation.
📝Levels to watch:
$1.000.000, $50.000
SwingTraderPhil
SwingTrading.Simplified. | Investing.Simplified. | #LONGTERMVISION

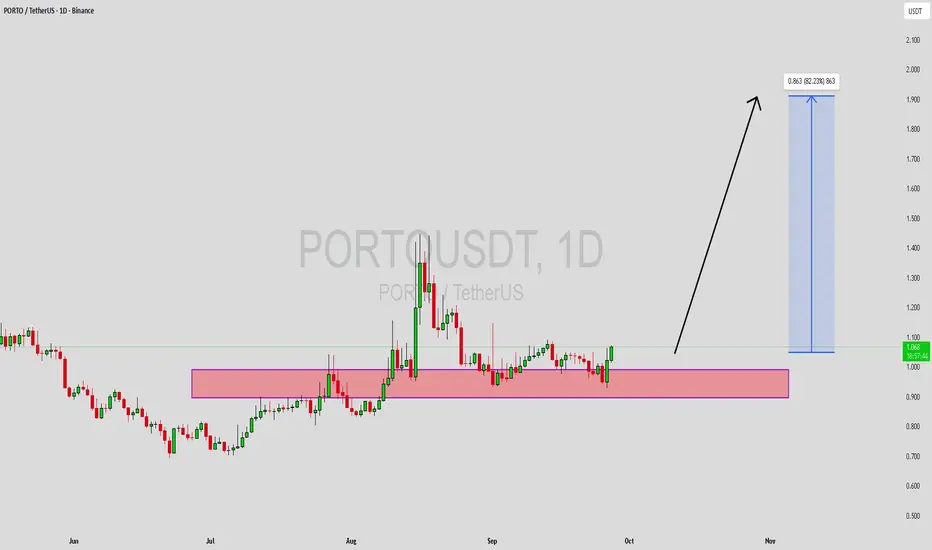
PORTOUSDT Forming Bullish MomentumPORTOUSDT is currently trading with strong support levels, showing signs of accumulation and potential breakout momentum. The chart structure suggests that the pair is building strength within a demand zone, and with good trading volume backing it up, the probability of an upward move is high. Based on the technical outlook, investors could expect a 70% to 80%+ gain if the bullish momentum continues.
The highlighted zone on the chart reflects an important support base where buyers are actively stepping in. This area has historically acted as a strong foundation for bullish reversals, and with the recent price action maintaining above this level, confidence among investors appears to be growing. Once PORTOUSDT pushes beyond its immediate resistance, a sharp upward rally could follow.
Market sentiment around PORTOUSDT is also becoming more positive as investors show increasing interest in this project. The combination of strong technical structure, rising demand, and a favorable pattern sets the stage for a potential breakout move in the short to medium term.
✅ Show your support by hitting the like button and
✅ Leaving a comment below! (What is You opinion about this Coin)
Your feedback and engagement keep me inspired to share more insightful market analysis with you!
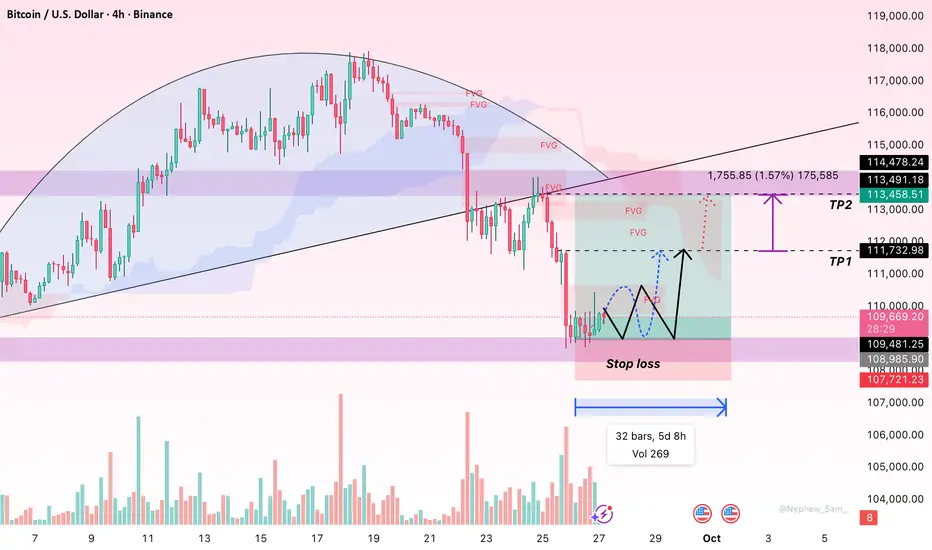
Bitcoin to Surge? Price Forecast and Key News You Can't Miss!Hello everyone, let's go through some important information regarding Bitcoin recently.
Technical Analysis:
The 109,000 USD support level is a key point as FVG zones have appeared, and there has been a clear recovery response. If Bitcoin holds above this level, there is potential for it to continue rising, with nearby resistance levels at 110,000 USD and 112,000 USD. If these levels are broken, Bitcoin may expand its rally towards 115,000 USD. The candlestick chart currently shows positive reversal signals, and technical indicators are supporting the uptrend.
News Impact:
Several factors are influencing the market:
PCE Data and US Inflation: The August PCE showed a slight increase to 2.7%, higher than 2.6% in July. This indicates that inflation pressure isn't easing quickly, which could lead the Fed to maintain high interest rates. This may put short-term pressure on Bitcoin, but if subsequent data shows inflation isn’t accelerating, Bitcoin could maintain its bullish momentum.
US Government Shutdown Risk: The market is closely watching the potential for a government shutdown on 1st October 2025. If this happens, investors might reduce their holdings in risky assets like Bitcoin. Conversely, if the situation is resolved, it could create a positive market sentiment.
Large Liquidations in Derivatives: On 22nd September 2025, the crypto market saw more than 1.5 billion USD in long positions liquidated, creating significant volatility and driving Bitcoin down temporarily. However, as the liquidation wave subsides, it could present an opportunity for fresh capital to enter at support levels.
Bitcoin ETFs and Coinbase Forecast: Bitcoin ETFs, such as BlackRock’s iShares Bitcoin Trust and Fidelity’s Fund, continue to attract institutional investment. Additionally, Coinbase CEO Brian Armstrong forecasts Bitcoin could reach 1 million USD by 2030, driven by clearer regulatory frameworks and increasing demand from financial institutions. This presents a long-term support factor for Bitcoin.
US Strategic Bitcoin Reserve Fund: President Trump’s executive order to establish a national Bitcoin reserve fund has sparked new expectations. If implemented, this could provide a major catalyst for Bitcoin’s price as it becomes part of the strategic national reserves.
In conclusion, Bitcoin is showing signs of recovery if it maintains support at 109,000 USD. Factors such as inflation data, Fed policies, the risk of a government shutdown, ETF inflows, and the US Bitcoin reserve fund will all play a crucial role in shaping its upcoming trend.
Do you think Bitcoin could reach 112,000 USD in this recovery phase? Feel free to share your thoughts.
XAUUSD: Bullish Momentum Fueled by Latest PCE Data👋Hello traders! What do you think about the current trend of OANDA:XAUUSD ?
Gold continued its rise on Friday, surpassing the recent target of $3,750 , as the U.S. Dollar (USD) weakened following the latest Personal Consumption Expenditures (PCE) inflation report, which showed no surprises in inflation (holding steady at 0.2%).
Currently, XAUUSD is showing strong bullish momentum, breaking above the previous trendline and moving within an expanding wedge pattern. The price is holding above the trendline support and is heading toward higher levels, with potential targets around $3,785-$3,800. The momentum is clearly in favor of buyers, especially after the recent pullback, setting up for a potential breakout.
With inflation concerns still present and the PCE data supporting continued economic resilience, gold demand is rising. The market is likely to continue rising in the short term as investors flock to safe-haven assets like gold.
💬What do you think about the current trend of XAUUSD? Do you agree with this bullish outlook? Let me know your thoughts in the comments!

Gold can Resume its Uptrend After This CorrectionHello traders, I want share with you my opinion about Gold. The market context for Gold has been firmly bullish since the price action reversed from the deep 3335 - 3355 buyer zone, a move which established the current, well-defined upward channel. This bullish structure has since been guiding the price of XAU higher through a series of impulsive moves and corrective pullbacks, confirming that buyers are in control of the dominant trend. Currently, after testing the upper boundary of the channel, the asset is undergoing a healthy correction. This pullback is now guiding the price towards a critical confluence of support, where the ascending support line of the channel meets the horizontal support zone around the 3675 current support level. In my mind, this pullback is a classic trend-continuation opportunity. I expect that the price will find strong support in this area and bounce from the channel's support line. I think this rebound will signal the end of the correction and the resumption of the primary upward trend. Therefore, I have placed my TP at 3820, a target representing a new structural high and a logical objective for the next impulsive wave. Please share this idea with your friends and click Boost 🚀
Disclaimer: As part of ThinkMarkets’ Influencer Program, I am sponsored to share and publish their charts in my analysis.

GBPUSD - Unexpected Reversal👋Hello everyone, what do you think about FX:GBPUSD ?
The GBP/USD pair ended Thursday's trading session with a decline of over 0.78%, seemingly preparing to test even lower levels due to the lack of economic data in the UK, which will likely draw traders into the momentum of the U.S. Dollar.
Looking at the technical picture: the pair is trading below the EMA 34 and 89 lines after these two lines reversed. The short-term bearish outlook remains strong as long as resistance holds, with a full break at the 1.133 support level being a potential trigger for further selling.
What are your thoughts on this pair? Please leave your comments below!
Wishing you a great trading day!

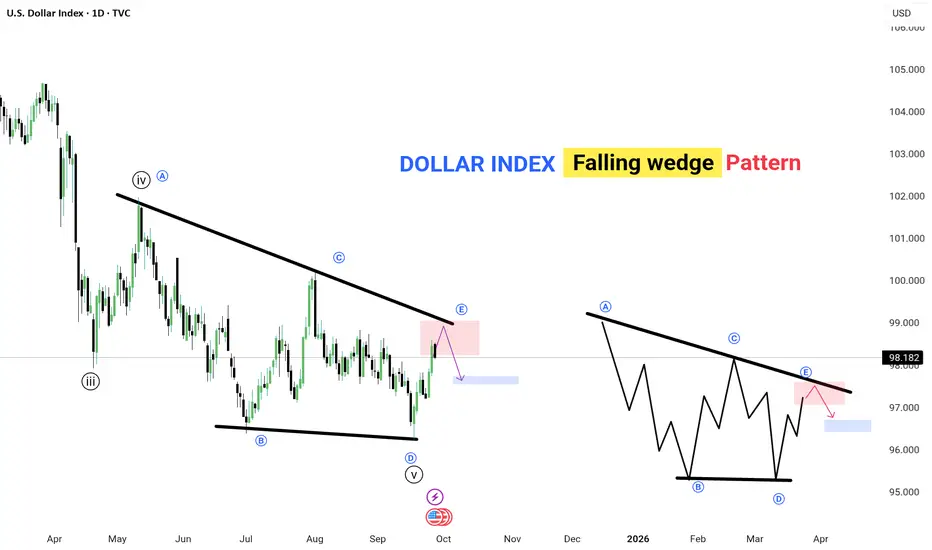
DOLLAR INDEX – Falling Wedge Pattern📉 The Dollar Index is forming a falling wedge, a classic reversal pattern.
🔹 Price is approaching the upper trendline resistance (point E).
🔹 Expect a potential pullback toward the support zone (highlighted in blue).
🔹 Pattern repeats: After E, a corrective dip is likely before the next move.
✅ Key Points:
Falling wedge usually signals trend reversal or continuation.
Watch for breakout confirmation above resistance for bullish continuation.
Current focus: resistance zone near 98–98.2, then potential drop to 96–97 support.
💡 Lesson: Patience pays — wait for clear rejection or breakout before trading this setup.
---
AUDNZD at Historical Levels - Layer ShortsAUDNZD at Historical Levels - Layer Shorts
Every once in a while, markets reach extreme levels that can be taken advantage of. This is one of those times.
📊 Technical Analysis:
AUD/NZD D1 RSI is currently trading at its highest daily levels ever. We have only seen this once before, in August 2020. What followed then was a 630-pip downside move over the next 4 months.
Could this happen again, and should you short it? Let’s discuss:
🌍 Fundamental Perspective:
The move higher in AUD/NZD has been largely driven by NZD weakness. This stems from deteriorating economic data for the New Zealand economy. Currently, forward markets are pricing in a 0.5% rate cut at the October 8, 2025 RBNZ meeting. This is VERY dovish, and naturally, banks have been selling NZD heavily (as also reflected in EUR/NZD and NZD/CHF).
However, pricing in a double rate cut at the upcoming RBNZ meeting may already be as dovish as it gets. Yes, another cut later this year is possible, but often currencies show their largest moves around key events like rate decisions. The RBA (Australia’s central bank) is also due to announce policy this coming week. So we have two fundamental catalysts in play.
💡 Potential Trade
How can you take advantage of this setup? I would not short it outright. Instead, I would begin layering in small short positions (maximum of 0.2% per 1 ADR). If the market moves 1 ADR against you, you can add another very small position. This way, your average short entry remains close to current levels. Eventually, we are likely to see a mean-reversion move. This may take time, but history shows that at these RSI levels (and even lower), we have often seen significant pullbacks to the downside.
Keep this pair on your radar—it may pay off nicely with patience.
Best,
Meikel

Gold Prepares for a New Breakout👋Hello everyone, what do you think about the trend of OANDA:XAUUSD ?
XAUUSD has been consolidating in a narrow range, forming a bullish flag pattern with clear support at 3,730. Additionally, the Bollinger Bands are showing that the market is preparing for a potential breakout.
If the price continues to hold above the support line, the bullish trend may continue, with the immediate target at the resistance level around 3,785. The Core PCE Price Index m/m, set to be released today, will serve as a short-term catalyst for this trend.
Keep an eye on these key levels to confirm the breakout!
And you, what do you think about gold's price today💬? Feel free to share your thoughts in the comments below!
Good luck!
