Bitcoin Macro Risk Given the macroeconomic and geopolitical backdrop, BTC is more likely to react negatively to Trump's speech today, as:
- An armada led by the aircraft carrier USS Abraham Lincoln has approached Iran.
- The USS Abraham Lincoln costs over $2.5 million per day to maintain.
- The USS Abraham Lincoln, the largest aircraft carrier in the world, costs the US approximately $1 billion to maintain.
- Trump's man is more likely to be the Fed's choice, meaning there's room for maneuver while Jerome Powell, who has a poor relationship with Trump, is in office, as Powell doesn't want to lower rates. Without rate cuts, the market is simply suffocating. It's also worth considering that Trump is a money-smart guy, and such spending is likely to trigger certain events.
- We have over $100 million in liquidity accumulated in BTC, which needs to be collected.
- Many are now expecting growth, so downward manipulation is more likely. Today's speech is more likely to disrupt all patterns and structures with its manipulative downward movement.
Full breakdown with levels and graphs on the website
Community ideas

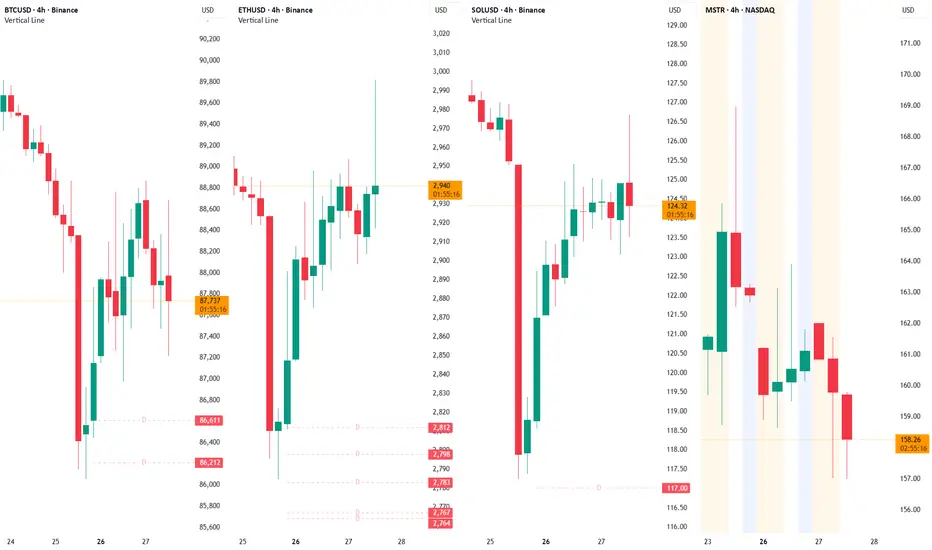
BTCUSD H1 — Support Held, Structure Is RebuildingBitcoin has cleanly defended the 87,200–87,500 support zone after a sharp sell-off, printing a sequence of higher lows that signals short-term structural repair. Price is now grinding higher along a rising trendline, but remains below the declining EMA 98, meaning this move is still corrective until proven otherwise. The key near-term test sits at 88,800–89,000 — a local lower-high resistance and dynamic EMA confluence. A confirmed reclaim and hold above this level would open the path toward 89,700 → 91,000, aligning with prior liquidity and range highs. However, failure to hold the rising trendline or a breakdown back below 87,200 would invalidate the bullish recovery and expose downside toward the 86,000 liquidity pocket.
⚠️ This is not a breakout yet. BTC is deciding whether this bounce becomes continuation or just a relief rally.

BTC ETH SOL MSTR It Seems That We're Getting The Pump After AllHello everyone, please give this idea a boost and follow me here on TW for my regular critical updates on Bitcoin, Ethereum, Solana, MicroStrategy, Gold & Silver based off Martin Armstrong's Socrates.
It looks like we are getting the crypto PUMP after all... which correlates with Gold/Silver where the TARGET was yesterday the 26th with a pullback into end of this week. Then the markets should flip opposite.
But... markets are certainly acting a little confused though.
Good luck! and stay safe 🙏🏻
BTCUSD 1/28/26 3hr & 90min Timeframe NarrativePERSPECTIVE!!!! It's all about Perspective! With a lil more SAUCE!
_SnipeGoat_
_TheeCandleReadingGURU_
#PriceAction #MarketStructure #TechnicalAnalysis #Bearish #Bullish #Bitcoin #Crypto #BTCUSD #Forex #NakedChartReader #ZEROindicators #PreciseLevels #ProperTiming #PerfectDirection #ScalpingTrader #IntradayTrader #DayTrader #SwingTrader #PositionalTrader #HighLevelTrader #MambaMentality #GodMode #UltraInstinct #LawOfCirculation #TheeBibleStrategy

New Range created 1.The price breack the High of Daily Timeframe.
2.We have new Range(High and low).
3.We Will sell in Premium level(50% above)until the price reach the Discount level(50% bellow).
4.We will Buy after confirmation in he Golden zone.

EUR/USD Strong bullish buying from support📈EURUSD – Ascending Channel Buy Setup 🟢🔥
EURUSD is trading within a well-defined ascending channel on the 1-hour timeframe, indicating a healthy bullish trend. Price is reacting from the lower channel support, presenting a solid buy opportunity aligned with trend continuation.
🔹 Buy Entry (Channel Support): 1.18300
⏱ Timeframe: 1H
🎯 Technical Target:
• Target: 1.19000
📊 Bullish structure remains valid as long as price respects channel support.
⚠️ Use proper risk management & trading discipline.
📌 Trade with structure, protect your capital.
👍 Like | Follow | Comment | Share
#EURUSD #ForexTrading #BuyTrade #AscendingChannel #BullishTrend #TechnicalAnalysis #1H #RiskManagement 💹

Gold at Decision Zone – GAP Reaction Will Define the Next MoveMarket Context (Fundamentals → Flow)
Recent sessions continue to be driven by elevated geopolitical and macro uncertainty.
Risk sentiment remains fragile as markets reassess global political tensions and their implications for trade, energy routes, and monetary stability.
As a result:
USD remains under pressure, lacking strong follow-through buying
Equities show signs of fatigue near highs
Gold continues to attract defensive flows, keeping the broader bullish structure intact
This environment supports trend continuation, but not without technical pullbacks.
Technical Structure (H1–H4)
Gold is trading within a well-defined ascending channel
Multiple BOS (Break of Structure) confirm the bullish trend
The recent impulsive leg created a bullish GAP / imbalance
Price is now reacting near the mid-channel decision zone, where continuation vs. deeper retrace is decided
➡️ Trend is bullish, but location matters.
Key Levels to Watch
Current resistance: 5,080 – 5,100
GAP / reaction zone: 5,020 – 5,000
Major demand (FVG): 4,960 – 4,940
Invalidation: H1 close below 4,940
Scenarios (If – Then)
Scenario 1 – GAP Holds (Primary Bias)
If price holds above 5,000
Buyers defend the imbalance
→ Continuation toward 5,120 – 5,180 within the channel
Scenario 2 – Deeper Pullback (Healthy Correction)
If price loses 5,000
Expect a retrace into 4,960 – 4,940 FVG
Bullish reaction here keeps the higher-timeframe trend intact
Only a clean break and acceptance below 4,940 would weaken the bullish structure.
Summary
Gold is not topping — it is pausing at a decision zone.
In a risk-sensitive environment, pullbacks are opportunities, not threats.

SENT ON RADAR🔥 Fortune AI Radar — SEED_ALEXDRAYM_SHORTINTEREST2:SENT
Fresh activity detected on SEED_ALEXDRAYM_SHORTINTEREST2:SENT today.
Data suggests increasing market interest & buyers stepping in.
Technicals currently lean bullish, with momentum trending upward.
Whales showing hints of accumulation and hype rising among traders.
This coin is flashing strong signals on short-term charts — worth keeping an eye on 👀
Not financial advice — always research before taking decisions

BTCUSD 1/28/26 3hr & 90min Timeframe NarrativePERSPECTIVE!!!! It's all about Perspective!
_SnipeGoat_
_TheeCandleReadingGURU_
#PriceAction #MarketStructure #TechnicalAnalysis #Bearish #Bullish #Bitcoin #Crypto #BTCUSD #Forex #NakedChartReader #ZEROindicators #PreciseLevels #ProperTiming #PerfectDirection #ScalpingTrader #IntradayTrader #DayTrader #SwingTrader #PositionalTrader #HighLevelTrader #MambaMentality #GodMode #UltraInstinct #LawOfCirculation #TheeBibleStrategy

Be wary of a gold price pullback.
I. Core View
The bullish trend in gold remains strong, with prices repeatedly hitting new all-time highs. The market is supported by multiple favorable factors (safe-haven demand, expectations surrounding Trump's policies, prospects of Federal Reserve easing), but caution is warranted against technical pullback risks due to overheated sentiment at elevated levels. The recommended approach is to focus on buying on pullbacks, avoid chasing rallies, and strictly implement risk management.
II. Technical Analysis
Daily Trend: On Tuesday, gold closed with a slightly long upper shadow and a solid bullish candlestick, decisively breaking through historical highs, indicating that bullish momentum remains dominant.
Key Levels:
Upper Resistance: $5,300–$5,320 (next key target/psychological barrier).
Lower Support:
Primary Support: $5,240–$5,230 (short-term bull-bear dividing line).
Core Support: $5,150 (pivot level) and $5,130 (strong support).
Short-Term Outlook: The trend remains bullish, but a technical pullback is possible after consecutive rallies. If a pullback holds above the $5,130–$5,150 support zone, the upward trend is likely to continue.
III. Fundamental Drivers
Bullish Factors:
Persistent safe-haven demand: Geopolitical and economic uncertainties are driving capital into gold.
Expectations around Trump’s policies: Related policy remarks are causing market volatility and reinforcing gold’s safe-haven appeal.
Federal Reserve policy outlook: Market expectations of accommodative monetary policies are favorable for non-yielding assets like gold.
Risk Warnings:
A potential rebound in the U.S. dollar could exert short-term pressure.
Market sentiment is at elevated levels, and excessive optimism could amplify pullback risks.
IV. Trading Strategy
Bullish Strategy (Primary Approach):
Entry Zones: Look to buy on pullbacks near $5,240–$5,230 upon stabilization; if a deeper retracement to $5,150–$5,130 occurs with strong support, consider分批布局多单 (scaling into long positions).
Stop Loss Placement: Set stops $20–$30 below the entry level (e.g., for a long position at $5,250, set the stop loss at $5,220).
Targets: Initial target at $5,300, with further upside toward $5,320 and beyond upon a breakout.
Risk Warnings:
Avoid chasing long positions near all-time highs and reduce the frequency of long trades.
Be cautious of rapid pullback risks on Wednesday and Thursday due to the Federal Reserve’s interest rate decision and shifts in market sentiment.
Bearish Strategy (Cautious Secondary Approach):
Only consider shorting if prices rally to the $5,300–$5,320 zone and show clear rejection signals (e.g., long upper shadows, bearish engulfing patterns). Execute with light positions and quick exits.
V. Key Events and Risk Control
Federal Reserve Interest Rate Decision (U.S. Session): Rates are expected to remain unchanged. Focus on Chair Powell’s remarks regarding the monetary policy outlook, as any subtle shifts could trigger significant market volatility.
VI. Summary
The medium-to-long-term bullish structure for gold remains intact, but short-term technical indicators are in overbought territory, increasing the risks of chasing rallies. It is advisable to patiently wait for pullbacks to key support zones ($5,240–$5,230 or $5,150–$5,130) before initiating long positions, with strict stop losses in place. Targets are set toward $5,300–$5,320. If prices break above $5,300 directly, consider entering lightly upon a confirmed pullback. Maintain flexibility in trading and guard against reverse volatility triggered by major events.

XAGUSD (Silver) - Selling Scenario based on Liquidity and SMC The price of silver is currently in a key supply zone within a larger bearish structure. In high temporality it is observed that the market has made a mitigation move towards a previous Order Block / Fair Value Gap, where there is pending liquidity to be taken.
In smaller time frames, the price shows loss of buyer momentum and possible distribution signals. My plan is to look for:
• Liquidity sweep above the last relevant high.
• CHoCH (Structure Change) confirmation.
• Pullback to Order Block or FVG in 5m-15m.
• Short entry with clear risk management.
Bias: Lower as long as the price respects the offer area.
Objective: Search for liquidity in the previous ones and continuation of structure.
Invalidation: Solid closure above structural high in HTF.
This setup is based on Smart Money Concepts: Liquidity Sweep + CHoCH + Mitigation, prioritizing patience and confirmation before running.
It's not a financial recommendation. Each trader must manage their own risk.

XAUUSD – Reversal Signal at ATH 5312A Pullback to the Trendline Before the Next Breakout?
Market Context
Gold has printed a new all-time high (ATH) at $5312.63. However, right at this level, the chart formed a reversal candle, warning of strong profit-taking pressure from buyers.
Technical Analysis
Short-Term Bearish Signal:
The reversal candle at ATH is an early bearish clue. For safer execution, it’s better to wait for a clear bearish market structure confirmation—such as a Lower Low forming on a lower timeframe—before looking for a short entry .
Key Support Zones:
Reaction Zone: $5225 – $5240
This is the first potential stop for the pullback, where a minor bounce could occur.
Medium-Term Buying Zone (Sweet Spot): $5160 – $5180
This is the most important area because it confluences with the bullish trendline and the previous BOS (Break of Structure) zone.
Trading Plan
Scenario 1: Look for a quick SELL if price confirms a break of the most recent bullish structure. The take-profit target is the Medium-Term Buying Zone.
Scenario 2 :Wait patiently for price to pull back into the Medium-Term Buying Zone (around $5170 – $5180). If bullish reversal signals appear there (e.g., Pin Bar / Engulfing), consider a long-term BUY aiming for a breakout above the ATH 5312.
Conclusion
The primary trend remains BULLISH. The current decline is best viewed as a healthy correction, shaking out weak positions before gold builds momentum to push toward higher levels.
⚠️ Gold trading carries high risk. Always manage your risk and position size carefully.

BTCUSD is showing a clear downtrend on the 1-hour timeframe📉BTCUSD – Strong Sell Opportunity 🔴🔥
BTCUSD is showing a clear downtrend on the 1-hour timeframe, with price rejecting from the key resistance zone at 88,300. The formation of an ascending triangle near resistance suggests distribution and potential downside continuation.
🔻 Sell Zone: 88,300
📐 Pattern: Ascending Triangle (Bearish Bias)
⏱ Timeframe: 1H
🎯 Technical Targets:
• 1st Target: 87,500
• 2nd Target: 86,300
📊 Momentum favors sellers, and bearish structure remains intact below resistance.
⚠️ Use proper risk management & trading discipline.
📌 Trade smart, not emotional.
👍 Like | Follow | Comment | Share
#BTCUSD #Bitcoin #CryptoTrading #SellTrade #Downtrend #TechnicalAnalysis #1H #RiskManagement 💹

My AI is giving us the extreme version... 📊 Revised 1–5 Year Price Scenarios for Silver (USD/oz)
Scenario Inflation Assumption 2026 2027 2028 2029 2030
Official CPI only 2–3 % inflation 115 118 122 126 130
Realistic Inflation 4–7 % annual inflation 120 128 138 148 160
Technological + Scarcity Realization above + metal revaluation
1,000 1,200 1,450 1,700 2,000
Extreme Macro + Scarcity + Global Demand real crisis, debt, currency debasement
3,000 4,000 5,000 6,000 7,500
The AI Bias is very strong with this, it took some hour to go through a lot of information...
Technological + Scarcity Realization means looking into reality instead of assumptions...
Above means, the evaluation of how much silver there really is available today, which took some time, trust me...
Metal revaluation means to check in the Gold/Silver ratio, history, psychology and a lot more.
Especially considering history -> is very relevant, since all data seems to pretend the last 100 years are what matters only. "Financial Glasses"... Looking into the history of humanity changes things, even for AI...
Happy greetings and good luck :)

BTCUSD: Daily Bullish Structure Holding — Path Toward ATHOn the daily timeframe, we have a clear confirmation of an algorithmic trendline with four clean touches, validating the structure. Price is bouncing from this level for the fourth time and continues to move within a bullish channel, showing clear intent toward higher levels.
The large green parallel channel above represents a zone that acted as a major resistance during key phases of Bitcoin’s history, and is now behaving as support (more detailed explanation in the next post).
The yellow zone above is the main Fair Value Gap. A breakout through this area opens the path toward a potential All-Time High.
Additional confluence comes from the 200 Moving Average, which is currently located within the same zone. A clean break and acceptance above the 200 MA significantly increases the probability of a bullish continuation scenario.
As long as the structure remains intact, the bias remains bullish.

Hyperliquid pumping... risk management is the priorityHYPE is bouncing after a prolonged downtrend, but this move is still a relief rally, not a confirmed trend reversal.
Price has pushed off lower range support and reclaimed short-term momentum, moving back into a high-volume resistance zone. That’s constructive, but structure remains bearish with lower highs.
For bulls, this area is critical.
Strength needs acceptance and consolidation above prior breakdown levels to shift structure. Without that, this move risks stalling as a counter-trend bounce.
Until structure confirms:
• Rally = reaction, not trend
• Overhead supply still active
• Patience > prediction

The Geometry of Survival: Fixed vs. Step Scale Spacing
Summary: Most traders fail because they use static grids. When the market enters a high-volatility "crush" phase, a fixed 1% or 2% gap between orders gets filled too quickly, leaving the trader with a massive position and no capital at the actual bottom.
The Strategy: This idea explores the Step Scale (Price Deviation Step Scale) feature in OrangePulse LITE. By using a multiplier (e.g., 1.1x or 1.2x), each subsequent Safety Order is placed further away than the previous one.
(For this example extreme value of 1.8x was used since we are using only 3 Safety Orders).
Why this matters:
1. Capital Preservation: You save your largest orders for the extreme ends of the move.
2. Wider Coverage: You can cover a 30% drop with the same number of orders that would only cover 15% in a fixed grid.
3. Mathematical Edge: It prevents "running out of fuel" during black swan events.
Study the attached chart to see how a geometric ladder significantly improves the survivability of a Mean Reversion bot compared to a standard linear grid.

Bitcoin 4H Structure: Descending Channel Breakout Toward 90kTechnical Setup: Bitcoin has successfully broken out of a bearish descending channel (the blue and red diagonal corridor) on the 4-hour timeframe.
• Key Indicators: The SMC Community is flashing a "Safe Swing" signal, indicating high-confidence bullish momentum.
• Support/Resistance: A "Strong Low" has formed at 86,150, while the price is currently battling minor resistance at 87,812.
• Trade Objective: The long position setup (green box) targets the 90,063 to 91,000 liquidity zone, represented by the green upward arrow.
2. ETHUSD: Bearish Rejection & Pullback Target
Title: Ethereum 4H Analysis: Rejection at Resistance & Liquidity Hunt at 2,786
Description
• Market Structure: Unlike Bitcoin, Ethereum is showing a potential short-term reversal or pullback. The price recently rallied into a supply zone but is now displaying a bearish outlook according to the orange projection arrow.
• Supply & Demand: There is a clear Fair Value Gap (FVG) and Order Block (OB) sitting much lower, between 2,785 and 2,786. This is marked as a "Strong" area where buyers might step back in.
• Price Action: After a series of Break of Structure (BOS) events to the upside, the price has hit a "Strong High" near 3,042 and is currently rejecting.
• Trade Objective: The setup anticipates a drop from the current 2,951 level down toward the blue demand zone around 2,786 to collect liquidity before any further upward move.

doge trade plananother perfect textbook range reclaim on doge this can do numbers looking closely at this RR looks very juicy

PTB BOTTOMED OUT🔥 Fortune AI Radar — HOSE:PTB
Fresh activity detected on HOSE:PTB today.
Data suggests increasing market interest & buyers stepping in.
Technicals currently lean bullish, with momentum trending upward.
Whales showing hints of accumulation and hype rising among traders.
This coin is flashing strong signals on short-term charts — worth keeping an eye on 👀
Not financial advice — always research before taking decisions

BTC ETH SOL MSRT ¡WARNING! This Could The Be The High For NowHello everyone, please give this idea a boost and follow me here on TW for my regular critical updates on Bitcoin, Ethereum, Solana, MicroStrategy, Gold & Silver based off Martin Armstrong's Socrates.
It's possible that yesterday was the closing HIGH and today the intraday high with a pullback into Thursday/Friday unless it closes above BTC@$91255 ETH@3157 SOL@132 MSTR@162 but Socrates is warning that there is no much momentum left for this pump.
Good luck! and stay safe 🙏🏻
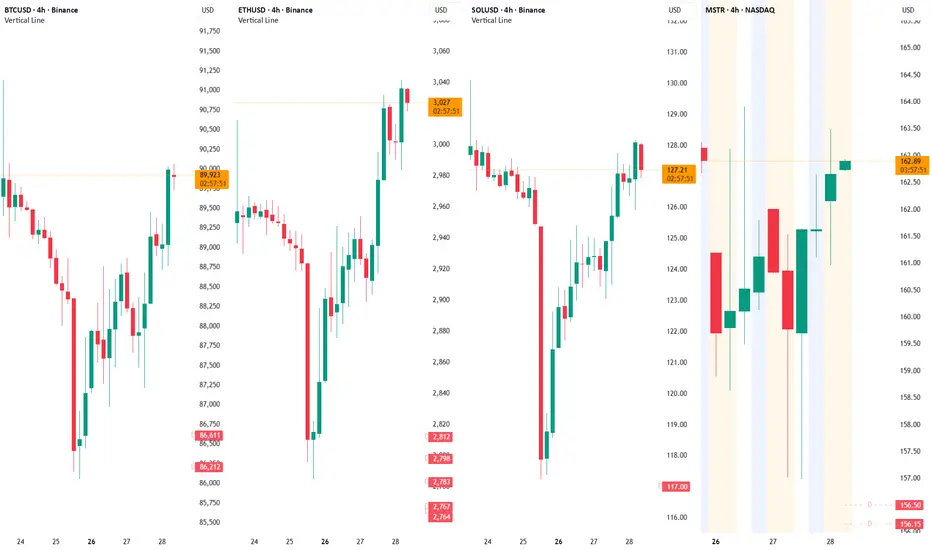

What Looks Like Weakness Is Actually Trend RepairHello traders,
Bitcoin is currently trading near eighty-eight thousand nine hundred, following a sharp downside sweep that briefly broke below the prior support zone before being aggressively reclaimed. That breakdown did not transition into acceptance. Instead, price was quickly absorbed and pushed back above support, signaling a failed breakdown and liquidity grab, not the start of sustained bearish control.
The recovery that followed was decisive. Price rotated back into a well-defined ascending channel, reclaiming both structure and directional bias. This behavior is important: strong trends often shake out late sellers before resuming higher. The impulsive rebound from the lows suggests demand stepped in with intent, repairing the structure rather than merely bouncing.
Since reclaiming the channel, price has shifted into a controlled consolidation phase near the mid-channel region. This pause should not be mistaken for rejection. Overlapping candles and reduced volatility indicate acceptance and rebalancing, allowing momentum to reset after the sharp recovery. As long as price continues to hold above the reclaimed support and channel base, the broader bullish structure remains valid.
Looking ahead, the upper boundary of the ascending channel near $91,000 stands out as the next key technical reference. This zone represents a likely reaction area, not a guaranteed target, where price may pause again if reached.
Invalidation remains clear. A sustained loss of the reclaimed support zone and a breakdown back below the channel would challenge the current bullish bias and reopen the door for deeper corrective price action.
For now, the message is straightforward:
The breakdown failed. Structure was reclaimed. Trend repair is in progress let behavior confirm continuation.
