Gold’s Parabolic Move: The Deadly Mean ReversionYesterday and today we witnessed a mean reversion happening on Gold and silver where price dumped hundred of pips in minutes. There were massive red displacement candles where price begun snapping violently back down. It was not cause by unemployment news claims or FOMC news on Thursday, price managed to fill three gas in a matter of 30 minutes and it has continued today 30th Jan 2026. Before the mean reversion happened yesterday, there was a double bottom pattern where most people would be waiting for a breakout NYSE session to enter buys, but when I checked the lower TF, the 5 min to be specific, there were very many red candles that were clustered around one area which made me hesitant to enter buys. When price broke out of the 5 minute range, it started selling. I thought it would sell to the days Asian low, but when price got there it started melting.
So why has the mean reversion happened after Gold's parabolic moves? To be honest, I don’t think yesterday’s and today’s mean reversion was a technical one where price was simply overbought and was due for a pullback. It was a flow-based parabolic move, the one of the type where the system itself gets stretched too thin and needs to snap back.
I drew the chart after the meltdown best I could with my excellent drawing skills 😂 to show how Gold has been parabolic for the last few weeks, accelerating higher with increasingly steep candles and shallow pullbacks before the drop.
Some traders have been thinking that this big reversal is about the news on Democrats threatening a government shutdown over immigration enforcement funding in the U.S. over the protests and the killing of Alex Pretti by federal immigration agents in Minneapolis. That incident immediately has drawn political criticism across both parties and led to potential showdown threats over whether Senate Democrats would support funding for the Department of Homeland Security (DHS) unless major reforms to Immigration and Customs Enforcement (ICE) are included. Many Dems have publicly vowed not to approve the DHS portion of the budget until changes like body cameras for agents and new warrant requirements have been enacted, raising the odds of a partial government shutdown.
Days after the shooting and the protests, Democrats even blocked a key spending package in the Senate to force negotiations and bring pressure for those reforms, pushing the shutdown deadline closer. However, by the time the market started its violent downward move, much of this risk had already been reflected in asset prices, traders were forward-looking and positioning for potential political gridlock well before the headlines hit. Expectations for a shutdown were already elevated by midweek based on previous reporting and the markets had priced in uncertainty around ICE funding and DHS negotiations long before the weekend claims data. The question would be, are government shutdowns usually priced in???
So when the price started ripping lower, it wasn’t reacting to the wording of a press release or the latest TV headline, it was reacting to flow dynamics, liquidity demands, and positioning adjustments across multiple markets. In other words, today's “mean reversion” that has happened was driven by how money managers and leveraged players were forced to adjust exposure and lock in profits after an extended parabolic run, not by a classic technical overbought signal.
This helps explain why gold sold off even though a shutdown threat is typically considered a risk-off. If uncertainty and volatility spike while leverage is high, the mechanics of market participants needing cash and risk reduction can outweigh simple narrative expectations about safe havens. In that sense, the reversal is less about political causality and more about market structure and flow reaction in a high-leverage, low-liquidity environment.
The biggest lesson from yesterday and today is that mean reversion does not always look technical, and it definitely does not respect indicators when markets are unwinding leverage. Gold and silver did not dump because they were overbought on RSI, they dumped because the parabolic structure broke, flows flipped, and price was forced to snap back toward equilibrium.
Parabolic

$UFD: 100x Extremum Breakout SetupCHART ANALYSIS
Two fake-outs cleared. Year-long base complete. Bottom confirmed. Breakout imminent.
📊 KEY LEVELS:
Current: $0.014516
Resistance: $0.041121 (+183%)
Extremum Target: 100x zone
📈 PATTERN:
12-month accumulation base ✓
May + July fake-outs shook weak hands ✓
February 2025 bottom confirmed with BUY signal ✓
Clean resistance at 0.041121 ready to test
Historic breakout window: March-May 2025
THE FUNDAMENTAL EDGE
365 consecutive days of building. Zero days missed.
While 95% of crypto projects die within 6 months, UFD's developer has shown up EVERY. SINGLE. DAY. for an entire year to build and engage the community.
This isn't normal. This is top 1% commitment that creates:
Unshakeable community loyalty
Zero rug risk
Compounding product development
Cult-like holder conviction
WHY THIS COULD PARABOLIC
Technical + Fundamental Convergence:
When you get a developer building daily for 365 days AND a textbook accumulation pattern completing, you're not looking at a trade. You're looking at a generational setup.
🎯 The Math:
Entry: $0.014516 (NOW)
Target 1: $0.041121 = 183% gain
Target 2: 100x zone = 6,900% gain
Risk/Reward: 1:100+
🔥 The Narrative:
Once CT discovers "the dev that never missed a day for a year" + "the chart that bottomed perfectly," FOMO goes nuclear.
TIMELINE
Now - March 2026: Final accumulation, resistance test
March - May 2026: Breakout window opens
May - July 2026: Extremum 100x zone activation
THE SETUP
✓ 12-month base complete
✓ Weak hands eliminated via 2 fake-outs
✓ Bottom confirmed with technical signal
✓ 365 days proven developer commitment
✓ Battle-tested community
✓ Asymmetric risk/reward (1:100+)
⏳ Breakout pending
This is what accumulation looks like before the parabolic move.
The question isn't IF—it's are you positioned WHEN.
DYOR. Not financial advice. Chart patterns + fundamentals suggest rare alignment. Position accordingly.

CMCT Squeeze Indicator AnalysisUsed the EMA 9, EMA 21, Squeeze Indicator, and ATR indicator to map out squeeze zones and price movement in the last month plus. The bulls over at CMCT have brass balls and diamond hands and have locked the float. Despite massive manipulation this thing is about to go to the moon. Last week they washed 60% SI down to 4% on Monday with no covering and just last Thursday accrued another 56% Live Short Interest just to suppress the momentum. The pressure cooker is boiling and the shorts keep trying to put the fire out with gasoline by continuing to short with 400% CTB. I am no chart guru, this is my first time posting a chart and my first time using any of these indicators. Regardless, Ive been hodling and accumulating for 2 weeks and can sense the shift. Now would be a great time to get in and HODL for 20+ Lets finish 2025 with a bang! BULLS UNITE!
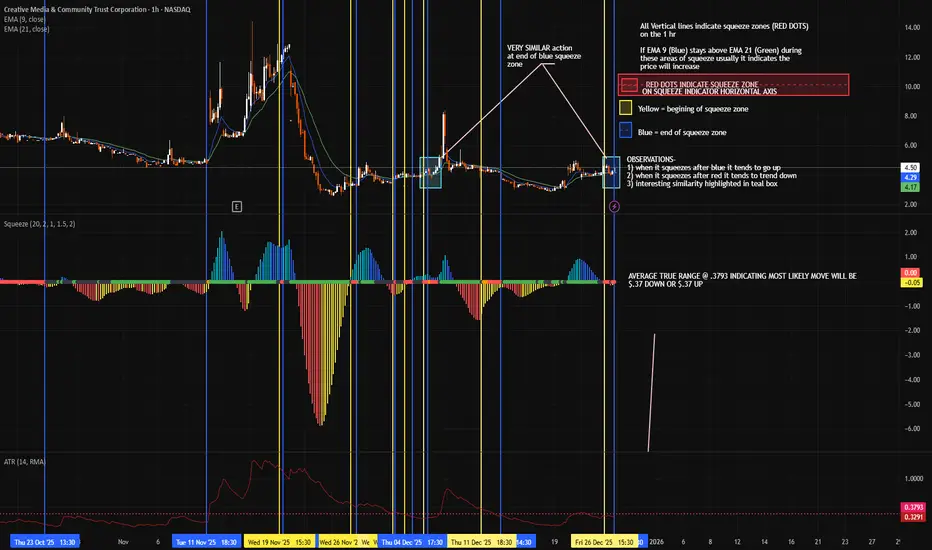
CMCT SQUEEZE IMMINENTUsed the EMA 9, EMA 21, Squeeze Indicator, and ATR indicator to map out squeeze zones and price movement in the last month plus. The bulls over at CMCT have brass balls and diamond hands and have locked the float. Despite massive manipulation this thing is about to go to the moon. Last week they washed 60% SI down to 4% on Monday with no covering and just last Thursday accrued another 56% Live Short Interest just to suppress the momentum. The pressure cooker is boiling and the shorts keep trying to put the fire out with gasoline by continuing to short with 400% CTB. I am no chart guru, this is my first time posting a chart and my first time using any of these indicators. Regardless, Ive been hodling and accumulating for 2 weeks and can sense the shift. Now would be a great time to get in and HODL for 20+ Lets finish 2025 with a bang! BULLS UNITE!

Silver - Strength Speaks Loudest!!🏆Silver has been one of the strongest performers across almost the entire market, consistently outperforming most assets and leading the momentum higher.
📈Structurally, price remains firmly bullish , respecting the rising blue channel with clean impulsive moves followed by shallow corrections. This behavior is exactly what strong trends look like.
🏹As long as this rising blue channel holds , the plan remains straightforward:
I’ll be looking for trend-following longs on every correction, not chasing highs, but waiting patiently for pullbacks into structure.
Only a clear and decisive break below the channel would invalidate this bullish thesis. Until then, Silver remains a buy-the-dip market, favoring continuation rather than reversal.
⚠️ Disclaimer: This is not financial advice. Always do your own research and manage risk properly.
📚 Stick to your trading plan regarding entries, risk, and management.
Good luck! 🍀
All Strategies Are Good; If Managed Properly!
~Richard Nasr

Multiple Ingredients for a Supernova Soup - $SESLet's start with the fact that this small cap hit my scanner at around 73 cents - and triggered a Tier 1 and Tier 2 buy program above $1.00 - The initial buy signal gap took weeks to fill and confirmed this was not a one-off... to top it all off earnings just blew everyone's socks off with almost a 200% revenue surprise, and if that wasn't good enough they announced a $30mm share buyback of common stock at retail - all of this combined with the AI buzz and a weekly slingshot that looks juicier than ever - we have ourselves a good chance at a multi week runner here. Will not be surprised to see a parabolic move between $10 and $20 PPS.

ICP - After a 250% Explosion, What’s Next?🚀ICP has just witnessed a massive parabolic rally , surging by over 250% in just a few days, an incredible move that pushed the price into overextended territory.
📉Now, after such a vertical climb, a healthy correction is unfolding. The area highlighted in red represents a major demand zone, where previous consolidation took place before the explosive breakout.
🏹As price retraces toward this zone, I’ll be looking for potential long opportunities, expecting buyers to step back in and push ICP higher, possibly toward new local highs in the coming weeks.
Could this correction be the perfect reload before the next leg up? 🔥
⚠️ Disclaimer: This is not financial advice. Always do your own research and manage risk properly.
📊All Strategies Are Good; If Managed Properly!
~Richard Nasr

DCR - The Calm Before the Next Impulse!📈DCR has recently surged in a parabolic manner, posting one of its strongest rallies in months. However, after such a vertical move, a correction phase was inevitable, and that’s exactly what we’re seeing now.
📉At the moment, price is retracing within a clear descending channel, approaching a massive confluence zone marked by the demand area and the lower red trendline. This intersection represents a key area of interest to look for potential long setups.
⚔️If buyers manage to defend this zone, DCR could soon resume its next impulsive leg upward, potentially breaking out of the correction structure and extending the broader bullish momentum.
⚠️ Disclaimer: This is not financial advice. Always do your own research and manage risk properly.
📊All Strategies Are Good; If Managed Properly!
~Richard Nasr

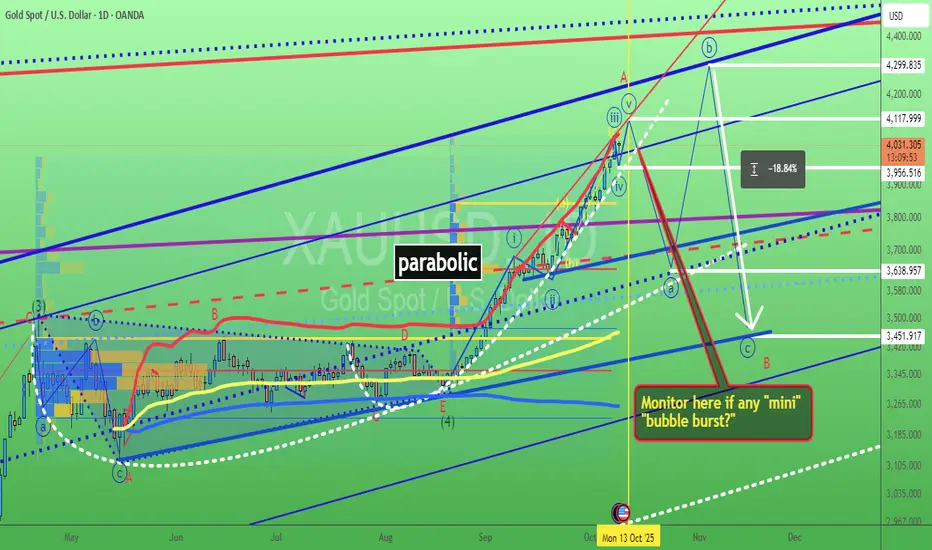
Gold waiting for its "mini" bubble burst? 9/Oct/25XAUUSD is forming another parabolic moves = the basic sign of bubble after triangle breakout. It has surged nonstop with many "mini bubble" inside big bubble So Watchout sudden small bubble burst first before surging for bigger bubble.
$ETH mega run is loading.
Ethereum has experienced nearly identical scenarios across three distinct market cycles.
• 🔓 Major Resistance is breaking
• 🔁 Before Running Retest
• 💥 And then Parabolic run
We are currently in the third cycle, and Ethereum has again tested the same horizontal level. In the previous two cycles, this movement was followed by a parabolic run.

$RDAR - Massive Weekly Slingshot, 1000x Potential RunnerWeekend scan continues to find the best candidates into this 8 year cycle - OTC:RDAR , wow is all I can say, this has massive potential once it breaks into sub territory with volume. The hype is in the AI buzz and the constant awareness for their product in the media.
Raadr Inc. (OTC: RDAR), also known as Telvantis Inc., is a U.S.-based technology company specializing in AI-driven software solutions aimed at combating cyberbullying and online harassment. The company offers tools for real-time monitoring of social media and digital platforms, targeting parents, schools, and law enforcement agencies.
If we learned anything about share structures with bloated OS/AS, it won't mean a damn thing once this sling gets going to the upside - remember how HMBL/ENZC/SNPW, had massive floats and still ran from trips to dollars... I got that itchin' feelin' again, taking a starter Monday and will add on momentum into the sling.

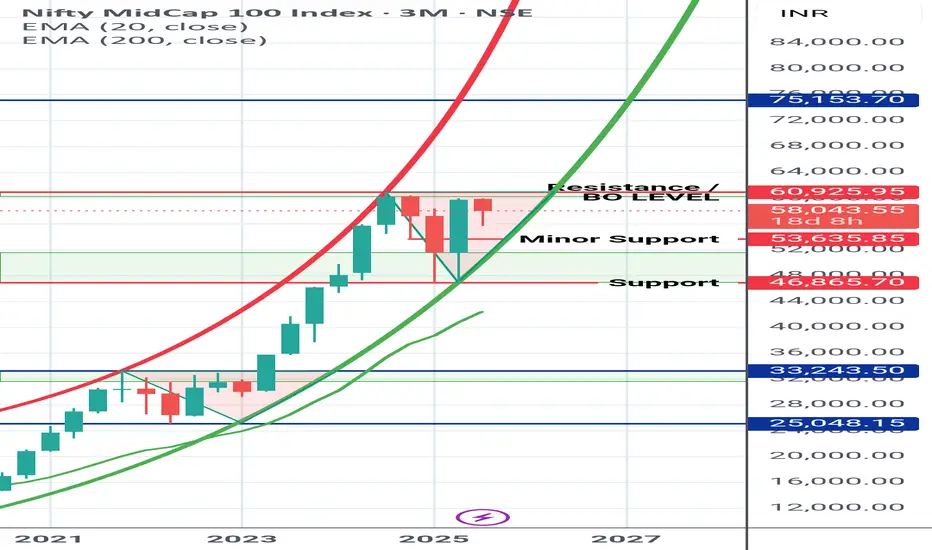
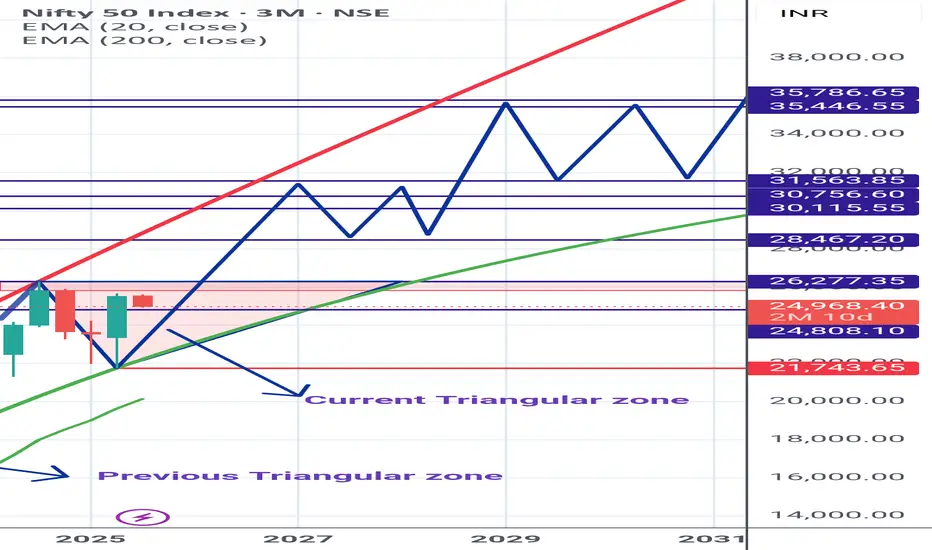
Nifty Midcap Index getting ready NIFTY MIDCAP
UPDATED MONTHLY TIME FRAME CHART
Any Dip is good buying opportunity for long.
Current Parabolic Support : 53635±
Major Support zone : 46900 - 52000
It is in Parabolic uptrend pattern.
Currently trading in Triangular zone. (Good for accumulation)
Based on the pattern, it is expected to move up 56%
Choose the best stocks in this indicies or Go with the ETF (safe investors)
*No Buy or Sell Recommendation*.
*Just for Reference purpose based on chart pattern*. 🙏
Bitcoin Warming Up- Like always, everything in the graphic to simplifies the information, stay simple is better.
- Bitcoin is known for its extreme price volatility, which can lead to major fluctuations, such as a significant crash in value followed by a rapid doubling of its price in a very short period, for that simple reason i avoid to predict low timeframe moves.
- Now check the hidden bullish divergence, check the level of BBW, the volality could be low, but TheKing could be ready to make parabolic move soon or later.
- I do my best to try to post at the good time for medium long term investment.
- Don't forget that 125,000$ is far to be enough.
Happy Tr4Ding !

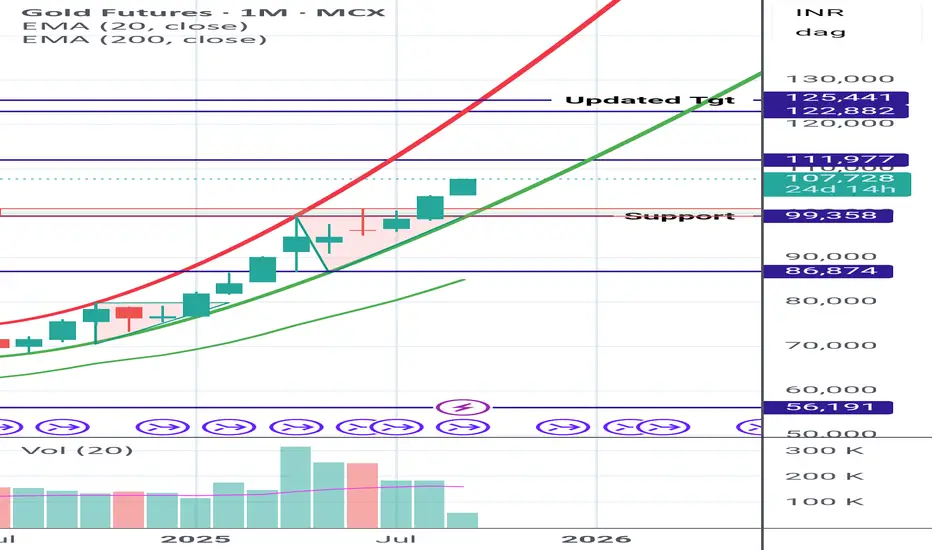
Gold Futures - Going to be a Dream for Many Gold : Going to be a Dream for Many.
*Gold Not to be Sold*✨✨
Support and Updated Tgt are marked in Chart itself.
Note : This is my Personal view based on chart pattern and My STUDY.
Kindly do your research and don't get biased by my view
Ethereum at the beginning of a parabolic run As confirmed by Ethereum's RSI, the major breakout that occurred 1,570 days later confirms the start of a parabolic run.
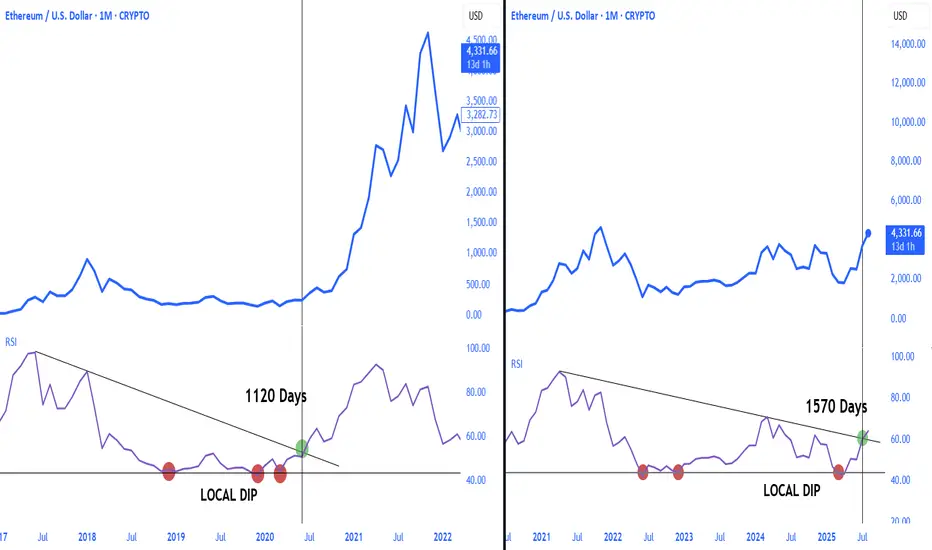
Ethereum Parabolic Season Coded! The major down trend breakout in Ethereum, which also occurred in terms of RSI, will trigger a transition to a major upward phase.
Major trend breakout in CRYPTOCAP:ETH after 1570 days!

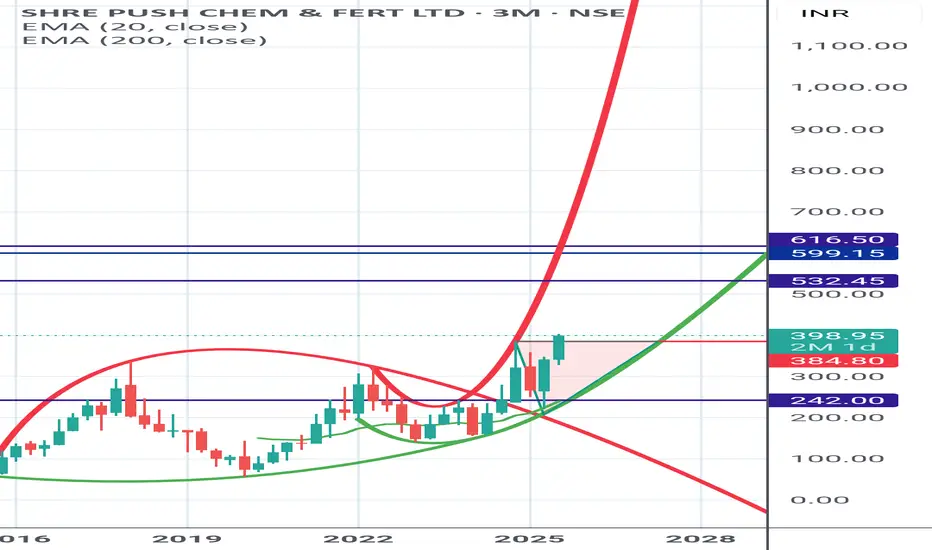
Shree Pushkar SHREEPUSHKAR
TECHNO FUNDA PICK getting out of the marked Triangular zone.
Needs to close above and sustain it for big rally.
Note : This is Purely based on MY STUDY.
DO YOUR ANALYSIS FROM YOUR SIDE ALSO.
Personal view is BULLISH
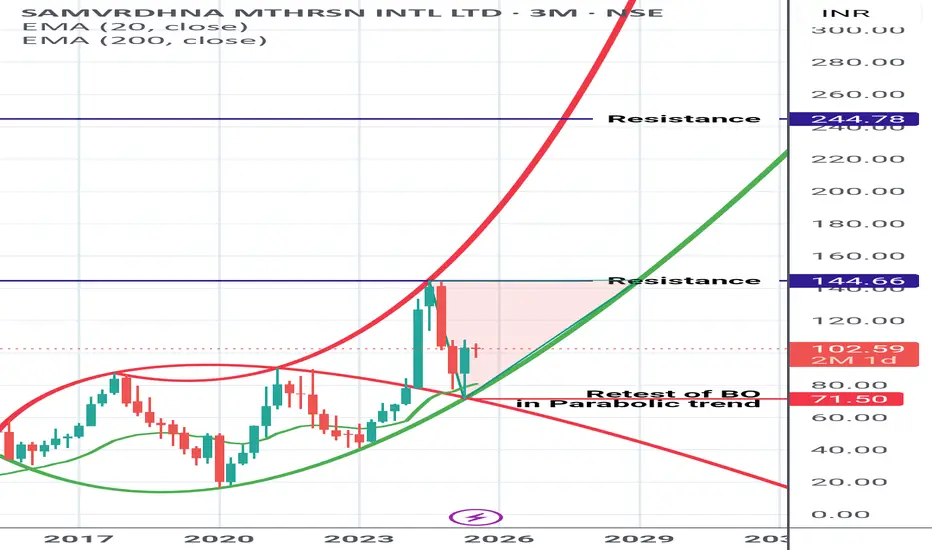
Samvardhna Motherson Getting ready Samvardhna Motherson
Earlier mentioned about Elliptical Pattern Breakout and the Rally in it .
Currently retesting the Parabolic trend support and trading inside the Triangular zone.
View is : Slowly getting ready for big rally. Stay invested.
Purely based on My STUDY . Lets see how it works.
Don't get biased by my views.
I may be wrong too.
Always do your own research.
Shared it for Reference purpose
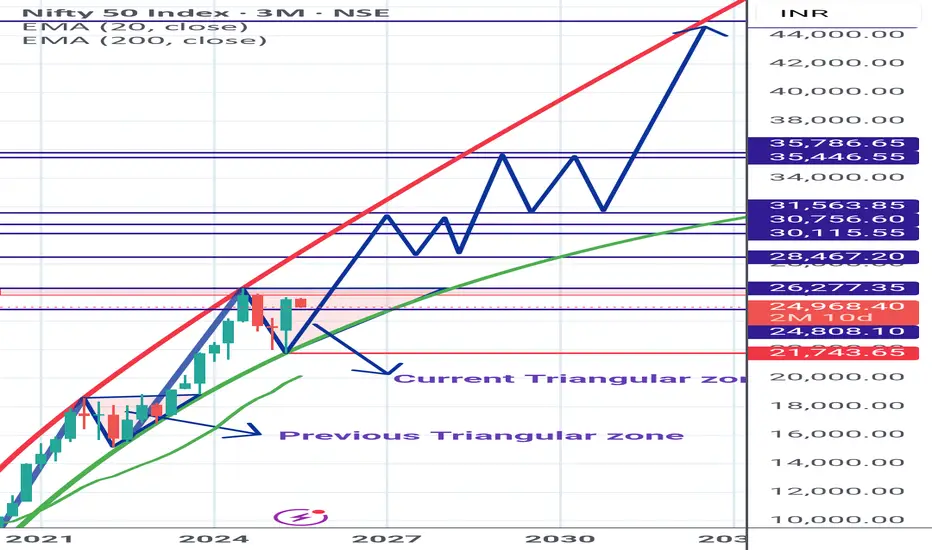
Nifty Spot Longterm View *Nifty Spot* Chart for members Reference.
Currently trading in Parabolic trend and inside Triangular zone.
On closing above the triangular zone, big rally to Begin.
Shared *My Study* based on chart pattern.
Kindly do your analysis from your side too.
Nifty Spot Longterm View*Nifty Spot* Chart for members Reference.
Currently trading in Parabolic trend and inside Triangular zone.
Shared *My Study* based on chart pattern.
Kindly do your analysis from your side too.
Golden Cross on GME WeeklyGME Chart Breakdown, Déjà Vu or Destiny? Something big just lit up the weekly chart, the 50 MA has pierced through the 200 MA, forming that golden cross traders dream about. On the weekly timeframe. Not a drill.
Now, let’s rewind. The last time this pattern appeared? January 2021. The infamous squeeze. Back then, GME didn’t just nudge upward, it catapulted nearly 4000%, going from a $3 floor to $120 in a blink.
Fast forward to today, new golden cross, new setup, and a $23 floor. If history rhymes even remotely, we’re staring down a hypothetical $1000 per share move. Yes, one thousand.
Is lightning about to strike twice? Stay tuned to find out!

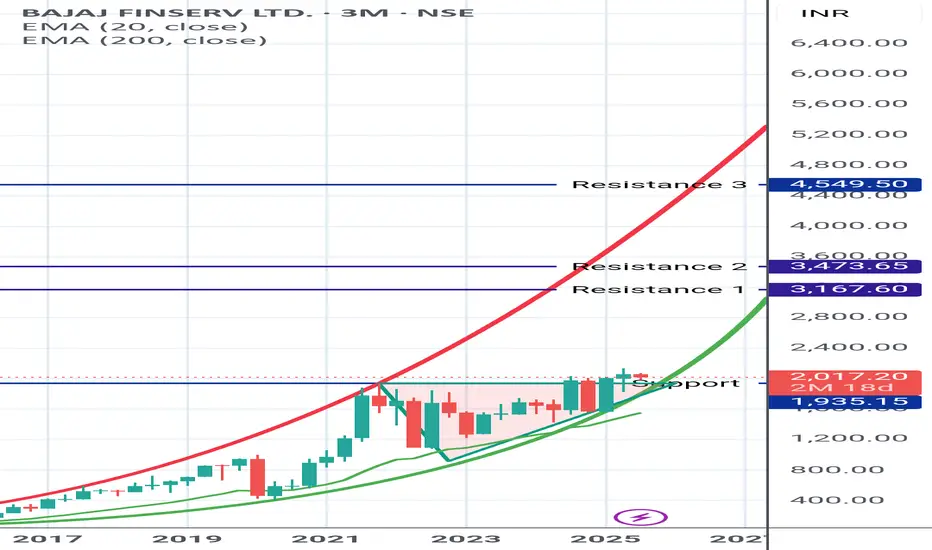
Baj Finserv Bajaj Finserv
looks good in Parabolic uptrend. Recently closed above the triangular marked zone and retesting it.
Can expect fresh rally.
Bitcoin Could Hit as High as $400KWhen comparing our macro cycle to the 2017 cycle, we see the potential for a very parabolic run on Bitcoin. I believe Bitcoin could hit as high as $400K by 2029. This is because Bitcoin tends to follow the stock market, and I anticipate a major blow-off top coming for the stock market. I expect one more big parabolic run on the Dow Jones leading up to 2029, which would fuel Bitcoin’s rise to $400K.
The lowest I see Bitcoin going during this parabolic run is $250K. On the higher end, I could see it hitting $400K or even more. Big things are coming.
As always, stay profitable.
— Dalin Anderson
