BITCOIN even more gain expected 💣 🚀Hello 🐋
we expected the retest of the support zone and ascending channel to be completed ✔️
if
the price doesn't break the support zone to the downside and just complete the retest, we will see more gain, at least to our upper trend line 💣🚀
otherwise
we can see more correction to lower support level ❌🧨
if
breakout of the upper resistance zone be completed, we can see more pump to the upside ✔️🚀
👌 Notice: pay attention to the price on shortcut chart (located below the main chart with black colour) 📖💡
Please, feel free to share your point of view, write it in the comments below, thanks 🐋
Parallelchanel

2223 (Breakout Observed, Wait for Retest)Continuosly in Uptrend
Broken Parallel Channel
Broken All Time High with good volumes
Expected move, small red candle Thursday and Sunday (Retest of Breakout)
Take entry on Sunday after accumuation for uptrend
(Another Expected move, gap up opening, test at 101.8 and move up)
trade with SL

BTCUSDT - Medium to Long Term RangeBased on -0.618 support level. Possible play out with support and resistance. Obvious support -0.618. Mid level resistance -0.236 and 0 fib. Upper range 0.618 with a support back to -0.236.
Also 2 Fib channels. 0.618 the bottom of the first upward channel.
This is a Bullish bias, use -0.618 as a support level.

BITCOIN aging in ascending channel retest and more gain 📖🚀Hello 🐋
Based on the chart, the price is again in the ascending and close to the channel support area , and we expected the retest to be completed ✔️
if
the price doesn't break the support zone to the downside and just complete the retest, we will see more gain, at least to our upper trend line 💣🚀
otherwise
we can see more correction to lower support level ❌🧨
if
breakout of the upper resistance zone be completed, we can see more pump to the upside ✔️🚀
👌 Notice: pay attention to the price on shortcut chart (located above the main chart with black colour) 📖💡
Please, feel free to share your point of view, write it in the comments below, thanks 🐋

LINKUSDT Exiting Ending Diagonal from the last impulsive wavePrice action, based on Elliot Waves principles, is falling from peak after complete an Ending Diagonal from the last extended impulsive wave to a potential target at local demand in hourly timeframe in a possible 78,6% retrace as shown on AB=CD pattern, below volume POC and after reject Anchored VWAP from May '22 bottom. Consolidating in a parallel channel as shown within a modified Schiff Pitchfork. Potential swing-downward in a corrective wave target to Dec '22 low re-test. Monthly Inside Bar zone.

SOLONA triangle pattern gain after breakout parallel channel 🚀Hello 🐋
Based on the chart, the price is close to the parallel channel support area and in triangle pattern ,
if
the price doesn't break the support zone to the downside and breakout of the ascending channel completed , we will see more gain, at least to our upper trend line 🚀
otherwise
we can see more correction to lower support level before hitting the upper resistance area ❌🧨
besides,
the range market is acceptable scenario too 📖💡🚀
👌 Notice: pay attention to the price on shortcut chart (located above the main chart with black colour) 📖💡
Please, feel free to share your point of view, write it in the comments below, thanks 🐋

NIFTYHello & welcome to this analysis
In the monthly time frame a comparison between the period which happened between 2018 - 2020 and the current one from June 2022 till now suggests a lot of similarity in path.
In the current scenario its taking support at the lower end of the channel and consolidating. if 17300 is held then it could resume its uptrend for the upper end of the channel.
Do note this is a monthly time frame outlook and not for short term derivative swing / breakout trading.
Best wishes on your investing/trading.

BITCOIN out of parallel channel retest and more gain 📖🚀Hello 🐋
Based on the chart, the price is close to the channel support area and break out of the parallel channel has completed ✔️
if
the price doesn't break the support zone to the downside and just complete the retest, we will see more gain, at least to our upper trend line 💣🚀
otherwise
we can see more correction to lower support level ❌🧨
Please, feel free to share your point of view, write it in the comments below, thanks 🐋

Gold Breakout from Parallel ChannelTVC:GOLD
TVC:GOLD has successfully broke out from parallel channel, rallying towards its weekly resistance of 1941; most likely to breakout till psychological barrier of 2000.
SO LONG !!!

BITCOIN out of ascending channel retest and more gain 📖🚀Hello 🐋
Based on the chart, the price is close to the channel support area and break out of the parallel channel and ascending channel has completed ✔️
if
the price doesn't break the support zone to the downside and just complete the retest, we will see more gain, at least to our upper trend line 💣🚀
otherwise
we can see more correction to lower support level ❌🧨
Please, feel free to share your point of view, write it in the comments below, thanks 🐋

Forecast for Stader after Channel BreakStader is a staking solution, currently live on Hedera, Polygon, Fantom, Near, Binance, Terra 2.0, and Terra Classic networks.
I expect the price to replicate the amplitude of the long channel.


NATURE OF XAGUSDI am checking the nature of the XAGUSD from the previous 10-12 years chart.
By looking at the nature of the chart I realized the following things:
1. Forming a Bearish Rally inside a parallel channel
2. Break the rally and forms a range
3. Completes the range and forms a parabolic shape/ cup n handle pattern
4. Moves upside after completing the pattern
It repeats this process two times and now it is again at the 1st step (Forming a Bearish Rally)


Dogechain 3 Line Strike Bullish FractalDogechain appears to be acting similarly to how it did before the first pump as it's formed a Bearish 3 Line Strike Pattern, Broken out of a Parallel Channel, and now it it stands to make a higher low on the Macro and go for an ABCD movement to the upside which would take it to the 1.618 Fibonacci Extension above.

THEI: TASI Index is running cotinuously in Bullish trend within Ascending Parallel Channel
Enjoy the Uptrend leg
within Asecnding Parallel Channel for few weeks
Watchout for downtrend leg later
Watch Individual Scripts for Trade Setups

NVDA: Placing the Rally in ContextPrimary Chart: NVDA's Primary Trend Since Its All-Time High November 22, 2021, with Anchored VWAPs
SUMMARY:
NVDA appears to have begun a countertrend rally within the context of a sharp downtrend.
Other countertrend rallies have ranged from 28.9% to 40.17%. Don't be fooled by a show of strength that does not change the overall structure. Countertrend trading is lower probability, but can be lucrative if risk is managed with great discipline.
The most conservative upside target (resistance) range for this rally is $128-$130. This would be reached, if at all, in the next week or two.
If the $128-$130 level is reclaimed successfully, then the next higher target to consider is the $145-$150 range discussed below.
Watch the green uptrend line off the YTD low on October 13, 2022 and the red VWAP anchored to the YTD low. If either is broken, all bets are off.
NVDA has rallied about 15.58% off its YTD lows on October 13, 2022. The lows have not been undercut now for a little over a week. Broader equity indices have rallied as well, with the S&P 500 and the Nasdaq 100 both gaining about 2.3% on Friday. NVDA rallied along side both these indices.
1. NVDA's rally could continue into the FOMC meeting on November 1-2, 2022. The FOMC is likely to increase interest rates by .75 percentage points at the November 2022 meeting. The CME's Fed watch tool, tracking federal-funds-rate futures products, shows the probability of a 75 bps hike at 88% for November. Have markets already discounted this? Probably. What is unknown is whether any change in the Fed's messaging will occur or will the Fed maintain its higher-for-longer hawkish stance to deal with sticky inflation. Fed officials have spoken in recent weeks expressing dissatisfaction with the current inflationary environment and its ramifications for price stability.
2. Pullbacks may likely respect the very short-term VWAP anchored to the YTD low (red VWAP anchored to October 13, 2022). Watch this VWAP for support. If the VWAP is violated, it will be important to determine if the violation is decisive (slicing through and showing no sign of reverting back to the level) or if the violation is minor and brief.
3. NVDA just closed above its 21-day EMA, which lies at 124.16. Today's close was 124.66.
4. Before any higher price targets can be taken seriously, NVDA must reclaim its 34-day EMA (currently just below $130) as well as a key Fibonacci level (teal .236 level at $128.10) (shown just below this paragraph). This is the most conservative target zone for a countertrend rally.
Supplementary Chart: Fibonacci Levels
5. A more ambitious zone for a price target may be considered only if the 34-day EMA is recovered first. This secondary target zone comprises two technical levels: (a) the VWAP anchored to the August 4, 2022, high currently located at 143.08, and (b) the gap fill area (teal-blue rectangle) at $145 to $150.
6. It remains crucial to place any rally into context, even if the rally seems like a powerful rally that is unstoppable for a while, like some of the other bear rallies in this market. Massive bear rallies can trick market participants into thinking the lows may be in, and lure them with fear of missing out. Other countertrend rallies have ranged from 28.9% to 40.17%. Don't be fooled by a show of strength that does not change the overall structure. Countertrend trading is lower probability, but can be lucrative if risk is managed with great discipline.
7. The larger context is a downtrend at the degree of the primary trend. All major swing highs and lows over the past year have been lower highs and lower lows. The anchored VWAP at the all-time high (dark purple) remains well overhead. Price would have to rally and hold the $190-$200 level to show material structural change. All other rallies will constitute noise at the larger degree of trend. In other words, the downtrend channel should contain any rallies for the time being. If not, then it becomes appropriate to consider whether a larger-degree structural change is occurring that may lead to a major trend reversal.
Please note that SquishTrade is "cautiously bullish" only for the next week. In the larger scheme, the outlook remains bearish until substantial evidence appears that structural trend change is occurring at the larger degrees of trend. This remains unlikely with interest rates breaking above a 40-year trendline as discussed in this post:

GBPUSD-Weekly Market Analysis-Nov22,Wk2Let me know if this analysis confused you. Comment at the bottom; I like to know.
The entire structure is on a bearish trend; there is an ascending channel that is shaded red, from that you know that my bias is looking for a shorting opportunity. As long as the market movement is kept within 1.1736, the bearish trend is considered very strong.
Failure to do so, I will patiently wait for the market retest 1.2572 for a shorting opportunity on the Bearish Butterfly Pattern setup.

2280: ALMARAIBullish Trend
Ascending Wedge
Trade with specified Stop Loss
Target profits with trailing stop loss

$XAUUSD - Might jump to $1800Hi guys! 👋🏻
🔔 Gold hit $1670 today after the release of NFP and negative employment data. China’s plan to resume flights could bolster weakening of the US Dollar and support the continuation of this bullish run.
🔔 XAUUSD made an important test and a breakout from the dynamic resistance of March 2022. The $1615 - $1617 support level withheld a downtrend pressure backing a formation of a triple bottom pattern.
🔔 As of now, XAUUSD is traded at $1674 and is testing a major resistance at this level. To close the trading week, Gold might retrace from these levels near $1655, gain more power and try to break the $1674 resistance later.
🔔 When the uptrend continuation is confirmed, and gold closes above $1674, look for resistances at $1720 and $1801.
✊🏻 Good luck with your trades! ✊🏻
If you like the idea hit the 👍🏻 button, follow me for more ideas.

AUDCADConsidering that I think the dollar index has another upward lag, I think this path can be analyzed for this currency pair.

USD/CHF: detailed chart breakdown and the next target Judging by the fact that a solid ascending channel has been formed, the middle to long-term sentiment of the pair is expected to remain bullish.
At the moment, the price is ranging within the borders of the consolidation box identified on the chart. The previous DAILY candlestick has closed impulsively bearish, which means there is still a bit of room for the price to drop.
We are eyeing the area below the range that lines up with the lower boundary of the ascending channel for entering long positions. Our initial target will be set at the area of resistance plotted on the graph.

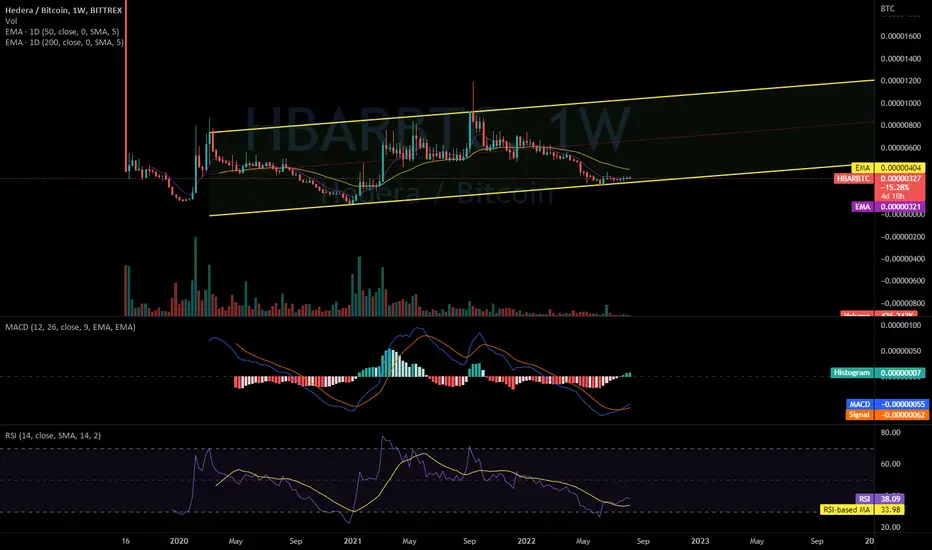
HBAR / BTC in a Parallel Uptrend?Quick chart here. Is HBAR / BTC in a parallel uptrend? We still need 3 touches at top and bottom to confirm this. If this is correct, we're at the bottom of the trend now and should see another trip to the top.
Should we do that and stop at the top, expect to see a third trip to the bottom as well. MACD and RSI are also pointing to a reversal here, as confluence.
An alternative possibility, if we hold channel bottom and then break channel top, this could turn into a giant inverted head/shoulders and become much more bullish sooner.