ETHEREUM - Bullish market behavior pattern. Confirmation?BINANCE:ETHUSDT is forming a consolidation in the $3300 zone in a “descending wedge” pattern, which is a relatively bullish market behavior model.
The market is reacting to the improvement in the fundamental background, inflows of funds are increasing, and buyers are showing interest. Local trends are beginning to change for the better. After the rally, Bitcoin is trying to consolidate above 94-95K, and if it succeeds, we will have a green signal.
Ethereum is consolidating and fighting for the 3300 zone after implementing a U-formation pattern. Overall, there are signs of bulls in the market, and if buyers keep the price above 3300, the market will have an opportunity for growth.
The price is forming a descending wedge against the backdrop of a local bull market. A close above 3315 will be a confirming signal for growth.
Resistance levels: 3315, 3383, 3450
Support levels: 3300, 3281
The price has consolidated above 3300 and above 3315, as well as broken the resistance of the descending wedge. If the bulls keep the price above these key areas, another bull run may form...
Best regards, R. Linda!
Parallel Channel

BTCUSDT Long: Buyers in Control Above 94K, Next Stop 98.5KHello traders! Here’s a clear technical breakdown of BTCUSDT (3H) based on the current chart structure shown in the screenshot. BTCUSDT previously traded inside a well-defined descending channel, reflecting strong bearish pressure and consistent lower highs and lower lows. This bearish phase ended near a clear pivot point, where selling momentum weakened and buyers stepped in aggressively. From this pivot, price initiated a recovery move and successfully broke out of the descending channel, signaling a shift in short-term market control. Following the breakout, BTC transitioned into a broad consolidation range, where price moved sideways for an extended period. This range represented a balance between buyers and sellers, with multiple internal reactions confirming accumulation and uncertainty before the next directional move. Eventually, BTC broke out from the upper boundary of the range, confirming renewed bullish interest. After the range breakout, price formed a well-structured ascending channel, characterized by higher highs and higher lows. This structure confirms a bullish corrective-to-impulsive transition, with buyers maintaining control. Within this channel, BTC recently broke above a key Demand / Support Zone around 94,000, which previously acted as resistance and is now acting as support.
Currently, BTCUSDT is approaching a major Supply Zone around 98,000–98,500, where selling pressure has previously appeared. This zone aligns with the upper boundary of the ascending channel, increasing the probability of a reaction or short-term pullback. The most recent price action shows hesitation near this area, suggesting that sellers are beginning to defend higher levels.
My scenario: as long as BTCUSDT remains above the 94,000 Demand Zone and continues to respect the ascending channel structure, the bullish bias remains intact. I expect buyers to defend pullbacks toward demand and attempt another push into the 98,000–98,500 Supply Zone (TP1). A clean breakout and acceptance above this supply would confirm bullish continuation and open the door for further upside. However, a strong rejection from the supply zone followed by a breakdown below the ascending channel and 94,000 support would signal weakness and increase the probability of a deeper corrective move back toward the prior range highs. For now, price is at a key decision area near supply. Manage your risk!

BTCUSDT: Pullback To 93K Support Before Return of Bullish TrendHello everyone, here is my breakdown of the current BTCUSDT setup.
BTCUSDT previously transitioned from a strong bearish impulse into a recovery phase, where price formed a well-defined upward channel, signaling a corrective bullish structure. Within this channel, Bitcoin produced higher highs and higher lows, confirming temporary buyer control after the sell-off. During this phase, price also formed a consolidation range, reflecting a pause and balance between buyers and sellers before the next move. As price advanced, BTCUSDT approached a major Resistance Zone around 95,500–96,000, where selling pressure became evident. Multiple tests of this area failed to produce acceptance above resistance, and a clear rejection / test occurred at the top of the channel. This behavior indicates supply dominance at higher levels. Following the rejection, price broke below the upper channel structure and pulled back toward the Support Zone near 93,000, which previously acted as both demand and a breakout level.
Currently, BTCUSDT is trading below the resistance zone and showing signs of weakness after the failed breakout attempt. The recent breakout below minor support suggests a potential continuation to the downside, while the broader structure remains vulnerable as long as price stays capped below resistance.
My Scenario & Strategy
My primary scenario remains bearish while BTCUSDT trades below the 95,500–96,000 Resistance Zone and continues to show rejection from the upper channel. Any pullbacks toward resistance that show weakness or rejection may offer short opportunities, with downside continuation toward the 93,000 Support Zone as the first objective. A decisive breakdown below support would open the door for a deeper corrective move.
However, a strong breakout and acceptance above resistance would invalidate the short bias and signal a shift back toward bullish continuation. I believe there will be a correction to around 93K, and then a resumption of the bullish scenario.
That's the setup I'm tracking. Thank you for your attention, and always manage your risk.

EURUSD: Sellers Take Control Below Key Resistance, Eyes 1.1600Hello everyone, here is my breakdown of the current EURUSD setup.
Market Analysis
EURUSD previously traded within a well-defined upward channel, confirming a bullish recovery phase after forming a strong base from the prior decline. Buyers maintained control by producing higher highs and higher lows, eventually pushing price toward a key Resistance Zone around 1.1690–1.1700. At this resistance area, price transitioned into a broad range, signaling a balance between buyers and sellers. Multiple attempts to hold above resistance failed, indicating growing selling pressure at the highs. Eventually, EURUSD broke down from the range, confirming a loss of bullish momentum and a shift in short-term market control.
Currently, EURUSD is trading within the descending channel and moving toward a key Support Zone around 1.1600, which previously acted as a demand area and a structural reaction level. This zone represents the next important area where buyers may attempt to slow or pause the decline.
My Scenario & Strategy
My primary scenario remains bearish as long as EURUSD stays below the 1.1690–1.1700 Resistance Zone and continues to respect the downward channel. Any pullbacks into resistance that show rejection can be viewed as potential short opportunities, with downside continuation toward the 1.1600 Support Zone as the first target.
However, a clean breakout and acceptance above resistance would invalidate the short bias and suggest a possible shift back toward consolidation or bullish recovery. Until that happens, market structure favors sellers, and rallies are considered corrective within the broader bearish context.
That’s the setup I’m tracking. Thank you for your attention, and always manage your risk.

XAUUSD Holds Bullish Structure Above Support - Eyes on $4,680Hello traders! Here’s my technical outlook on Gold (XAUUSD, 3H) based on the current chart structure. Gold is trading within a well-defined bullish trend after reclaiming key levels and establishing a sequence of higher highs and higher lows. Earlier on the chart, price formed a consolidation range, signaling accumulation before continuation. This range was later broken to the upside, confirming renewed buyer control and continuation of the broader bullish structure. Following the breakout, price moved higher but then entered a corrective phase, pulling back toward the rising trend line and the Support Level around the 4,510 area. This pullback appears corrective rather than impulsive, with buyers stepping in to defend the trend. Price respected the support line multiple times, forming fake breakouts to the downside before reversing higher, which further confirms underlying buying strength. Currently, XAUUSD has broken above the descending resistance line and is consolidating above it, signaling a successful breakout and potential continuation. Price is now trading above the Buyer Zone and approaching the Seller Zone / Resistance Level around 4,640. This area represents a key reaction zone where selling pressure may appear. My scenario: as long as Gold holds above the Support Level and continues to respect the rising trend line, the bullish structure remains intact. A clean breakout and acceptance above the 4,640 Resistance Level would confirm continuation toward the next upside target 4,680 (TP1). However, rejection from resistance could lead to a short-term consolidation or corrective pullback toward support before the next attempt higher. For now, the bias remains bullish, and price is positioned for a potential continuation move. Please share this idea with your friends and click Boost 🚀

GBPAUD higher bearish expected
OANDA:GBPAUD RECTANGLE pattern, we have and break of CHANNEL, price is make bounces on sup zone (violet doted), currently price in DESCENDING CHANNEL.
Here for new week higher bearish expecting.
SUP zone: 2.02000
RES zone: 1.99600, 1.99100

UJ - Thoughts, Ideas and Plannotation:
black - weekly range
blue - daily range
red - 4h range
green - 1 range
M,L,H - Middle Low High
W,D,4,1 weekly Daily 4H 1H
R Range
Daily:
The pair is trading on a one year high and last time it get here it reversed trend completely, past charts are not to use for forecast, but they sure tell you when the price has reached a strong level. The two candle reversal/tweezer top formed on Wednesday give us a clue of a possible correction or pause, so we might expect to see the price fall further, target between the daily and weekly mid range 157/157.5. From here we are looking to see if the dollar will be able to push through the current high, form a double top or a LH ( if the BoJ intervention strengthen the Yen enough)
4h:
Here a down trend within the slow time frame up trend. In the last hours of Friday the stopper came and a new range was formed, and this will help a lot with the trading decisions next week.
1h:
Zooming further in, we get a better picture of the trading levels. We see that the price stopped falling at an area which previously, not long ago, was an are of congestion and we can expect the price go either direction, returning to test the high or breakout and continue toward the WMR.
The Plan
Short Breakout 157.821 target 1 DMR 157.488 target 2 WMR 156.880
Long Rejection 157.821 target 4MR 158.354 target 2 4h upper band 158.882
Short Rejection + Breakout 158.354 target DMR 157.488
Thank you for dedicating some of your precious time reading this,
I wish you a profitable trading experience .

EJ - Thought, Ideas and Plannotation:
black - weekly range
blue - daily range
red - 4h range
green - 1 range
M,L,H - Middle Low High
W,D,4,1 weekly Daily 4H 1H
R Range
Daily:
The great fall of EJ might finally start. On the beginning of the week the pair formed a new high and new daily range, but then the following days the PA entered a water fall, on a weak euro and yen that is founding strength on rumours of BoJ intervention. Too early to speak of a trend reversal but we are starting to have some ground for it. Next week the pair will have to tackle the daily range low 182.653 and possibly the 1.25 range extension which is at around 182.000. This might be too much to ask, but knowing the J pairs and the high ATR it is possible. An increase in tick volume will be a primary confirmation for this move as we want to see high participation to support the move.
4h:
Since Wednesday the pair has been mostly in a free fall without any major correction. And it won't be surprising to see this trend to continue down to the daily low boundary 182.653 before we see some more bullish participation. And it is from this level that our trading opportunities are starting to open.
1h:
Zooming in, we have a healthy down trend on the faster TF, trading below the daily and 4h mid ranges and also having a strong area of resistance at around 184.000 where this mid ranges are meeting. Mid- ranges offer great entry opportunities, and by the way they work just like Fibonacci retracement levels, mid range is the 50% fib retracement.
The Plan
Short Breakout current low/ 4h lower band Target Daily Lower band 182.653
Short Breakout daily lower band Target Daily 1.25 extension 181.944
Long Rejection 182.653 target MDR 184.000
Short Rejection MDR Target 181.944
Thank you for dedicating some of your precious time reading this,
I wish you a profitable trading experience .

EU, Thoughts, Ideas and Plannotation:
black - weekly range
blue - daily range
red - 4h range
green - 1 range
M,L,H - Middle Low High
W,D,4,1 weekly Daily 4H 1H
R Range
Daily:
The Euro continues the waterfall, falling below the Weekly Mid Range, and also continues to trade in this super wide side trend started in June last year L1.13907 H1.19183.
Next price target for the pair is 1.150, before reaching that target it is highly likely to see a correction or re-test of the last high at 1.17 which is also exactly the 50% of the daily range.
The current 1.16 level has been a strong support in the past year so it won't be surprising to see a rejection here or a pause.
4H:
Very interesting picture at this TF. First thing to note is the down slopping channel which began on the very begging of the year and still holds, up and down channels always offer very good trading set-ups. On the other hand is to note the amount of range levels above the current price and the lack of levels below, that means we are well below the Daily and Weekly Mid-Range levels, we are trading on the bottom half of the 0.5 percentile, which confirms a healthy bearish bias. Any attempt to go higher will be encountered with a lot of selling pressure.
1H:
Observing those levels more in details, currently we are sitting at around 1.15988 levels above that could be potential sell levels are:
1h mid range and down trend channel mid range
4h mid range and 1h Upper Band
4H upper band and weekly mid range
On the bottom we are looking at daily lower band for a breakout and trend continuation
The Plan
Short Breakout 1.15846 Target daily 1.25 percentile 1.15282
Long Rejection 1.15846 Target 1.16273 or 1.16429
Short Rejection 1.16273 or 1.16429 Target daily low band and below
Thank you for dedicating some of your precious time reading this,
I wish you a profitable trading experience .

Weekly suggests top is in for nowTouched upper channel edge on weekly but ultimately got rejected. Major correction in the next couple of weeks. RSI 95 on weekly which I think is the highest ever. Big RSI DIVERGENCE on all time high of around 8%. There is huge Leverage on the long side polymarket, leveraged etf, CFDs that when they go - we will be looking at 30% downside with a lot of hopeful bulls trapped. The bullishness, the leverage, the moves remind me of 1929 and during the fall of 1929 there were lots of mini corrections as people got jittery in their longs but the belief that you buy the dip. This is that time again. Market is trying to tell us something.
Bullishness among traders is off the scale with so many posters saying "it's different this time" even though fundamentals are basically the same as they were for the last year.
My trade of 2026 is SHORT METALS (incl COPPER, SILVER, GOLD) , LONG CRYPTO, TREASURIES, STOCKS
DISCLAIMER Not investment advice. Do own research and trade accordingly.

Very rare diamond patternThis very rare pattern usually indicates a change of trend. Is doing it in the weekly timeframe and setting up for a massive breakout of the descending channel. Also, oil is setting up an inverse HS and many of the big oil companies show bullish patterns. SL and TP are shown on the charts.
Good luck.

EURUSD Short: Sellers Take Control Below 1.1680Hello traders! Here’s a clear technical breakdown of EURUSD (2H) based on the current chart structure. EURUSD previously traded within a well-defined ascending channel, confirming a strong bullish phase with consistent higher highs and higher lows. During this advance, price formed a consolidation range, which eventually resolved to the upside with a breakout, reinforcing bullish momentum. However, as price approached the key Supply Zone around 1.1680–1.1700, buying pressure started to weaken. Several attempts to hold above this area resulted in fake breakouts, signaling strong seller presence and exhaustion at the highs. Following the rejection from supply, EURUSD formed a clear rounding top near the pivot high, marking a structural transition. Price then broke below the range support and the ascending channel, confirming a short-term shift from bullish to bearish control. This breakdown led to the formation of a descending channel, where price is now producing lower highs and lower lows. Recent pullbacks into the channel resistance and supply area have failed, further confirming that the upside moves are corrective rather than impulsive.
Currently, EURUSD is trading below the 1.1680 Supply Zone and is moving toward the Demand Zone around 1.1600, which represents a key support level and the next potential reaction area. This zone aligns with previous structure and may attract buyers for a temporary pause or bounce.
My scenario: as long as EURUSD remains below the 1.1680 Supply Zone and respects the descending channel, the bearish bias remains valid. I expect sellers to maintain control and push price toward the 1.1600 Demand Zone (TP1). A clean breakdown and acceptance below 1.1600 would open the door for a deeper bearish continuation. However, a strong bullish breakout and acceptance back above 1.1680 would invalidate the short scenario and suggest a potential shift back toward consolidation or recovery. For now, market structure favors sellers. Manage your risk!

GOLD - Consolidation continues amid bullish trendFX:XAUUSD maintains its upward trend but shows signs of weakening short-term momentum as the market phase has shifted to consolidation. Interest in the metal remains high...
Fundamentals: Tensions between the US and Iran have temporarily eased. Strong US data has reinforced expectations that the Fed will keep rates unchanged until mid-2026, but there will be more news next week... Fed Chair Powell will not be fired, according to Trump, which has eased fears of sudden policy changes.
Inflation in the US (CPI 2.7% y/y) remains above the Fed's target, supporting the regulator's caution.
The market expects the Fed's first rate cut no earlier than June 2026.
Gold maintains a long-term uptrend, but a short-term correction may continue to key liquidity zones. From a fundamental point of view, a resumption of growth will require either a deterioration in geopolitics or weak macro data, and from a technical point of view, a long squeeze or a false breakout of 4581, 4561, 4550...
Resistance levels: 4621, 4639, 4650,
Support levels: 4581, 4561, 4550
The market clearly shows limit support zones behind which a pool of liquidity is hidden. MM will most likely not leave these zones untouched. The capture of liquidity and the bulls' ability to keep prices above key support zones could trigger growth.
Sincerely, R. Linda!

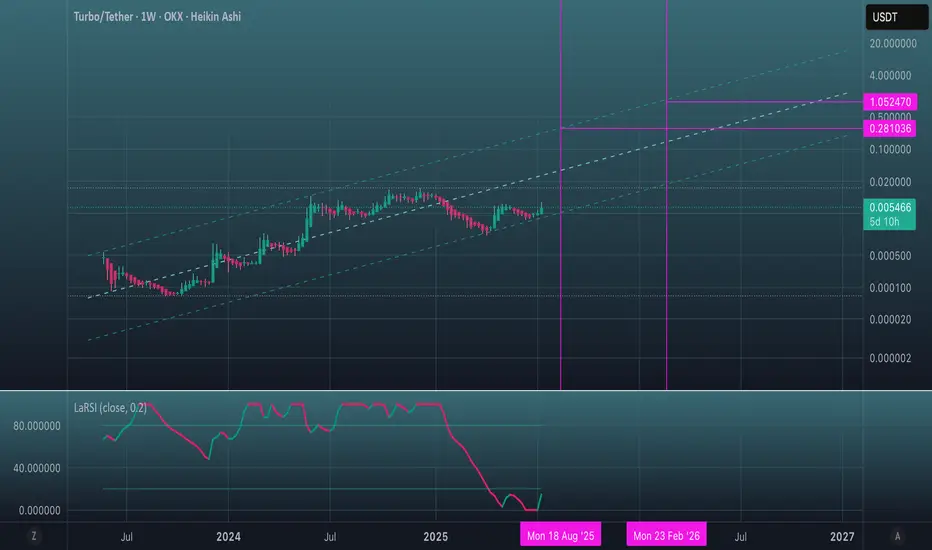
Just a couple of lines.Depending on what waves of liquidity will be pumped from bitcoin to slagcoins,
many things are possible. Faster? Lower price.
Slower? More accumulation, stronger level protection.
LaRSI may be preparing to storm the 20 line on the weekly chart.
Positive.
You may agree or disagree, at your discretion.
Bearich ChoCHWe see fib level 0.7 is respected. at london open. pre market. lets see how this one playsout

GBPJPY - The hunt for liquidity within a bullish trendFX:GBPJPY is testing key areas of interest amid an upward trend as part of a deep correction. Fundamentally, the pound is stronger than the yen...
The Japanese yen continues to decline for economic reasons related to the Bank of Japan. Against this backdrop, the pound is strengthening. Focus on the 211.59 - 212.0 zone, where the battle for position is most likely to take place. If the bulls manage to break through 212, the currency pair could return to an upward trend.
The currency pair is forming a fairly deep correction, but there is no break in the trend structure. A retest of the 0.6-0.7 Fibonacci zone and a retest of the consolidation boundary within the bullish trend have been formed.
Resistance levels: 212.08, 213.01
Support levels: 211.59, 211.31
A false breakout and the market holding above the key support zone could give buyers a chance to resume the uptrend after the correction ends.
Best regards, R. Linda!

ETH - is it time for a correction?ETH is starting to look over-bought.
Price is currently hovering around a strong intersection between the orange supply zone and the upper red trendlines. This is not just any resistance, it’s a zone where momentum has historically cooled off.
As long as this area holds, a bearish correction is expected, with price likely rotating back toward the lower blue trendlines, where buyers previously stepped in.
This doesn’t change the bigger picture... it’s simply a reset within structure.
⚠️ Disclaimer: This is not financial advice. Always do your own research and manage risk properly.
📚 Stick to your trading plan regarding entries, risk, and management.
Good luck! 🍀
All Strategies Are Good; If Managed Properly!
~Richard Nasr

GBPUSD - From Bullish to Bearish, keeping it simpleGBPUSD has shifted gears.
After losing its bullish structure, price is now trading inside a falling red channel, keeping the broader bias bearish.
As GBPUSD retests the upper bound of the falling channel, and that retest lines up perfectly with the orange supply zone. This is a classic area where sellers tend to step back in.
As long as this intersection holds, the plan is simple:
wait for lower timeframe confirmation and look for trend-following short setups, aiming for continuation back toward the lower side of the channel.
⚠️ Disclaimer: This is not financial advice. Always do your own research and manage risk properly.
📚 Stick to your trading plan regarding entries, risk, and management.
Good luck! 🍀
All Strategies Are Good; If Managed Properly!
~Richard Nasr

GBPUSD - Right Into Resistance… Again!GBPUSD is now trading at a very important intersection.
Price is pressing right into the upper red trendline, while also sitting inside the green resistance zone. This is not a random area... it’s a level that has already rejected price multiple times in the past.
From a bigger-picture perspective, the structure remains overall bearish, with price still respecting the descending channel. The recent push higher looks more like a corrective move rather than a true trend reversal.
As long as this trendline + resistance intersection holds, my focus stays clear:
I’ll be looking for trend-following shorts, preferably after lower-timeframe confirmation and signs of bearish control.
Only a strong and clean break above this zone would force a reassessment. Until then, sellers still have the edge.
⚠️ Disclaimer: This is not financial advice. Always do your own research and manage risk properly.
📚 Stick to your trading plan regarding entries, risk, and management.
Good luck! 🍀
All Strategies Are Good; If Managed Properly!
~Richard Nasr

Gold-to-Silver Ratio at 15-Year LowsGold-to-Silver Ratio pulled back sharply after President Trump paused new tariffs on critical minerals. The announcement eased near-term trade risks, leading to profit-taking after record highs above $93/oz. Despite the correction, silver remains up over 25% YTD, supported by robust industrial demand and tight supply.
Policy Context
The U.S. administration’s decision to delay tariffs on critical minerals (including silver, lithium, cobalt, and rare earths) temporarily removes a key policy risk.
Officials are expected to revisit trade agreements within 180 days, potentially introducing price floors instead of blanket tariffs.
This shift reduced short-term volatility — but structural drivers for silver remain unchanged.
Market Fundamentals
Industrial demand remains strong — especially from solar, EV, and electronics sectors.
Mine supply is constrained since silver is mostly a by-product of other metals.
Physical tightness persists after significant stock draws earlier in the year.
The gold/silver ratio near 50 marks the lowest level since 2011, signaling ongoing relative strength.
Overall, the fundamental setup continues to favor long-term accumulation on dips.
Technical Picture
Gold-to-Silver Ratio recently fell below its 200-day moving average, indicating near-term weakness.
Price structure remains bullish above $48–50 — a critical zone of prior support.
The ratio is trending within a descending channel, suggesting silver continues to outperform gold on a relative basis.
Short-term view: Expect range-bound trade between $50–60 as the market stabilizes.
Medium-term view: A sustained breakout above $65 could reopen the path toward previous highs.
Outlook
Volatility will remain elevated as markets digest U.S. trade policy and macro shifts.
However, tight supply, structural deficits, and ongoing industrial demand should cushion downside moves.
The metal’s dual role — part safe haven, part industrial — keeps it sensitive to both policy and growth signals, but the bias remains upward over the longer term.

Bitcoin: Renewed Uptrend?Bitcoin’s recent 4-hour price action suggests the market may be transitioning out of its corrective phase, but the broader Elliott Wave structure remains the primary reference point. Importantly, the macro analysis published on November 20, 2025 remains intact, with price behavior unfolding precisely within the parameters outlined in that original roadmap.
Macro Context: Targets Respected
Since the November publication, Bitcoin has executed a technically clean pullback, finding support squarely within the macro Fibonacci target zone between the 0.618 and 0.786 retracement levels. This region—highlighted months in advance—acted as a decisive reaction area, reinforcing the validity of the higher-timeframe wave count.
The reaction from this zone was not impulsive capitulation, but rather corrective stabilization followed by an initial recovery attempt, consistent with a developing wave (4) rather than a trend reversal. The original macro structure therefore remains not only valid, but technically respected.
(Reference to the November 20 macro roadmap is available in the Related Publications section.)
4H Elliott Wave Update
On the lower timeframe, Bitcoin appears to be forming a base following the macro-level correction, with price attempting to reclaim lost structure. The current advance fits best as the early phase of a developing impulsive sequence, though confirmation is still required.
Key technical observations:
Price is reacting constructively off the macro support zone.
The structure remains overlapping, suggesting transition rather than expansion.
A reclaim of the former channel would materially strengthen the bullish case.
Failure to regain that structure in the near term would imply continued consolidation or a deeper corrective extension, rather than immediate trend continuation.
Risk and Invalidation
Short-term invalidation levels are clearly defined and remain well above the long-term bearish threshold. A break below local invalidation would invalidate the immediate lower-timeframe count, but would still fall within the corrective allowances of the November macro thesis.
Only a decisive violation of the long-term invalidation level would challenge the broader bullish roadmap.
Outlook
Bitcoin is once again at a structural decision point. The successful defense of the 0.618–0.786 macro target zone keeps the larger bullish scenario alive, while the lower timeframe now determines whether the market can transition from correction into trend renewal.
Bottom line:
The roadmap from November remains valid. Bitcoin respected its macro targets with precision—what follows now will determine whether this recovery evolves into a renewed uptrend or remains a pause within a larger corrective phase.

Selena | XAUUSD - Highest Possiblities of Bullish ContinuationFOREXCOM:XAUUSD PEPPERSTONE:XAUUSD
After rejecting from the upper channel resistance, XAUUSD pulled back into a confluence zone consisting of institutional demand and trend support. This corrective move appears corrective rather than distributive, indicating preparation for further upside continuation rather than reversal.
Key Scenarios
✅ Bullish Case 🚀
As long as price holds above the institutional demand zone, bullish continuation remains favored.
🎯 Target 1:4550
🎯 Target 2:4600 Psychological resistance / Fib extension
❌ Bearish Case 📉
A clean breakdown and sustained close below trend support would invalidate the bullish bias and signal deeper correction.
Current Levels to Watch
Resistance 🔴: Psychological zone near highs
Support 🟢: Institutional demand + channel support
⚠️ Disclaimer: This analysis is for educational purposes only. It is not financial advice.

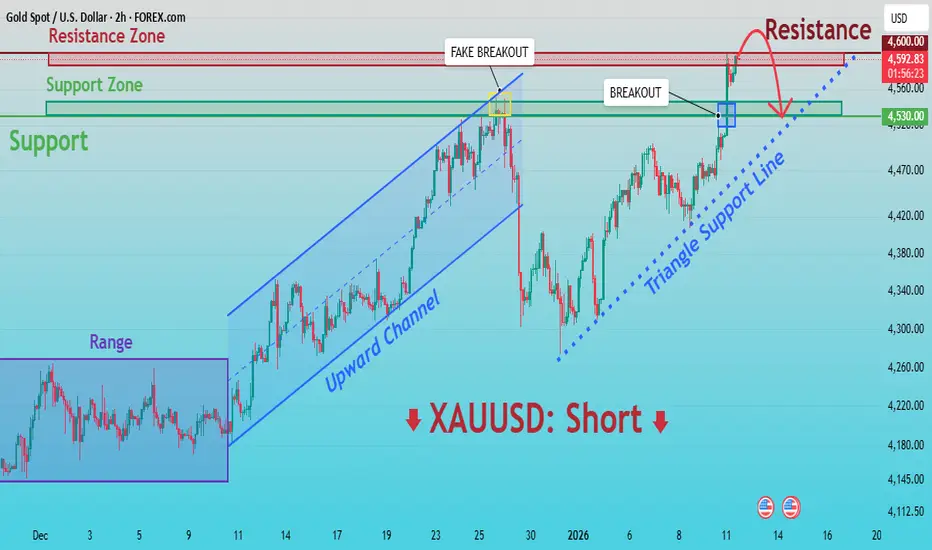
XAUUSD: Critical Supply Zone - Reaction May Define Next MoveHello everyone, here is my breakdown of the current XAUUSD setup.
Market Analysis
Gold is trading within a broader bullish environment, but recent price action shows signs of exhaustion near key resistance. After a period of consolidation inside a clear range, XAUUSD broke to the upside and formed a well-defined upward channel, confirming buyer control. This move brought price into the upper Resistance Zone around 4,590–4,600, where strong selling pressure emerged.
Currently, at this level, price printed a fake breakout, indicating a lack of acceptance above resistance and trapping late buyers. Following this rejection, gold pulled back sharply and then staged a recovery, breaking above the local structure again and retesting the Support Zone near 4,530. This area aligns with previous resistance turned support and a rising triangle support line, which is currently being tested. Despite the bullish recovery, price is once again approaching the major resistance area, where sellers have previously shown strong interest. The market structure suggests that the current move is corrective within a larger resistance context rather than the start of a fresh impulsive rally.
My Scenario & Strategy
My primary scenario favors a short setup while price remains below or reacts strongly from the 4,590–4,600 Resistance Zone. A rejection from this area could trigger a move back toward the 4,530 Support Zone and potentially lower if selling momentum increases.
However, a clean breakout and acceptance above 4,600 would invalidate the short bias and signal bullish continuation. Until that happens, the resistance area remains a key decision point, and caution is warranted near the highs.
That’s the setup I’m watching. Thank you for your attention, and always manage your risk.