BTCUSD Holds Buyer Zone - Push Toward 96,700 LikelyHello traders! Here’s my technical outlook on BTC/USD based on the current market structure. After a prolonged decline, Bitcoin reversed from the Support Level and broke out of the downward channel, shifting momentum in favor of buyers. The price then moved into a consolidation Range, where accumulation formed before a confirmed Breakout pushed BTC higher. Since then, Bitcoin has been respecting the rising Triangle Support Line, forming higher highs and higher lows. Buyers consistently defend this structure, keeping the bullish trend intact despite local corrections. Currently, BTC is holding above the 90,500–88,800 Buyer Zone, which serves as the key demand area maintaining bullish pressure. As long as the price stays above this zone, the upward scenario remains valid. The market is now heading toward the major 96,700 Resistance Level, located inside the broader Seller Zone. A breakout above this level may open the door for further continuation, while rejection could trigger a pullback toward the Triangle Support Line. For now, the structure favors buyers, with 96,700 as the main upside target. Please share this idea with your friends and click Boost 🚀
Parallel Channel

GBPUSD - Consolidation above uptrend support FX:GBPUSD is consolidating above the support of the uptrend. Growth is facilitated by the decline in interest rates in the US.
The dollar has broken the trend and is falling under pressure from falling interest rates. GBPUSD is in an uptrend and testing key support. A long squeeze could trigger growth
The trend is upward, after updating the maximum to 1.3438, a correction is forming, within which MM is testing the break-even and interest zone of 1.3355. If the bulls hold their defense above key support, this action will support the growth of the trend.
Resistance levels: 1.3438
Support levels: 1.3355
Focus on the mirror support zone of 1.3355, which plays a fairly important role in the current uptrend. Consolidation above this zone and local confirmation of the end of the correction could trigger further growth.
Best regards, R. Linda!

Bitcoin falling trendline soon will break and Bulls will lead Bitcoin is currently trading within an ascending channel, encountering resistance near both the channel's upper boundary and a significant historical descending trendline. While this confluence of resistance has prompted a short-term pullback, the overall structure suggests a potential breakout attempt in the near term.
A decisive move above the falling trendline would signal a shift in market structure, likely invalidating the bearish momentum and transitioning the market into either a consolidation range or a renewed bullish phase .
Following a confirmed breakout, the technical setup would support the potential for further upward movement, with progress expected to become more sustained once this key resistance zone is cleared.
So get Ready also other paths mentioned on the chart too what may happen in your view comment below !!
DISCLAIMER: ((trade based on your own decision))
<<press like👍 if you enjoy💚

ETH is targeting 3500$ or 2500$?Wait for breakout here on blue zone or if it hold gain is cooking.
As observed on the chart, Ethereum is testing a critical multi-confluence support zone (marked in blue). The significance of this level is derived from three key technical factors:
Fibonacci Support : It aligns with the 0.5 to 0.618 retracement zone on the 4-hour chart, a common area for trend reversals.
Channel Support : This zone coincides with the lower boundary of the prevailing price channel.
Psychological Support : It reinforces the major round-number support at $3,000.
Scenarios:
Bullish: A sustained hold and bullish reaction from this confluence support could catalyze an upward move toward $3,500 and higher.
Bearish : A decisive breakdown below this zone (as indicated by the bearish projection on your chart) would invalidate the support structure and target a decline toward the $2,450 area.
This zone represents a clear inflection point where the market's next medium-term direction is likely to be determined.
DISCLAIMER: ((trade based on your own decision))
<<press like👍 if you enjoy💚

BCHUSDT Bulls Beware? Price Just Triggered a Classic TrapYello Paradisers! have you noticed how BCHUSDT just tapped into a key resistance right after sweeping liquidity above previous highs? This could be the perfect bull trap, and what comes next might catch many traders off guard if they’re not prepared.
💎BCHUSDT has just taken inducement and is now reacting from a strong resistance zone. Price is currently moving within an ascending channel while also showing clear bearish divergence, a combination that increases the probability of a bearish move. This setup suggests that momentum is weakening despite higher price action, often a red flag for trend continuation.
💎Aggressive traders may already be looking to enter short from current levels. However, the more strategic and safer approach is to wait for another reaction from the resistance zone, ideally accompanied by a clear bearish candlestick pattern. That will give us a much higher probability entry with a more defined invalidation level. If this confirmation comes, we can then look to target the liquidity pools and support zones lying below.
💎That said, if BCHUSDT manages to break and close above the resistance zone with strength, it would completely invalidate our bearish scenario. In that case, it’s best to stay on the sidelines and wait for fresh price action to develop before taking any new trades. Chasing trades without structure is where most traders lose.
🎖Strive for consistency, not quick profits. Treat the market as a businessman, not as a gambler. Stay patient, disciplined, and focused only on high-probability setups, this is the only way you’ll make it long-term in this market.
MyCryptoParadise
iFeel the success🌴

GOLD - Distribution phase. Target - ATH (4380), 4400...FX:XAUUSD is rallying after breaking through consolidation resistance. The fundamental background is positive, with the train heading for an all-time high.
Expectations of a soft Fed policy remain, with the market pricing in two rate cuts in 2026. India's pension fund regulator has allowed investments in gold and silver ETFs. An increase in US unemployment claims (+44,000) has heightened fears of a slowdown in the labor market.
A reversal in the Bank of Japan's policy (rate hike) and a pause by the ECB are boosting the appeal of gold.
Any correction is likely to be short-term and will be met with support from buyers. The baseline scenario remains bullish amid soft monetary policy and a weakening dollar.
Technically, it is dangerous to sell in the current market; it is worth looking for buying opportunities after corrections or pullbacks...
Resistance levels: 4325, 4335, 4380
Support levels: 4300, 4285, 4265
The rally phase is quite aggressive due to the long period of consolidation that the market has been in. All possible factors are supporting growth. In such a market, one can only buy on pullbacks. I expect a pullback from the indicated zone, within which growth to ATH can be considered.
Sincerely, R. Linda!

BITCOIN → Downward trend pressure. 86K - 84K?BINANCE:BTCUSDT.P sold off all the gains associated with Tuesday and Wednesday's news. Technically, a false breakout of resistance is forming against the backdrop of a downtrend. There is no fundamental support.
Bitcoin failed to consolidate above 91800 - 94200, a false breakout was formed, and the price returned to the range. There is an imbalance zone on the chart, which the price may test before falling (weak technical and fundamental background).
The trend is downward in the medium term. A countertrend correction is forming, within which the market is facing pressure in the 94K - 95K zone. Zone of interest is 91850. I expect a retest, liquidity capture, and another phase of selling down to 88K - 86K.
Resistance levels: 91850, 92500
Support levels: 89550, 87980, 86260
The price is in the trading range of 84K - 94K. Resistance has been tested, and a double top reversal pattern has formed. Currently, a distribution phase is forming relative to the specified pattern and consolidation at 91850 - 94200. A retest of the nearest resistance could trigger a rebound and cause the price to fall further to the next zone of interest.
Best regards, R. Linda!

Ascending Channel | Golden Zone Retracement SetupAfter analyzing the chart on the 2-hour timeframe, price action has been moving within a well-defined ascending channel since Tuesday, 25 November 2025. The upper boundary of the channel has been consistently respected, confirming the strength and validity of this bullish structure.
Following a rejection from the upper boundary, price is currently trading around 1.17403. At this stage, the market appears to be developing a bearish corrective structure, resembling either an upper flag formation or a falling broadening wedge, which is still in progress and not yet completed.
Based on this structure and overall market behavior, we anticipate a potential retracement toward the Fibonacci Golden Zone, which aligns with our projected price target. This area may act as a key decision zone for the next directional move, especially if supported by price action confirmation and volume reaction.
Traders should monitor price behavior closely around the channel boundaries and Fibonacci levels for high-probability setups.
Happy Trading
SpicyPips

Breakout and Retest13-12-2025
1211 is retesting breakout zone near 57.7
aligned with Fib golden pocket
hidden bullish divergence can be seen
price is respecting EMA 89
good to enter with SL 57 or watch for descending channel breakout
it can hit 65, 67.5. Long term it can hit 75/79
# this is not a financial / investment advice. Only meant for tracking technical analysis

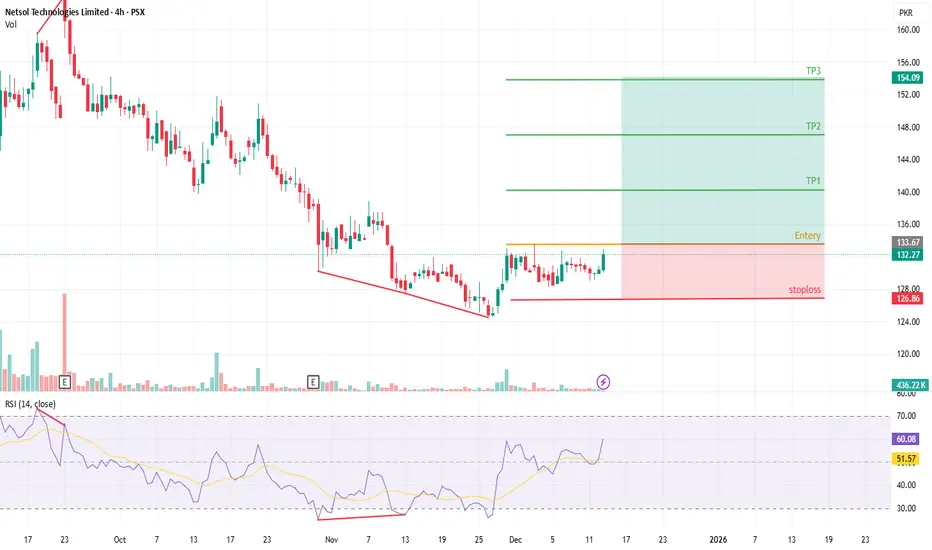
NETSOL – Bullish Reversal Setup! 1:3 Risk/Reward Play Awaits VolNetSol Technologies (NETSOL) is forming a bullish reversal pattern on 4H — and the reward potential is huge!
Entry zone: 133.67 - 135.67
TP1: 140.35
TP2: 146.93
TP3: 154.09 (+17% upside)
Risk/Reward = 1:3 — exceptional for swing trade
Key Condition: Wait for high volume on breakout or retest — no chase without confirmation!
Disclaimer:
This idea is intended for educational and research purposes, based on technical patterns. It is not investment advice. Always conduct your own analysis (DYOR) and manage your risk carefully before entering any trade.
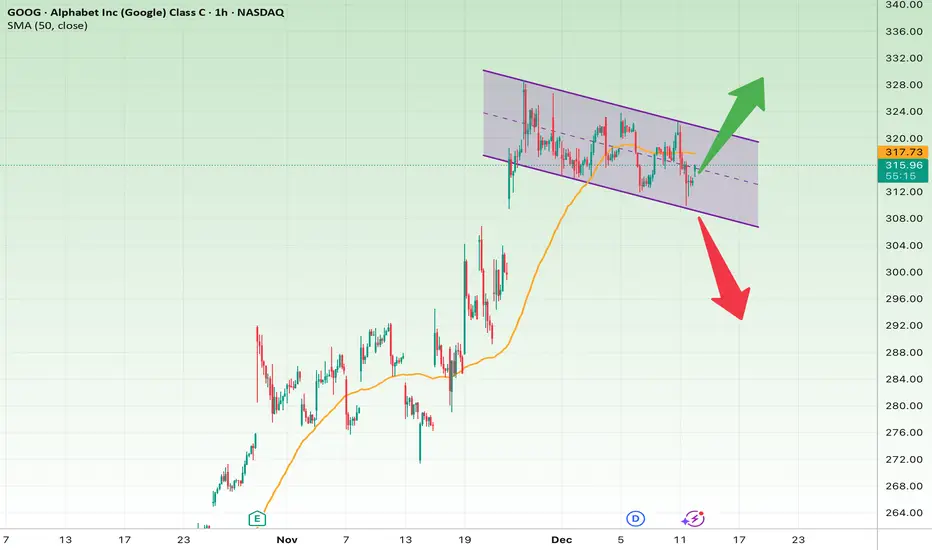
Technical Analysis of GOOG (1H Timeframe)The price is currently oscillating inside a short-term descending channel. Multiple touches on both the upper and lower boundaries increase the pattern’s reliability. The SMA50 is positioned slightly above the price and is acting as resistance for now.
This structure suggests that the market is trapped between two scenarios and is likely to experience a breakout or breakdown soon.
Bullish Scenario
If the price breaks above the channel resistance (around 319–320) and closes a confirming candle above it:
Targets
• Target 1 → 323
• Target 2 → 327–328 (full channel breakout)
• Target 3 → 332
Stop-Loss
• A close below 313
Bullish Reasons
• EMA/SMA are beginning to flatten and may shift back upward
• Price action at the channel bottom signals active demand
• A bullish reversal pattern often forms after a short-term descending channel
Bearish Scenario
If the price breaks below the channel support at 310:
Targets
• Target 1 → 304–305
• Target 2 → 298–300
• Target 3 → 292
Stop-Loss
• A close back above 316–317
Bearish Reasons
• The MA50 is currently acting as resistance
• The descending channel has strong validity
• Multiple rejections at the channel top
Quick Summary
• GOOG is compressed inside a short-term descending channel.
• Break above 320 → continuation of the bullish move.
• Break below 310 → deeper correction likely.
• For now, the market is in a neutral to slightly bearish stance.
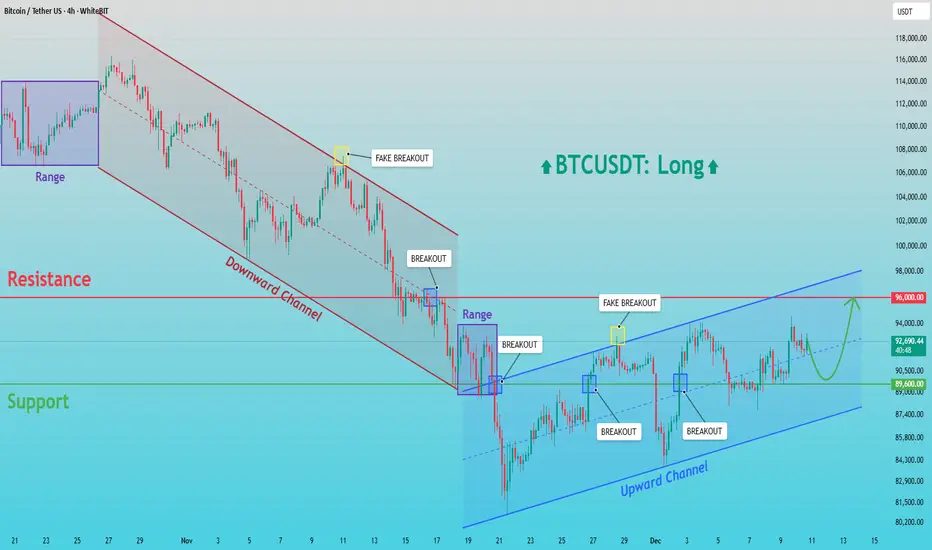
BTCUSDT: Buyers Regain Control — $96,000 in FocusHello everyone, here is my breakdown of the current BTCUSDT setup.
Market Analysis
Bitcoin is transitioning from a broader bearish phase into a developing bullish structure. After a prolonged decline inside a well-defined downward channel, BTC formed a base near the $89,600 support zone, where strong buyer interest appeared. Multiple breakouts and fake breakouts around this level confirmed accumulation and growing bullish pressure. Following this reversal, price broke out of the bearish channel and entered a new ascending channel, forming higher highs and higher lows.
Currently, BTCUSDT is consolidating inside this upward structure and trading below the key $96,000 resistance, which remains the major obstacle for buyers. Several false breakouts near this resistance indicate that sellers are still active in this area. However, as long as price holds above the $89,600 support, the bullish structure remains valid and buyers stay in control.
My Scenario & Strategy
My scenario is bullish as long as BTCUSDT stays above the $89,600 support zone and continues to respect the ascending channel structure. I expect the price to gradually build momentum and attempt a retest of the $96,000 resistance. A clean and confident breakout above this level would confirm further upside continuation and open the way for higher targets.
However, if the price fails to break $96,000 and shows strong rejection, a short-term pullback toward the lower channel support may occur. For now, the market favors buyers, with $96,000 as the key upside objective.
That's the setup I'm tracking. Thank you for your attention, and always manage your risk.
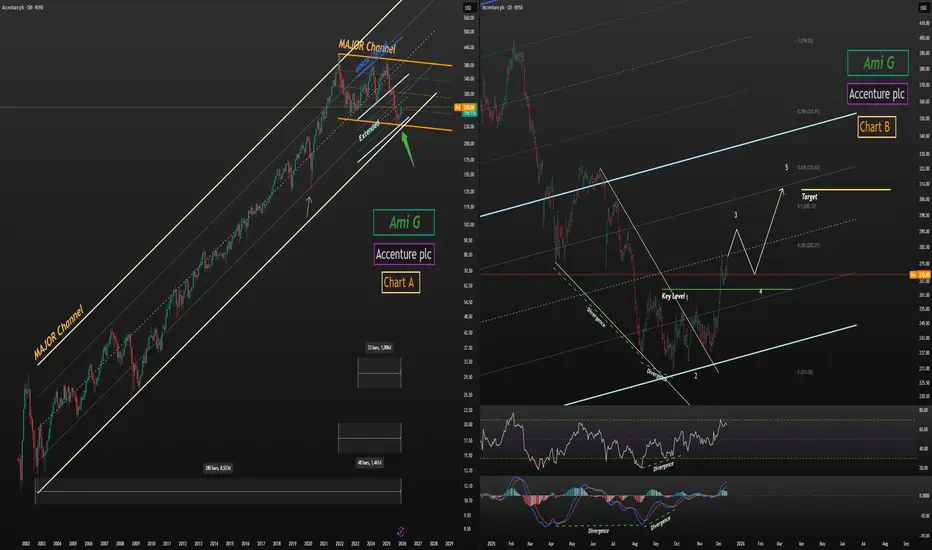
Accenture plc ACN Multi Timeframe Channel AnalysisAccenture plc (ACN) Multi Timeframe Channel Analysis
1. Long-Term Structure
This analysis is built on three major structural channels:
24-year channel
5-year channel
3-year extended channel
Price is currently positioned at a rare triple confluence zone, touching:
The bottom of the 24-year channel
The bottom of the 5-year channel
The extended lower boundary of the 3-year channel
This alignment significantly strengthens the probability of a medium-term bullish reversal.
2. Reversal Signals
At the channel confluence, price completed a clean Ending Diagonal pattern and reacted strongly, showing:
Powerful bullish divergences on momentum indicators
A decisive breakout from the diagonal structure
These signals collectively confirm a strong demand zone and a potential macro reversal.
3. Wave Count and Bullish Scenario
Following the breakout, price has started to build a five-wave impulsive structure.
After breaking its key level, ACN is now positioned in wave 3 of 3, which is typically the strongest part of the move.
Minimum upside target:
310
This level aligns with structural resistance and wave projections.
4. Final Notes
This is my personal analysis I’d be glad to hear your views.
For more detailed breakdowns and live swing trades on stocks, feel free to follow me on TradingView.
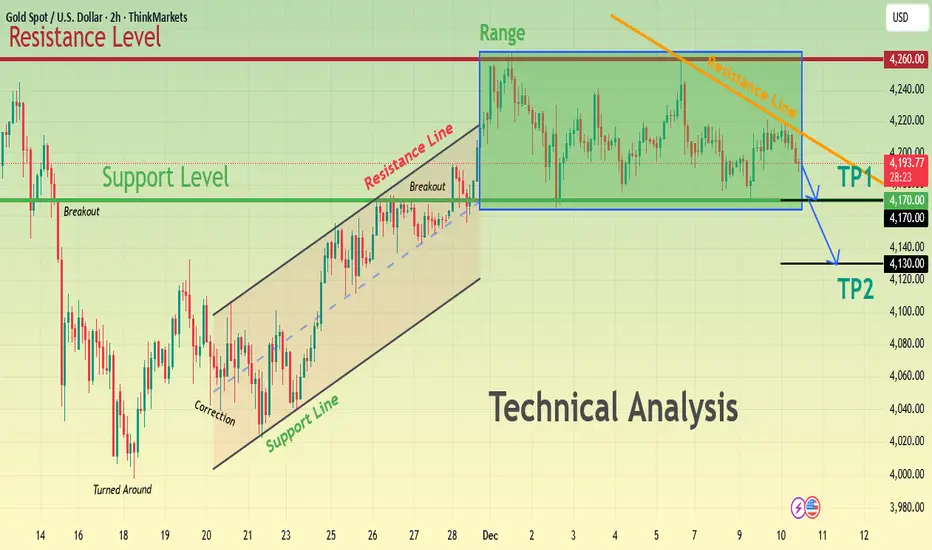
XAUUSD Range Resistance Holds — Pullback Toward $4,170 in FocusHello, traders! Here’s my technical outlook on GOLD (XAUUSD) based on the current market structure visible on the chart. After a strong rebound from the previous lower demand area, price moved into a steady ascending structure, respecting the rising Support Line and forming higher highs and higher lows. This bullish impulse later transitioned into a corrective consolidation, where Gold entered a well-defined range below the major 4,260 resistance level. The repeated rejection from this resistance confirms strong selling pressure at the top of the range, while buyers continue to defend the 4,170 support level, keeping price compressed between these key boundaries.Currently, XAUUSD is trading inside this consolidation box, while also respecting the descending short-term resistance line from the recent swing highs. The market previously broke out from the bullish channel and is now showing signs of weakness beneath the upper boundary of the range, suggesting that upside momentum is fading. As long as price remains capped below 4,260, the risk of a deeper corrective move remains elevated.My primary scenario is bearish as long as Gold stays below the 4,260 resistance and continues to respect the descending resistance line. I expect price to gradually move lower toward the TP1 target at 4,170, which is the first key support inside the structure. If selling pressure accelerates and this level fails to hold, the next downside objective stands at TP2 around 4,120, where stronger demand could emerge. A clear breakdown below TP1 would confirm bearish continuation. However, if price reclaims 4,260 with strong momentum, this bearish setup would be invalidated and the bullish trend could resume. For now, the structure favors a corrective pullback toward 4,170–4,120. Please share this idea with your friends and click Boost 🚀
EURJPY: Another Bullish Confirmation
EURJPY violated a resistance of a horizontal bullish flag
pattern on a 4H time frame.
It provides a strong intraday bullish confirmation.
I expect a rise at least to 183.1 level.

GOLD → Positive fundamental background. Focus on 4200 FX:XAUUSD is testing the $4,250 level amid news momentum related to interest rate cuts. The fundamental backdrop is improving, with the dollar entering a downward trend...
The Fed cut rates by 25 basis points to 3.75%, as expected. Powell's tone was cautious rather than hawkish, which weakened the dollar and Treasury yields. The market expects two rate cuts next year, compared to one in the Fed's forecasts
- Focus has shifted to US employment data (jobless claims). The next key risk will be next week's NFP data.
The Fed's decision provided support for gold, but for growth above $4250, confirmation of a weakening labor market in upcoming reports will be needed. Technically, the focus is on the 4200-4220 zone.
Resistance levels: 4220, 4250, 4260
Support levels: 4200, 4180, 4175
Consolidation above 4200 will confirm the bullish sentiment, while a breakout and consolidation above 4220 will open up a new chance for growth towards the resistance of the range.
I do not rule out the possibility of a retest the support of the range at 4181 before moving up (the price is still in a sideways trend).
Best regards, R. Linda!

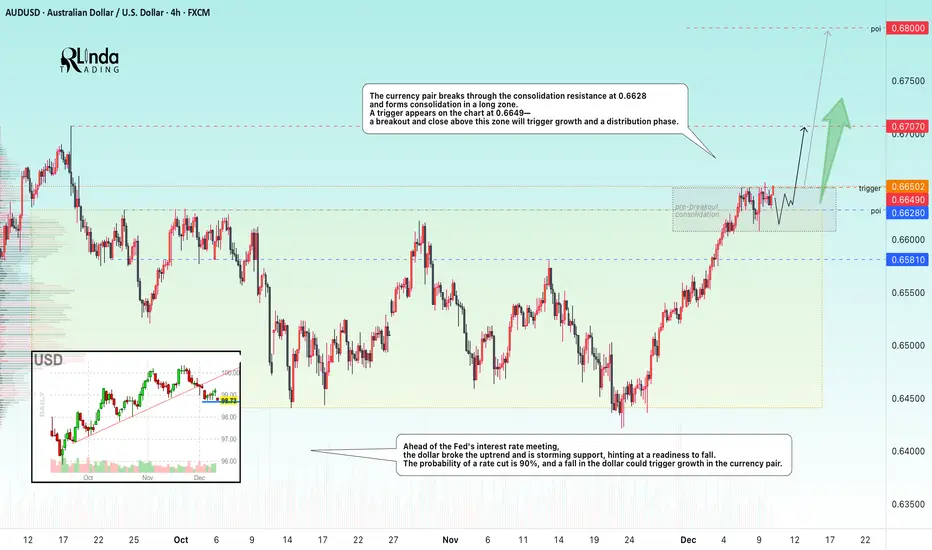
AUDUSD → Readiness for distribution within the uptrend FX:AUDUSD breaks through the resistance of a wide trading range (consolidation) and is preparing for growth. Important news ahead...
Ahead of the Fed's interest rate meeting, the dollar broke its upward trend and is storming support, hinting at a readiness to fall. The probability of a rate cut is 90%, and a fall in the dollar could trigger growth in the currency pair.
The currency pair is breaking through the consolidation resistance at 0.6628 and forming consolidation in a long zone. A trigger of 0.6649 appears on the chart - a breakout and close above this zone will trigger growth and a distribution phase.
Resistance levels: 0.6649, 0.67, 0.68
Support levels: 0.6628, 0.6581
Before rising, the price may test support (the previously broken trading range boundary). However, a breakout and close above 0.6649 could trigger a distribution phase towards 0.67-0.68, especially against the backdrop of a weak dollar...
Best regards, R. Linda!
ETH Broke Parallel Daily Channel - Retracement Complete?BINANCE:ETHUSDT has finally broken out of a bearish parallel channel after trading in it for over 2 months! ETH found support at the 0.618 fib level from the April low, which saw price surging from $1400 to $4900.
It will be interesting to see how long the current bullish rally continues for, since this could very well be the low before we start testing the all time highs of $5000!

Weekly support zone can pump DOGE above 0.15$ soonAs observed on the chart, DOGE is consolidating within a range near two key weekly support levels: $0.13 and $0.09. The price is currently holding firmly at the higher support zone ($0.13), indicating potential accumulation.
The first confirmed signal for a bullish reversal would be a decisive breakout above the $0.15 resistance level, ideally accompanied by rising volume. Such a breakout would likely shift market structure in favor of the bulls and could initiate a new upward cycle. Based on the depth of the current range, measured move projections suggest a potential upside of 2x to 3x from the breakout zone, provided momentum and buying pressure are sustained.
DISCLAIMER: ((trade based on your own decision))
<<press like👍 if you enjoy💚

Apple to NVIDIAApple vs. NVIDIA Chart Analysis
Does anyone know something we don’t? This chart compares Apple to NVIDIA.
As you can see, Apple relative to NVIDIA has completed a clear five-wave structure within a descending channel.
Price has now reached the end of wave 5 at the bottom of its 11-year channel, showing a very sharp reaction along with strong divergences in both RSI and MACD on the monthly and weekly timeframes.
Based on this, price appears highly likely to rise, potentially reaching at least the channel’s upper boundary.
Potential Scenarios
This chart outlines four possible scenarios:
1.Both stocks rise, but Apple outperforms NVIDIA.
2.Both stocks decline, but Apple’s drop is more limited.
3.NVIDIA declines, but Apple rises.
4.NVIDIA consolidates, while Apple rises.
The trigger comes from RSI, which, considering the lower timeframe divergence on Chart B, provides reasonable reliability.
For additional confirmation, one can wait for a key line breakout.
Final Notes
This is my personal analysis. I’d be glad to hear your thoughts.
Follow me on TradingView to access more in-depth analyses and live stock trades.

EURUSD Short: Correction Deepens — Market Targets at 1.1590Hello, traders! The current EURUSD price action shows a well-structured reaction between the Supply and Demand zones, with price respecting key levels and channel formations. Earlier, the market traded inside a Range phase, signaling indecision before breaking the range to the upside and forming a clean bullish leg. However, this upward move was capped by the major Supply Zone near 1.16800, where sellers stepped in and pushed price lower. After the rejection from supply, EURUSD broke below the ascending channel, confirming a shift in short-term momentum. The pair then retested the mid-structure area, where another breakout occurred, indicating sustained bearish pressure. With each channel break, sellers strengthened their control, creating a series of lower highs within a corrective structure.
Currently, EURUSD is trading below the most recent ascending channel, aiming toward the 1.15900 Demand Zone, which remains the key area where buyers previously generated strong bullish impulses. This level aligns with the next major liquidity pool and stands as the primary downside target.
My scenario as long as price stays below 1.16800 supply and continues respecting the bearish breakout structure, the expectation is for the market to move lower toward 1.15900 Demand. A clear reaction from demand could initiate a bullish corrective move, but without a confirmed breakout above supply, any upside remains limited. A firm break below 1.15900 would invalidate potential reversal scenarios and open the path for deeper downside continuation. Manage your risk!

XAUUSD Long: Demand Holds — Price Aiming for $4,260 RetestHello, traders! The current price action on GOLD (XAUUSD) is developing within a clearly defined ascending channel, showing that the broader bullish structure remains intact despite recent corrective movements. Earlier, the market formed a Double Top pattern near the upper Supply Zone around $4,260, which triggered a bearish reaction and a downside breakout from that distribution phase. After this rejection, price moved into a corrective decline, respecting the Triangle Supply and Demand lines, where multiple breakouts confirmed increasing volatility and active participation from both buyers and sellers. Following the corrective phase, Gold reached a key Pivot Point near the lower Triangle Demand Line, where strong buying interest appeared and initiated a bullish reversal. From this base, price broke back above resistance and entered the current Ascending Channel, forming higher highs and higher lows.
Currently, XAUUSD is consolidating near the $4,190–$4,200 Demand Zone, where buyers are actively defending the structure. The market is holding above channel support, suggesting that bullish momentum is stabilizing after the pullback.
My scenario remains bullish as long as price stays above the highlighted Demand Zone around $4,180–$4,190 and continues to respect the lower boundary of the ascending channel. I expect Gold to gradually build momentum and attempt another move toward the $4,260 Resistance level, which represents the next major target and the top of the recent supply area. A confident breakout above this zone would signal trend continuation and open the door for further upside. However, a failure to hold current demand could trigger a deeper correction back toward the lower channel area. For now, the structure favors buyers, with $4,260 as the main upside objective. Manage your risk!

Dollar Index at Critical Support — Is a Big USD Rally Coming?Today I want to analyze the DXY index( TVC:DXY ) for you, which is one of the key indices in the financial markets.
At the moment, the DXY index is moving near a support zone($98.85-$98.50), Monthly Support (1) level, and the 21_SMA(Weekly).
In addition, the DXY has been trending inside a descending channel for roughly the past 13 trading days.
The main question is whether the DXY can break below this confluence of support levels or not.
Looking at the 4-hour chart, we can identify a Morning Star candlestick reversal pattern, and there is also a clear bullish Regular Divergence (RD+) between the last two lows.
Moreover, the US 10-Year Government Bond Yield ( TVC:US10 ) appears bullish in my view — and its upward movement can potentially support a rise in the DXY as well.
From my perspective, the best currency pairs to capitalize on a stronger USD are USDJPY( FX:USDJPY ) and EURUSD( FX:EURUSD ).
We should also keep in mind that several important US economic indicators will be released this week, which could significantly impact market direction. So be extra cautious with your positions, especially during data releases:
JOLTS Job Openings➡️09 December
Federal Funds Rate➡️10 December
FOMC Statement➡️10 December
FOMC Press Conference➡️10 December
Unemployment Claims➡️11 December
I expect that once the DXY breaks above the upper line of the descending channel, it could at least move toward one of the higher Fibonacci levels.
Do you think the U.S. interest rate will be cut this week?
💡 Please respect each other's opinions and express agreement or disagreement politely.
📌U.S. Dollar index Analysis (DXYUSD), 4-hour time frame.
🛑 Always set a Stop Loss(SL) for every position you open.
✅ This is just my idea; I’d love to see your thoughts too!
🔥 If you find it helpful, please BOOST this post and share it with your friends.
