EURUSD Rejected From Resistance — Pullback Toward 1.1560 in PlayHello traders! Let’s analyze the current EURUSD market structure. EURUSD continues to move within a broad descending channel, where both the Resistance Line and the Support Line have been respected multiple times, confirming a well-defined bearish market structure. Throughout the past sessions, price formed several Range phases near key levels, followed by Breakouts that maintained the overall downward momentum. Recently, EURUSD approached the upper boundary of the channel and reacted strongly from the major Resistance Level near 1.16600, which overlaps with the Seller Zone. This area has triggered multiple Turned Around movements in the past, reinforcing its importance as a supply region where sellers consistently regain control. After rejecting this resistance, price started a downward move toward the mid-range structure. The pair is now approaching the Buyer Zone around 1.15500–1.15600, which aligns with both the local support area and previous Range accumulation. This zone has historically served as a strong reaction level, where short-term bullish corrections often began. As long as EURUSD remains below the descending channel’s resistance and fails to break above the Seller Zone, the bearish structure remains intact. A continuation toward TP1: 1.15600 is the most likely scenario in the short term, especially if sellers maintain momentum below the 1.16200 area. A clean break below the Buyer Zone could open the door for a deeper decline toward the Support Line at the bottom of the channel. On the other hand, a confirmed breakout above the 1.16600 Resistance Level would invalidate the current bearish view and potentially shift the trend toward recovery. Please share this idea with your friends and click Boost 🚀
Parallel Channel

GBPAUD: volume Profile and Static levelsHello everyone!
This is the daily chart!
As you can see, there 2 channels here. One bearish and the other one is bullish. In coincide of two supports of them we see a strong previous S&R!
V.P of October is out strong resistance! We see a great momentum after it. There is middle of the bearish channel around too.
If we see a weak upward move, we can enter a short trade around the volume profile POC.
The TP is just over the static support and around the dynamic support.
You can also buy from support if we see a weakness in bears.

GBPCHF → Countertrend correction. Retest of resistance FX:GBPCHF is testing key resistance at 1.0515 as part of a countertrend correction. Bears are behaving quite aggressively in the current market...
The global trend is downward. After retesting the local bottom, the currency pair is forming a correction to the previously broken consolidation border.
The key area of interest is 1.0515, and bears are trying to hold it. The battle for the zone has been going on for several hours. In extreme cases, a retest of 1.054 is possible before a decline.
A false breakout of resistance (consolidation border) is forming as part of a countertrend movement...
Resistance levels: 1.0515, 1.0542
Support levels: 1.0486, 1.0443
If the bears keep the price below 1.0515, completing the reversal pattern, this could trigger a further decline. Otherwise, the currency pair may form a short squeeze and test 1.0542 before declining...
Best regards, R. Linda!

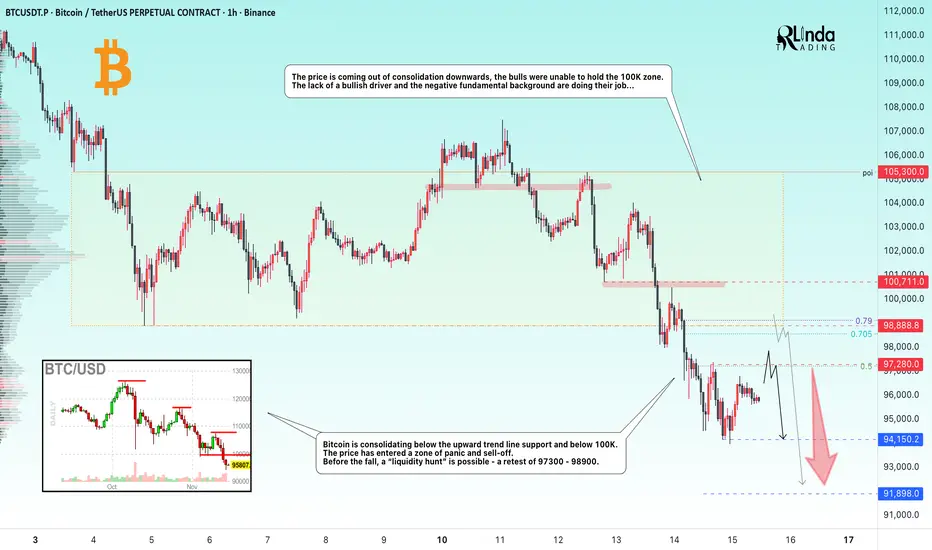
BITCOIN → 100K broken. Consolidation in the short zone...BINANCE:BTCUSDT.P broke through the 100K support level and is consolidating within the local range of 94,150 - 97,280. The decline may continue if the market does not receive support (news or other bullish drivers).
Bitcoin is consolidating below the upward trend line of support and below 100K. The price has entered a zone of panic and sell-off. Before the fall, a “liquidity hunt” is possible - a retest of 97300 - 98900.
The price is coming out of consolidation downwards, the bulls were unable to hold the 100K zone. The lack of a bullish driver and the negative fundamental background are doing their job...
Resistance levels: 97280, 98900, 100700
Support levels: 94150, 91900
Before further decline, the market may test the previously broken support zone relative to the upward lower trend line. Focus on the 97280 - 98990 zone. A false breakout and lack of bullish momentum could form a reversal pattern and trigger a decline to 94150 - 91900.
Best regards, R. Linda!


PLTR Technical Analysis (Daily Chart)In your chart, PLTR is trading inside a well-defined ascending channel.
Right now, the price is sitting exactly on the lower boundary of the channel, close to the 50-day moving average (SMA50) — a major decision zone.
This area typically determines whether the market will:
Bounce toward the top of the channel,
or
Break down into a deeper correction.
Bullish Scenario (Bounce from channel support)
If PLTR holds support around $165–170 and prints a bullish reversal candle:
Upside Targets
1. $185 – first resistance / SMA50
2. $205 – mid-channel resistance
3. $225–230 – top of the ascending channel
Bullish Stop-Loss
Below $158
(A confirmed breakdown of the channel support)
Bearish Scenario (Breakdown below channel)
If the price closes below $158, the ascending channel breaks and a broader correction begins.
Downside Targets
1. $145 – first major support
2. $125 – next historical support
3. $105–110 – deeper correction / long-term support
Bearish Stop-Loss
Above $172
(In case of a failed breakdown and retest)
Quick Summary
• PLTR is at a major inflection point.
• As long as the channel bottom holds, the trend remains bullish.
• A confirmed breakdown = start of a larger correction.

XAUUSD or Gold ViewThe chart shared illustrates as per Elliott Wave analysis Here’s a breakdown of what’s shown:
🧩 Elliott Wave Count
Check the Chart its clearly mentioned
A potential reversal area where buyers could step in mentioned in the chart.
Always follow Price-Action
⚠️ Disclaimer
This analysis is published here is for educational and informational purposes only. It does not constitute financial advice, investment recommendation, or a solicitation to buy or sell any financial instrument. All ideas and analyses shared here reflect the author’s personal opinions and are not endorsed by TradingView. Trading and investing carry significant risk of loss and may not be suitable for all investors. Always do your own research and consult a licensed financial advisor before making any trading decisions. The author and TradingView are not responsible for any losses arising from the use of this information.


GOLD → Retest 4050 in a weak market...FX:XAUUSD is bouncing off support at 4000 and forming a correction towards 4050, an important resistance level. The market's main focus is on the September employment report (NFP), which will be released on Thursday.
Key pressure factors:
The strong dollar is supported by hawkish statements from the Fed and risk aversion. The probability of a rate cut in December has fallen to 42%.
Support for gold: Demand for government bonds has lowered the yield on 10-year Treasuries, allowing gold to rebound to $4045.
A series of negative labor market reports keeps risks alive.
Gold remains under pressure. A break below $4000 will open the way to $3950, while a rise above $4050 will require weak NFP data or dovish Fed rhetoric. The week will determine the direction
Resistance levels: 4050, 4090
Support levels: 4000, 3965
The market is beginning to doubt the local bullish structure. Strong trend support is breaking down and the previously broken level is being retested. If the bears keep the price below 4045-4050, gold could continue to decline. However, it is worth keeping an eye on the news in the second half of this week...
Best regards, R. Linda!

BTCUSD Long: Short-Term Correction Eyes $97,500 ResistanceHello traders! BTCUSD continues to trade within a well-defined descending channel, maintaining a broader bearish structure while forming a series of lower highs and lower lows. Throughout the move, the price has created multiple pivot points along both the upper and lower channel boundaries, confirming the strength of this trend. Inside the channel, Bitcoin developed two notable range phases, each reflecting temporary consolidation before continuing downward. A key formation on the chart is the Rounding Top Pattern, which developed near the mid-channel area. This structure signaled weakening bullish pressure and preceded a sharp decline back toward the channel’s lower boundary. After the breakdown, BTC attempted a small recovery, but price failed at the Supply Zone, creating a rejection that aligned with a bearish breakout confirmation.
Currently, the price is approaching the $97,500 short-term target, which sits close to the lower edge of the Supply Zone. This level has acted as a significant reaction area several times, and the market may retest it before deciding the next direction. As long as BTC trades within the descending channel, the broader trend remains bearish, but short-term corrective moves to the upside are possible due to the strong reaction from demand.
My scenario as long as BTCUSD holds above the Demand Zone ($94,000–$94,500) and shows continued strength, a corrective move toward $97,500 remains likely. This level represents the nearest resistance and aligns with previous supply reactions. A clean breakout above $97,500 would open the way for a deeper correction toward the channel’s mid-line or even the upper boundary. However, if price gets rejected at the supply zone again, sellers may regain control and attempt another push back toward the demand area. A confirmed break below the Demand Zone would invalidate the bullish recovery setup and could trigger continuation of the broader downtrend. For now, the structure supports short-term bullish correction, but overall trend remains bearish until the descending channel is broken. Manage your risk!

BTCUSD: Buyers Aiming for a Move Toward 99,000 ResistanceHello everyone, here is my breakdown of the current Bitcoin setup.
Market Analysis
BTCUSD has recently completed a strong downward phase inside a well-defined Downward Channel, where price continuously formed lower highs and lower lows. After reaching the Support Zone around $94,500–$95,200, buyers stepped in and created a fake breakout, followed by a quick recovery — a sign of weakening seller pressure. Following this rebound, Bitcoin formed an Inverse Head and Shoulders pattern, confirming a potential bullish reversal. Price has now broken above the Triangle Resistance Line, signaling the first structural shift from bearish to bullish.
Currently, BTCUSD is consolidating just above the $95,500–$96,000 support zone, which now acts as a retest area for the breakout. As long as BTC stays above the Triangle Support Line, bullish momentum remains intact, and the market structure favors further upward movement. The nearest target for buyers is the $99,000 Resistance Zone, which previously acted as a strong supply area. A successful breakout above $99,000 would confirm bullish continuation and open the way toward higher resistance levels. If price fails to hold above support, a short-term pullback toward the lower triangle boundary may occur before buyers try to regain control.
My Scenario & Strategy
I expect BTCUSD to maintain its bullish bias as long as price trades above the Triangle Support Line and the key support zone. Potential long entries remain valid on retests of the $95,500–$96,000 area, with a primary target at the $99,000 Resistance Zone (TP1).
A confirmed breakout above $99,000 would strengthen bullish momentum and open the next leg upward. However, a breakdown below the triangle structure may lead to a deeper correction toward $94,500. For now, sentiment remains bullish, and Bitcoin appears ready for a continued recovery within the new reversal structure.
That's the setup I'm tracking. Thank you for your attention, and always manage your risk.

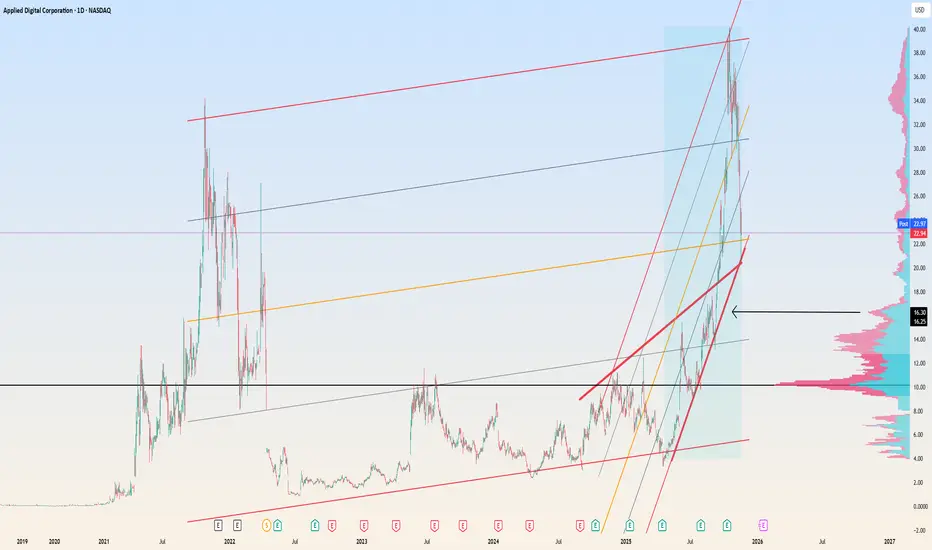
Time to Buy APLD between 22 and 1622 looks perfect from every possible way. 50% of LT channel, intersection two rising trendlines. hope it doesn't break down from 22 then we looking at 16 where first major volume comes in
Patterns and colors - Moving averages, fib channel, parallels BTC at recent ATHs was unable to break through key upper resistance in Sept-Oct from a parallel channel originating from the 2018 bull top and the 2023 lows. It is about to test the mid point of that parallel channel which happens to coincide with the 100day moving average (100M/red line).
Traditionally price trends upward finding support at the 50M during a bull market. Once price confirms below the 50M, history shows price will descend towards or even test the 100M (red, start of bull trap) followed by significant bounce up to the upside (yellow circle- 20M drops below 50M, completing the bull trap), quickly followed by a flush to the down side (capitulation).
If this plays out again, price is likely to retest lower fib parallels and hover around the 200M. Note* - each time the 200M bottom is reached, a new lower fib channel is introduced and price is extended further along the x-axis, whether that plays out this time remains to be seen.
A caveat in this setup is that typically the percentage change from red circle to yellow circle, the bull trap, is ~45-60% which would put price back at ATHs? In this model the bull trap, from red to yellow circle would roughly be a 20-30% correction to the upside before ultimately flusing to the downside. To negate this previous pattern setup I'm assuming this longer bull run is likely exhausted after 3 notable pumps/bull flags since the 2022-2023 200M accumulation and is likely due for a larger pull back.
However if more free money is introduced to the system (stimulus checks, lower interest rates, etc) then all bets are off, or rather, reevaluated.
Yellow - 20M tends to cross below 50M (green) at height of bull trap, bull market if above 50M
Green - 50M provides support in bull market, if price goes below, start of bull trap the retest
Red - 100M last warning to sell if price crosses below, or buy if price crosses above
Blue - 200M always accumulate here

GOLD → Consolidation while awaiting the driverFX:XAUUSD is consolidating after a sharp decline. Bulls are consolidating above 4050. Important US data is ahead, including the employment report (NFP) on Thursday.
Decrease in bets on Fed easing: The probability of a cut in December has fallen to 46% (from 67% a week ago) after cautious statements by Fed officials. However, we have not yet seen inflation and employment data, so the situation may change... The September NFP report will be released on Thursday after a 43-day hiatus.
The market is waiting for clarity from the US data. Weak indicators (NFP, inflation) could bring back interest in gold, while strong data would strengthen the dollar and reinforce the correction.
Gold is in the $4030–4100 range. A break above $4100 will require weak US data or unexpectedly dovish rhetoric from the Fed. The $4030–4045 level is key support.
Resistance levels: 4097, 4110
Support levels: 4071, 4046, 4032
I think the market may remain in the current range while awaiting economic data or other drivers. A correction to support may form from resistance. It is important to monitor the levels from below; if the bulls keep the price above support during the correction, gold will be able to strengthen...
Best regards, R. Linda!

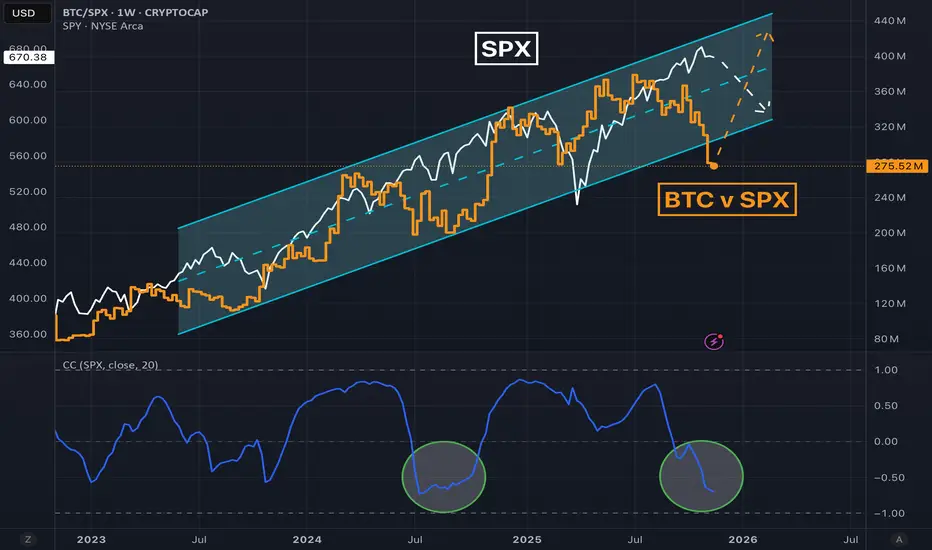
Upcoming rotation from big tech to crypto?Tech SP:SPX and crypto CRYPTOCAP:BTC have been tightly correlated despite suggestions that crypto is a hedge. Therefore it's surprising to see the relative outperformance in tech this year.
In fact, Bitcoin has just gone negative on the year, while the stock market is up double digits again after a sharp April drawdown.
History suggests that crypto / stock relationship should return to a tight correlation, but how do we get there? Will stocks hold and crypto appreciate? Will crypto hold and stocks depreciate?
I think crypto could dig in around current levels, but there's a very good chance I'm mental lol!
EURUSD Long: Buyers Targeting a Move Toward 1.1670 ResistanceHello traders! EURUSD is maintaining a bullish structure after rebounding from the Demand Zone at 1.1600–1.1610, where buyers consistently stepped in to defend support. This area also aligns with the Demand Line of the ascending channel, making it a key decision point for the current uptrend. Earlier, the pair formed a Rounding Top near the 1.1650–1.1670 Supply Zone, which triggered a downside breakout and a short-term correction. Once price reached the pivot point around 1.1530, buyers regained control and initiated a steady recovery, forming a clean ascending channel.
Currently, EURUSD is approaching the Supply Zone at 1.1650–1.1670, which also aligns with the Supply Line of the channel — creating a strong confluence resistance area. A breakout above this zone would confirm bullish continuation toward the next major liquidity cluster. As long as the pair holds above the Demand Line, the bullish structure remains intact. A minor pullback toward the 1.1610–1.1620 Demand Zone would be considered a healthy correction within the trend.
My scenario as long as EURUSD stays above 1.1600–1.1610, buyers remain in control and the bullish channel is valid. The primary upside target is 1.1670, which serves as both a Supply Zone and a key structural resistance. A confirmed breakout above 1.1670 would signal continuation toward higher levels and mark a shift into a stronger bullish phase. If the pair rejects the Supply Zone, a pullback toward 1.1620–1.1600 is likely, where buyers may re-enter. A break below 1.1600 would weaken the bullish outlook and open the path toward deeper correction. For now, the market favors buying pullbacks while holding above demand. Manage your risk!

EURUSD: Breakout Structure Supports Move Toward 1.1650Hello everyone, here is my breakdown of the current Euro setup.
Market Analysis
EURUSD is showing a clear bullish shift after breaking out of multiple downward structures and reclaiming higher support levels. The chart highlights several key phases: a prolonged decline inside two consecutive Downward Channels, followed by confirmed breakouts, each signaling weakening bearish momentum. After the second downward channel breakout, EURUSD established a stable bullish structure, forming an ascending move supported by the Triangle Support Line. Price has been consistently creating higher lows along this line, indicating strong buyer presence.
Currently, EURUSD retraced back toward the Triangle Support Line after being rejected from the major Resistance Area around 1.16500. This zone has acted as a key supply region multiple times, and it also aligns with the Triangle Resistance Line, making it a significant confluence area. As long as price remains above the ascending support, the bullish structure stays intact. The overall market behavior shows healthy correction patterns followed by breakouts, suggesting that buyers remain in control, with momentum gradually building toward the upper resistance once again.
My Scenario & Strategy
I expect price to rebound from the current correction zone and attempt another move toward the 1.16500 Resistance, which is the next major decision point. A successful breakout above 1.16500, followed by consolidation, would signal a bullish expansion and could open the path toward higher targets in the coming sessions.
However, if EURUSD breaks below the Triangle Support Line, the current bullish structure would weaken, and price may return to lower support areas before buyers attempt another recovery. For now, structure remains bullish, and pullback-based long entries continue to offer the best opportunity while price respects the rising support trendline.
That's the setup I'm tracking. Thank you for your attention, and always manage your risk.

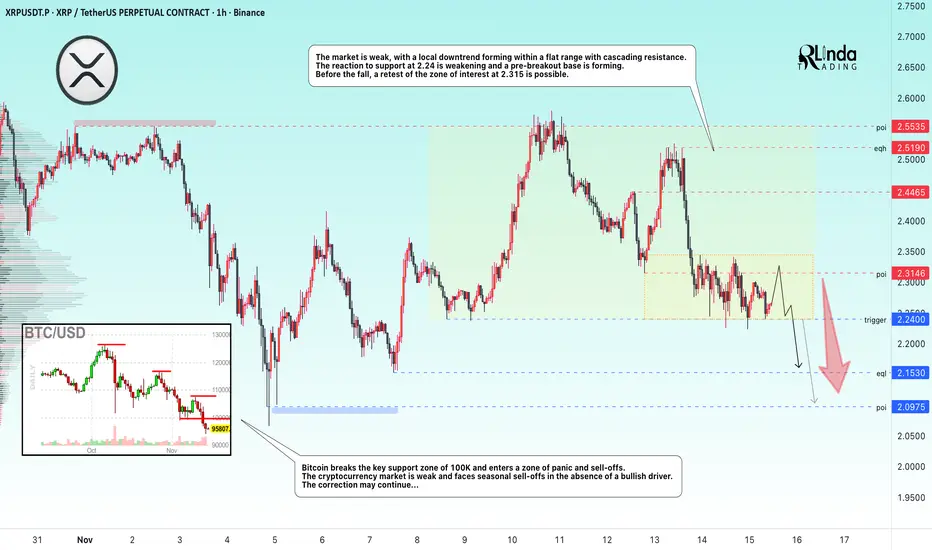
XRPUSDT → Consolidation before breaking through support BINANCE:XRPUSDT continues to storm the 2.24 support level amid a downtrend and a weak market. There is no bullish driver, and the fundamental background is also weak...
Bitcoin breaks through the key support zone of 100K and enters a zone of panic and sell-offs. The cryptocurrency market is weak and facing seasonal sell-offs in the absence of a bullish driver. The correction may continue...
XRP is forming a local downtrend with cascading resistance within a flat. The reaction to the 2.24 support is weakening and a pre-breakout base is forming. Before the fall, a retest of the 2.315 zone of interest is possible.
Resistance levels: 2.315, 2.4465
Support levels: 2.24, 2.153, 2.097
A false breakout of 2.3146 could trigger a further decline, but a close below 2.153 could trigger a sell-off and a subsequent decline to the 2.153-2.097 zone.
Best regards, R. Linda!
XAUUSD Buyers Step In — Market Aiming for $4,140 RetestHello traders! Let’s take a look at XAUUSD (Gold). XAUUSD maintains a bullish structure after bouncing from the key $4,050–$4,060 support zone, where price also retested the ascending trendline. After breaking out of the descending channel, Gold formed a new accumulation zone and moved higher, approaching the strong $4,140 resistance level. The price is now trading between the ascending support and the local supply zone near $4,140, forming a tightening structure. A breakout above this level could open the way for further upside, while a rejection may trigger a correction back toward $4,060. As long as XAUUSD holds above $4,060 and the ascending trendline, a renewed move toward $4,140 remains likely, with potential for a breakout. Please share this idea with your friends and click Boost 🚀

BTCUSD Rebounds From Buyer Zone — Correction Toward $101KHello traders! Let’s take a look at BTCUSD (Bitcoin). After an extended bearish phase inside a broad descending channel, price consistently respected both the resistance and support lines, forming a clear series of lower highs. Each touch of the descending resistance line resulted in a Turned Around reaction, confirming strong seller control throughout the structure. Earlier, Bitcoin broke below its local support area, initiating a deeper correction toward the major Support Level near $96,000. This zone aligns with the lower boundary of the descending channel and historically served as a strong reaction area for buyers. Recently, BTCUSD reached the bottom of the structure and is now showing early signs of a potential pullback. Price is attempting to rebound from the Buyer Zone, aiming toward the nearest resistance cluster around $100,800–$101,600, which also forms the lower boundary of the Seller Zone. This level previously acted as support and is now expected to serve as a strong retest area. As long as price remains below the descending resistance line, the overall trend stays bearish. A short-term bullish correction toward TP1: $101,600 remains possible, especially if buyers maintain control above the $96,000 support. However, if BTC fails to break above the Seller Zone, sellers may step in again, potentially pushing the price back toward the major support and even extending the downtrend. A confirmed breakout above the descending resistance would invalidate the bearish scenario and open the door for a stronger recovery. Please share this idea with your friends and click Boost 🚀

Gold. Where to short for 6150 pips. 16/Nov/25Xauusd have formed a pivot for downtrend at 4245.195. Trend will continue decline untill mid of December 2025..

XAUUSD: Bounce from Support Zone Targets $4,280 ResistanceHello everyone, here is my breakdown of the current Gold setup.
Market Analysis
Gold (XAUUSD) continues to maintain a bullish market structure after successfully recovering from the Support Zone near $4,090–$4,100, where buyers stepped in to defend a key demand area. Following a fake breakout to the downside in late October, price regained momentum and established a new Upward Channel, characterized by higher highs and higher lows — a strong sign of renewed buying pressure.
Currently, gold has already completed two major breakout phases, first reclaiming the support range and then extending toward the mid-channel zone. The current consolidation suggests a temporary pause before another impulsive leg upward. Price is now trading between the $4,190 support and the $4,350 resistance area, where previous reactions indicate strong liquidity. This resistance has acted as a cap for prior rallies, making it a crucial target zone for bulls. As long as the metal holds above the channel’s lower boundary, the short-term trend remains bullish. A minor pullback toward the support area could serve as a healthy correction before another rally unfolds. However, a confirmed break below $4,190 could temporarily weaken the bullish momentum and lead to a deeper retracement.
My Scenario & Strategy
I expect XAUUSD to maintain its bullish trajectory while respecting the ascending channel structure. Buyers may look for potential long setups near the $4,190–$4,200 support zone, targeting the $4,320–$4,350 resistance area (TP1). A breakout and close above $4,350 would open the path toward $4,400+ levels, confirming further continuation of the bullish cycle.
Conversely, a strong bearish break below the channel and support zone could signal a short-term correction toward $4,100 before buyers attempt to regain control. For now, sentiment remains optimistic, and gold continues to look poised for another bullish leg higher within its well-defined upward channel.
That's the setup I'm tracking. Thank you for your attention, and always manage your risk.
