GOLD → The market is testing 4K ahead of the Fed's decision FX:XAUUSD is testing $4,000 ahead of the Fed's decision, partially recovering from a 3.5% drop this week. The fundamental backdrop is mixed, but technically, the signs of a bull market are positive.
Key factors : Fed decision (today): A 25 bps rate cut is expected, but the main focus is on the vote count and Powell's comments.
A dovish scenario (emphasis on risks to the labor market) will support gold. A hawkish surprise will reinforce the correction. Trump-Xi meeting (tomorrow): Statements about lowering tariffs weaken demand for defensive assets.
Gold is in limbo; in the second half of the European session and the beginning of the US session, the market may enter a phase of stagnation. Growth is only likely if the Fed takes a soft tone, while progress in trade negotiations or a hawkish surprise from the Fed will prolong the correction.
Resistance levels: 4015, 4050, 4085
Support levels: 3975, 3945, 3900
If the bulls can hold their ground above 4K, we will see strong support, in which case growth to 4050-4100 may be triggered. Otherwise, the market may form a correction to 3975-3945. It is worth keeping an eye on comments from Powell and Trump... Volatility will be high...
Best regards, R. Linda!
Parallel Channel

EURUSD Breakdown Looms: Sellers Target 1.1560 Support ZoneHello traders, I want to share my opinion about the current EURUSD setup. After an extended bearish movement, EURUSD continues to trade within a descending channel, clearly defined by a Resistance Line connecting recent lower highs and a Support Line connecting the local lows. This structure outlines the ongoing corrective trend that has been developing over the past weeks. Recently, the price made a moderate bullish correction after rebounding from the Buyer Zone (1.15600–1.15800) — a key demand area where strong buying activity had previously emerged. However, this rebound brought EURUSD back into the Seller Zone, aligning with the upper boundary of the descending channel and the Resistance Level near 1.16600. At this stage, the market is showing early signs of bearish pressure from this confluence area. If sellers continue to hold the upper boundary, a rejection from the Resistance Line would confirm the continuation of the descending trend structure. I expect the price to rotate back down toward the Buyer Zone near 1.15600, which remains the main local support area. A confirmed breakdown below this level could trigger further momentum toward lower support targets, while a strong rebound could indicate the start of a potential accumulation phase. As of now, my scenario favors a short-term bearish continuation from resistance toward the 1.15600 target zone (TP1). Please share this idea with your friends and click Boost 🚀

GOLD → Sell-off due to uncertainty FX:XAUUSD is falling, the trend is downward, and we have confirmation of this. Profit-taking is leading to a decline, which is causing buyers to exit the market...
Caution ahead of the Fed: Markets are pricing in a 25 bp rate cut, but the main thing is the tone of the statement and Powell's comments on further steps. The USD is not ready to continue its growth and is starting to look downwards. The US government shutdown continues, adding uncertainty, which supports gold.
However, an important issue is the trade deal between the US and China; a positive outcome could put pressure on gold.
Gold is balancing between hopes for a trade truce and risks from Fed policy.
Support levels: 3895, 3820
Resistance levels: 3943, 3975, 4015
Since the opening of the session, the price has fallen by 2.3%, which is an intraday range. The 3900-3895 area may see a reaction in the form of a false breakdown and a correction to the imbalance zone before a possible further decline.
Best regards, R. Linda!

AUDUSD → Attempt to reverse the trend to bullish FX:AUDUSD is forming a correction after breaking through the resistance of the downward channel. The market needs a trading range or consolidation above 0.6526.
The dollar is consolidating but is not ready to continue growing. Pressure on the currency is emerging ahead of the Fed meeting. This may support the growth of the Australian dollar.
The currency pair is entering a distribution phase after consolidation. The breakout of 0.6526 triggered a break of the downward channel resistance. An attempt to change the trend is forming. If the bulls keep the price above 0.6526, this could trigger further growth.
Resistance levels: 0.6567, 0.661
Support levels: 0.6526, 0.6493
At the moment, an attempt to change the trend has been initiated. Consolidation and distribution are a good sign, but above the previously broken trend line, a trading range should form, which will confirm the fact of a change in the local trend.
Best regards, R. Linda!

Bitcoin Rally Heating Up – Watch This Zone Carefully!As the new week kicked off, Bitcoin ( BINANCE:BTCUSDT ) started to climb, fueled by a pump in the S&P500 index ( SP:SPX ) and the creation of a gap in the S&P500 index.
It seems Bitcoin has successfully broken above the 100_SMA(Daily) and 50_SMA(Daily) , as well as a Resistance zone($114,300-$113,000) .
In fact, Bitcoin has also formed a new CME Gap($113,495-$110,990) due to this S&P500 Index -driven surge.
Right now, Bitcoin is approaching the next key Resistance zone($118,740-$115,740) , Potential Reversal Zone(PRZ) , the Cumulative Short Liquidation Leverage($117,577-$116,731) , and the upper line of an ascending channel .
From an Elliott Wave perspective , by breaking this Resistance zone($114,300-$113,000) , Bitcoin has entered a new phase of wave counting. It appears to be completing microwave 4 of the main wave C . Overall, the corrective structure seems to be a Zigzag Correction(ABC/5-3-5) with an expanding leading diagonal in main wave A .
I expect that in the coming hours, after a pullback to the broken Resistance zone($114,300-$113,000) and those moving averages , Bitcoin might rise again at least up to the Potential Reversal Zone(PRZ) . There's a possibility of forming a larger ascending channel, but since we haven't confirmed a second top, we can't rely on that channel just yet.
Note: In general, the crypto market in the past couple of weeks has been heavily influenced by news around U.S.-China tariffs. Any headline can cause Bitcoin and other tokens to swing up or down, so keep an eye on those geopolitical headlines.
Cumulative Long Liquidation Leverage: $113,625-$112,175
Cumulative Long Liquidation Leverage: $106,033-$104,090
Note: If Bitcoin falls below the moving averages and the Resistance zone($114,300-$113,000) again, we can expect further declines.
Please respect each other's ideas and express them politely if you agree or disagree.
Bitcoin Analysis (BTCUSDT), 2-hour time frame.
Be sure to follow the updated ideas.
Do not forget to put a Stop loss for your positions (For every position you want to open).
Please follow your strategy and updates; this is just my Idea, and I will gladly see your ideas in this post.
Please do not forget the ✅' like '✅ button 🙏😊 & Share it with your friends; thanks, and Trade safe.

EURUSD Short: Retest of Resistance Before Next Leg DownHello traders! The overall market structure for EURUSD continues to favor the bears, following a sharp rejection from the 1.1720 supply zone. This area marked a strong pivot point where the price failed to sustain any further bullish momentum and began forming a clear descending channel, establishing a consistent pattern of lower highs and lower lows.
Currently, the pair is trading within this descending channel, maintaining strong downside momentum. After a short-term recovery attempt, the price reached the upper boundary of the channel and reacted with a noticeable rejection from the resistance line, reinforcing bearish pressure.
My scenario for the next move suggests that this corrective rally is now complete. I expect the price to resume its downward trajectory from this resistance area and move toward the 1.1560–1.1540 demand zone, where the next key reaction level lies.If sellers remain dominant and manage to break through this demand area, the next wave could extend toward new lows, continuing the broader bearish trend. Therefore, my target (TP) is set at 1.1560, anticipating the continuation of the main downward impulse. Manage your risk.

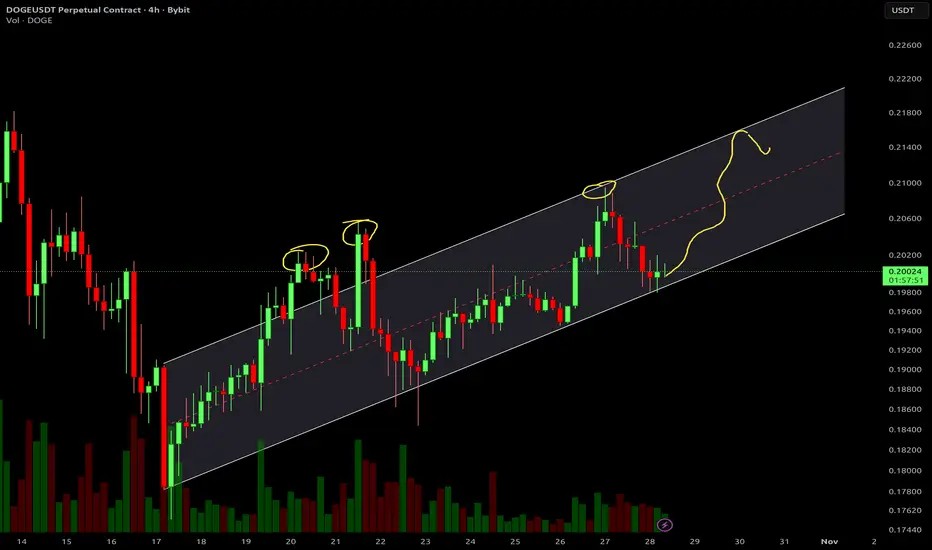
DOGE Channel BreakoutDOGE is in the bottom of an upward channel. It looks ready to re-enter the top of the channel
Gold. Possible find temporary support. 28/Oct/25Xauusd possible at its temporary support zone at 3900 +/- while waiting for FED and Japan rate decisions meeting 30 Oct.

Gold Preparing to Continue Its Bullish Move After ConsolidationHello traders, I want share with you my opinion about Gold. Gold has maintained a strong bullish structure over the recent period, forming a clear ascending channel that has been respected multiple times. Each correction has been followed by strong bullish impulses, confirming that buyers remain in control of the long-term direction. After reaching the 4,368 Resistance Level — which coincides with the upper boundary of the channel — the market entered a range phase, signaling consolidation after an extended rally. The current price action has formed a secondary support zone near 4,050 – 4,080, also aligned with the ascending support line of the broader channel. Currently, the price is moving inside a range structure (Buyer Zone to Seller Zone), consolidating just above the main ascending support line. In my opinion, this area represents a critical accumulation zone, where buyers are likely preparing for another upward push. I expect that after testing the Buyer Zone, the price will find strong support and initiate a new bullish wave toward the Seller Zone and the Resistance Level at 4,368. A confirmed breakout above the resistance line of the local descending structure would validate this bullish continuation scenario. Please share this idea with your friends and click Boost 🚀

Riding the Crypto TOTAL Market Cap WavesHey stars ✨ — just popping in with a little dose of chart magic and market wisdom 🌙💫
I’ve been watching the TOTAL Crypto Market Cap chart (yes, the big picture one!) and something beautiful is forming — a rising channel pattern on the weekly timeframe. It’s like the market is climbing a staircase of light, pausing to recharge, and then glowing higher again.
Here’s what I’m seeing:
The channel support has held strong three times already 🌟 — each bounce confirming that this trend still has confidence and flow behind it.
Every time price touches the top of the channel, we tend to see a pause or small correction.
So, the rhythm is:
🌟 Buy near support.
🌟 Take some profits near resistance.
It’s simple, elegant, and works beautifully when the market respects structure.
But… we never want to get too comfy in a single scenario 👀✨
Because when a channel finally breaks, it can go either way:
A break above the channel often signals acceleration — and that’s when we wait for a retest of the breakout to go long again 🚀
A break below means the trend is losing its shine — and we can prepare to short or hedge after the breakdown retest ⚡
So, whether you’re team bull or bear, keep your eyes on that linework. The market always gives a little whisper before the next move… if you’re calm enough to listen 🌌
Let’s trade smart, stay kind to ourselves, and remember — good energy attracts good setups ✨💫

XAUUSD Long: Bulls Preparing for the Next Impulse Toward 4180Hello, traders! Gold (XAUUSD) continues to move within a strong bullish structure, defined by a clear Ascending Channel. The market has shown steady buyer strength, forming consistent higher highs and higher lows. Along this uptrend, price has broken resistance level — most notably around 3950, turning him into new support zone. After reaching the upper part of the channel near the Supply Zone (around 4250), the price entered a corrective phase, retesting the midline of the ascending channel.
This correction appears healthy within the broader bullish context, as it aligns with previous pivot points and areas where demand has repeatedly returned.
Currently, the market is trading between the Support Zone (around 3950) and the Supply Zone (around 4100–4250). Buyers have recently defended the lower boundary of the channel, suggesting potential continuation to the upside if momentum sustains.
My main scenario anticipates a bullish continuation from the current pivot zone.
If the price successfully holds above the Demand Line and breaks through 4100, I expect a further move toward the 4180–4250 resistance area — which aligns with the top of the channel and prior supply zone.In my opinion, this structure still favors the bulls, and any correction toward 3950 would likely offer a buying opportunity within the prevailing uptrend.Therefore, my target (TP) is set at 4180, aiming for a retest of the channel’s upper resistance line. Manage your risk!

GOLD → A psychologically important level of $4,000 lies aheadFX:XAUUSD continues to correct, unable to consolidate above $4,100, with the 4K mark ahead. Pressure is intensifying due to hopes for a trade deal between the US and China, as well as profit-taking ahead of the Fed's decision on interest rates...
Key factors:
Progress in trade negotiations: the US has withdrawn the threat of 100% tariffs, and China may support the situation. Thursday's meeting between Trump and Xi Jinping increases the chances of a deal.
Bets on two rate cuts in 2024 are almost fully priced in. US inflation (3% y/y) was lower than forecast (3.1%), but did not change expectations.
The correction may continue if the positive backdrop for the trade deal remains. The Fed's decision on Wednesday will be a key catalyst.
Technically, the 4K zone is ahead, and it is too early to talk about a break of this support, as we do not know how the market will react. However, at the moment, the price is in the range of 4000-4163, and from a technical analysis point of view, it is logical to consider a false breakdown and a pullback.
Support levels: 4000, 3975, 3944
Resistance levels: 4060, 4090, 4163
As part of the decline, the market may test one of the specified zones: 4000, 3975, 3944. However, since a liquidity pool has formed below 4K, the reaction to the psychological support level may be aggressive. It is important to monitor the situation, as closing below 4K and consolidating below a strong level could trigger a further decline. Otherwise, if the bulls manage to hold their ground above 4K and bring the price back above 4050, the market may have a chance to grow.
Best regards, R. Linda!

BTCUSDT: Bounce from Support Could Ignite Rally Toward $114KHello everyone, here is my breakdown of the current Bitcoin setup.
Market Analysis
Bitcoin (BTCUSDT) has recently transitioned from a bearish phase to a bullish structure after breaking out of a prolonged downward channel. The market had been forming a sequence of lower highs and lower lows until it found strong demand in the support zone around 110,000. From there, price began consolidating, indicating that sellers were losing control.A decisive breakout from the channel marked the end of bearish pressure, and since then, BTC has been moving inside a new upward channel, forming higher highs and higher lows — a clear sign of bullish momentum returning.
Currently, the price is approaching the resistance zone near 113,600–114,000, which previously acted as a key supply area. The ongoing structure suggests that buyers are attempting to push through this level and confirm a breakout continuation.
My Scenario & Strategy
In my view, BTC may attempt to retest the local support area near 111,000 before resuming its move higher. A successful bounce from this level would confirm that the new upward channel remains intact and provide a favorable long opportunity targeting the 114,000–115,000 zone.
If price breaks and holds above this resistance zone, it will likely open the door for a stronger bullish continuation toward 118,000 and beyond.
However, if BTC fails to maintain the channel support, a temporary correction back to the 110,000 area could occur before the next upward impulse.
That's the setup I'm tracking. Thank you for your attention, and always manage your risk.

EURUSD: Buyers Preparing for a Potential Reversal MoveHello everyone, here is my breakdown of the current Euro setup.
Market Analysis
After a prolonged bearish trend that followed the formation of a clear Head and Shoulders pattern, EURUSD has transitioned into a range-bound consolidation. The market structure suggests that sellers are losing momentum, as the price has established strong support near the 1.15550 area, forming a key demand zone where buyers have shown repeated interest.
Recently, the market created a descending triangle formation, with price action coiling between the Triangle Resistance Line and Triangle Support Line. The current positioning shows that EURUSD is testing the lower boundary of this structure — an area that aligns with both historical support and the bottom of the range, forming a strong confluence zone.
My Scenario & Strategy
In my view, this setup provides an interesting long opportunity if the support around 1.15550–1.1600 continues to hold. I’m looking for a bullish reaction or confirmation signal (such as a strong breakout candle or retest) from the Triangle Support Line. If buyers successfully defend this area, I expect the price to rebound upward, breaking through the descending Triangle Resistance Line and initiating a new bullish leg within the broader structure.
My first target (TP1) for this move is the 1.17570 resistance level, which represents a key zone of prior supply and a natural technical objective for the next upward rotation.
That's the setup I'm tracking. Thank you for your attention, and always manage your risk.

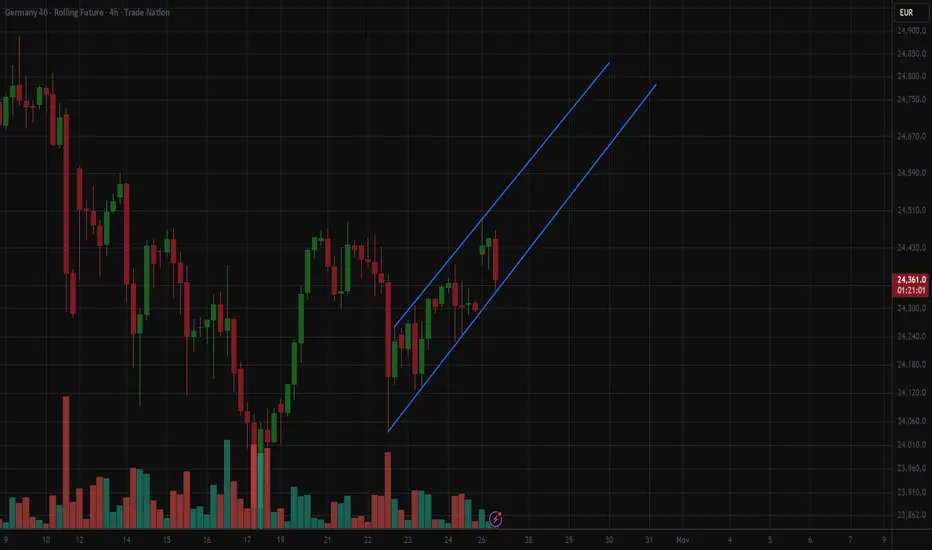
4H Bull channel DAX Buy signalDax futures are in a bull channel on 4H chart since 23 october.
Today the DAX can be bought at the bottom of that bull move with an entry around 24350, stop loss for 50 and an expected profit of 120 points.
XRPUSDT → Pre-breakout base. Are the bulls back?BINANCE:XRPUSDT is attempting to break through the resistance of the trading range as part of a bullish run across the entire market. There is a chance that a breakthrough could form after a pullback...
The market is gradually buying back the liquidation that occurred on October 10. Bitcoin is breaking the structure, which indicates a possible return of the bulls. This sets a positive tone for the cryptocurrency market.
XRP is testing resistance and entering a consolidation phase. The trigger that could provoke growth is 2.661. However, as part of the consolidation, the market may test support before growth in order to hunt for liquidity.
Resistance levels: 2.661, 2.739
Support levels: 2.587, 2.547, 2.500
Since the opening of the session, the market has formed a fairly strong momentum, and at the beginning of the European trading session, a correction may form before the growth continues. As part of the correction, XRP may form a pullback to 2.587 - 2.500.
Best regards, R. Linda!

GOLD → Technical analysis of the current situation FX:XAUUSD is consolidating, and the daily market behavior pattern is not particularly positive, but it does have bullish implications. Market sentiment largely depends on the fundamental background
This week, the Fed is expected to hold a meeting on interest rates, where it will most likely decide to lower them, which could generally support the dollar (but this news is most likely already priced in). Accordingly, the rest depends on decisions regarding the shutdown, trade war, and inflation. The resolution of the first two issues may weaken the price.
As for the technical side, since the price is currently within the trading range, it is worth considering trading within these limits first. However, a breakout and closing above/below one of the key levels: 4060 - 4150 could trigger further movement in the direction of the breakout, which in turn could push the price into another (bearish or bullish) trading range. Below, there is the 4000 zone, and there is a possibility of a retest of this area, with a potentially aggressive reaction.
Resistance levels: 4150, 4218, 4275
Support levels: 4060, 4015, 3944
While uncertainty remains, the market may continue to hold the price between 4060 and 4150. Another retest of the range boundary and the reaction to this retest will show the market's intentions for further movement.
Best regards, R. Linda!

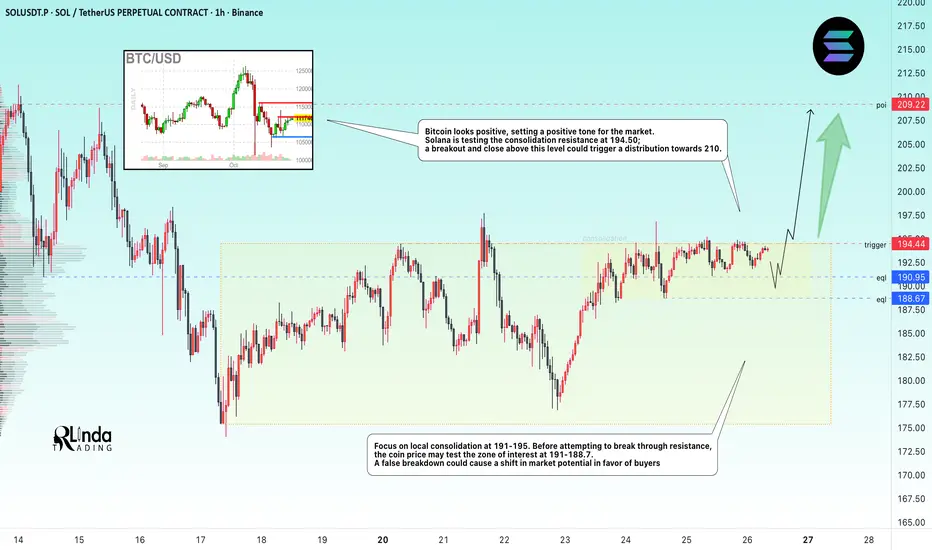
SOLANA → Consolidation before resistance. An attempt at growth?BINANCE:SOLUSDT.P is testing the resistance of the trading range, with pre-breakout consolidation forming, indicating that buyer interest in the coin is emerging.
Bitcoin looks positive, which sets a positive tone in the market. Solana is testing the resistance of consolidation at 194.50; a breakout and close above this level could trigger a distribution to 210.
Focus on local consolidation at 191-195. Before attempting to break through resistance, the coin price may test the zone of interest at 191 - 188.7. A false breakout could cause a shift in market potential in favor of the buyer, which in turn could trigger a breakout of 195 and growth.
Resistance levels: 194.5, 209
Support levels: 190.1, 188.7
A retest of resistance, consolidation after growth, and no reaction to bears are positive signs that a breakout attempt may be realized. A close above 194.5 - 195.0 would be a good sign for growth.
Sincerely, R. Linda!
XAUUSD: Bullish Momentum Still Intact After a Healthy PullbackHello everyone, here is my breakdown of the current Gold setup.
Market Analysis
The broader trend for Gold remains strongly bullish, as we can clearly see from the consistent upward channel that has been forming since mid-September. Each corrective phase has been followed by a decisive breakout, confirming buyers’ control and sustaining the uptrend.
Recently, the market broke out from the upper boundary of the range near 4020, establishing a new structural high close to the 4250 resistance zone. However, after reaching this zone, the price entered a correction phase, pulling back to retest the major support zone around 4050–4020 — a level that also aligns with the lower boundary of the ascending channel.
My Scenario & Strategy
At the moment, the price is stabilizing around the support zone, showing early signs of a potential bullish rebound. This zone has acted as a strong demand area throughout the uptrend, and I expect buyers to defend it once again. If the price confirms a bounce from this level, the next logical move would be a continuation towards the 4215 resistance zone, which also aligns with the mid-level of the previous range.
I remain bullish on Gold while the price holds above the 4020 support zone. A successful retest here would provide a good opportunity for long positions targeting 4215 initially. If the price fails to hold above this level, we could see a deeper pullback — but as long as the channel structure remains intact, the broader bias stays positive.
That's the setup I'm tracking. Thank you for your attention, and always manage your risk.

Siver may reach ATH again but not gold. 26/Oct/25 XAGUSD based on wave substructure silver may reach ATH again next week with price touching the upper trendline ( red) 3rd time at 55 +/-

Bitcoin Forms Head and Shoulders — Correction 107,500 in PlayHello traders! I’d like to share my view on the current market structure for Bitcoin. After a prolonged period of bullish momentum and multiple impulsive rallies, the market has entered a corrective phase. The price action has formed a clear Head and Shoulders pattern beneath the major resistance zone near 121,700, signaling growing selling pressure. Currently, BTC is trading within a short-term descending structure, staying below both the resistance line and the Seller Zone. The recent rejection from the right shoulder area confirms that sellers remain in control, and the market is now moving toward the Buyer Zone, located around 107,500.In my opinion, this movement represents a continuation of the ongoing correction rather than a full trend reversal. I expect the price to decline into the Buyer Zone, completing the right shoulder and reaching the TP1 target near 107,500. If the market finds strong support in this demand area and forms a confirmed reversal structure, it could mark the end of the corrective phase and initiate the next major bullish leg. A successful bounce from this level would open the way for a potential rally back toward the 114,000–115,000 resistance range.This setup provides a clear trading plan — I remain bearish in the short term, looking for a potential bullish reversal from the lower boundary of the structure. Please share this idea with your friends and click Boost 🚀

EURUSD – Range Retest Could Trigger New Sell WaveHello traders, I want to share my view on EURUSD. The market recently formed a descending wedge pattern after breaking down from the previous range structure, which dominated price action for a long time. The breakout from this wedge occurred after the pair reached the major support zone around 1.1560, triggering a minor upward correction. At the moment, the price is testing the lower boundary of the previous range, which has now turned into a strong resistance zone around 1.1660. This level coincides with the confluence of a horizontal resistance and the descending trendline, creating a potential supply area. Despite the small bullish reaction from support, the overall market sentiment remains bearish. Buyers have not shown sufficient momentum to push price above the resistance, suggesting that this movement is likely a corrective pullback within a broader downtrend. In my view, the 1.1660 area will act as a ceiling, and the pair is likely to resume its decline toward the 1.1560 demand zone. A confirmed rejection from this resistance could open the path for a new bearish leg, potentially targeting even lower levels if sellers maintain control. Please share this idea with your friends and click Boost 🚀

GOLD → Retest 4060 within the range. What are the expectations?FX:XAUUSD is forming a correction from the Asian session, with the price testing the important 4060 zone ahead of two key events: US inflation data (CPI) and the results of US-China trade negotiations.
Key factors: US inflation (CPI): Low data will support gold (expectations of two cuts in 2024), but high figures will strengthen the USD and weaken gold (rates for a rate cut in December will decline).
Progress in negotiations between China and the US could weaken gold, while failure would bring back demand for safe havens. US sanctions against Russian oil are supporting oil prices and inflation expectations.
Gold is in wait-and-see mode. Growth is likely with weak CPI or a failure of negotiations. Strong CPI and progress in trade will reinforce the correction. The mood remains cautious ahead of events.
Resistance levels: 4090, 4150, 4163
Support levels: 4060, 4002
The important zone of 4060 - gold is forming a false breakdown. If the bulls hold their defense above this zone, it could trigger growth towards the resistance of the range. Otherwise, we can expect a retest of 4000K, and the reaction should be aggressive...
Best regards, R. Linda!
