XAUUSD: Price can Drop to Support Zone and Break Trend LineHello everyone, here is my breakdown of the current Gold setup.
Market Analysis
Gold has been in a very strong uptrend, which accelerated after breaking out of a prior Upward Channel. This led to a new, steeper rally along a major Trend Line, culminating in a new All-Time High around the 4380 mark.
Currently, after reaching that peak, the price has completed a healthy correction back down to the main Trend Line, which also aligns with the Support zone at the 4250 level. The price has bounced from this area and is now attempting to rally again.
My Scenario & Strategy
My scenario is a bearish one, built on the idea that this second attempt to rally will fail to make a new high. I'm looking for this current rally to lose momentum as it approaches the prior ATH of 4380. The key signal for me would be a strong and clear rejection from that area, showing that buyers no longer have the strength to continue pushing the price higher.
Therefore, the strategy is to watch for this failure at the highs. A confirmed reversal would validate the short scenario and should lead to a decline that breaks the major ascending Trend Line. The primary target for this corrective move is 4205, which is inside the major Support zone.
That's the setup I'm tracking. Thank you for your attention, and always manage your risk.
Parallel Channel

Gold. Where to sell for 5300 pips? 22/Oct/25XAUUSD finally having deep correction just in 1 daily bar! almost 6% the biggest single day drop in 12 years.. Where can we play the knife jump games in gold with rare golden opportunity for few thousands pips just in 2,3 days?

Gold final bull/bear battle level 4340 +/-. 21/Oct/25XAUUSD possible having triple top with strong seller taking control over bull near 4340 +/-..

Euro can Continue its Rally After a Minor CorrectionHello traders, I want share with you my opinion about Euro. The market for the Euro has been through a highly complex series of structural shifts, transitioning from a prior upward channel into a well-defined downward channel. After multiple failed rallies and a final drop into the 1.1600 buyer zone, the price action for EURUSD has shown a significant reversal, breaking out of the downward channel and establishing a new short-term bullish momentum. Currently, after this strong breakout, the asset is undergoing a minor corrective phase. In my mind, this price action represents a healthy pullback before the next leg higher. I expect that the price will make a small dip to find support, likely retesting the broken channel structure from above. I think a confirmed bounce from this area will validate the bullish breakout and trigger a continuation of the rally. Therefore, I have placed my TP at the major 1.1780 Resistance Level, which aligns with the seller zone and represents a logical objective for this recovery. Please share this idea with your friends and click Boost 🚀
Disclaimer: As part of ThinkMarkets’ Influencer Program, I am sponsored to share and publish their charts in my analysis.

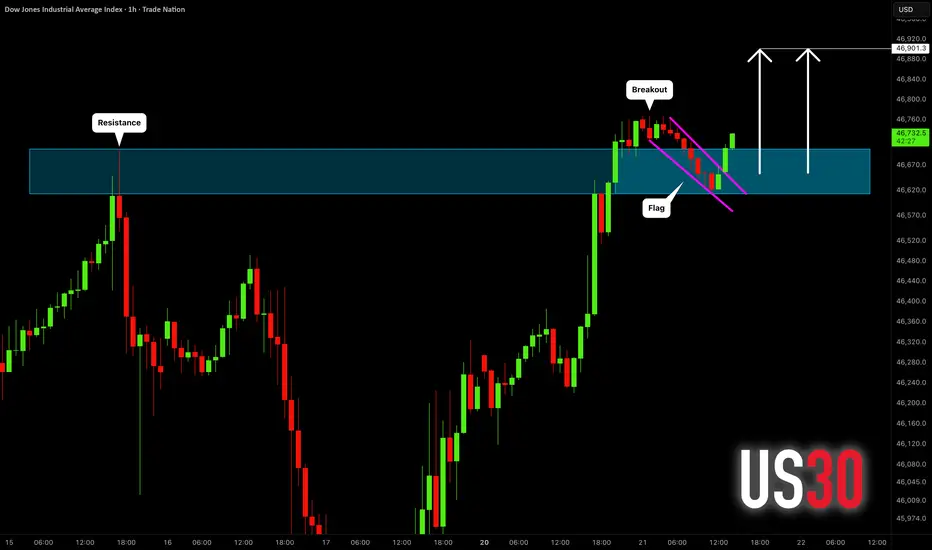
DOW JONES INDEX (US30): Bullish Continuation Confirmed
US30 index violated a major horizontal resistance yesterday.
The price started a correctional movement then, steadily
falling within a bullish flag pattern.
A breakout of its resistance line is a strong bullish signal.
Odds will be high, the index will hit 46900 level soon.
❤️Please, support my work with like, thank you!❤️
I am part of Trade Nation's Influencer program and receive a monthly fee for using their TradingView charts in my analysis.

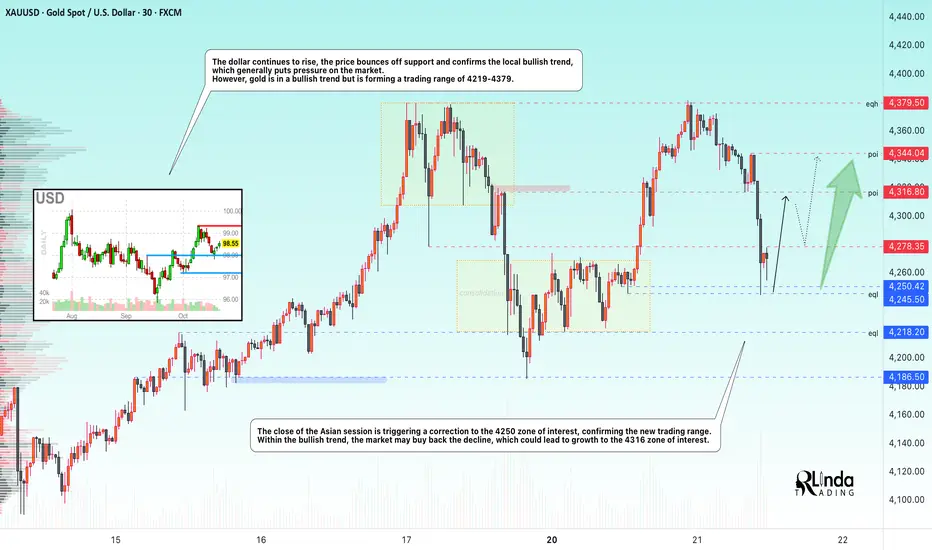
GOLD → The correction forms a trading range. Growth?FX:XAUUSD is adjusting to $4250 after retesting the all-time high of 4380. Short-term pressure is linked to hopes for an easing of the trade war between the US and China, but the bullish trend remains intact.
Key factors: Bentsen's meeting with the Chinese Vice Premier this week has revived optimism for a deal. The reduction in trade risks is temporarily supporting the USD. Hassett's statements about the imminent resumption of government work have reinforced risk-on sentiment.
Support for gold: The threat of tariffs rising to 155% from November 1 reminds us of the risks. Two rate cuts before the end of the year remain in focus. Friday's inflation data release and US corporate earnings reports are keeping demand for hedging alive.
Accordingly, the correction in gold is a temporary pause. The uptrend will remain unchanged as long as macro uncertainty persists.
Support levels: 4250, 4218
Resistance levels: 4278, 4316
Within the bullish trend, the price is forming a trading range. A retest of support could end in a recovery, with the fundamental background favoring the bulls. A retest of 4245 could trigger growth, as could a breakout of 4278 (closing above resistance).
Best regards, R. Linda!
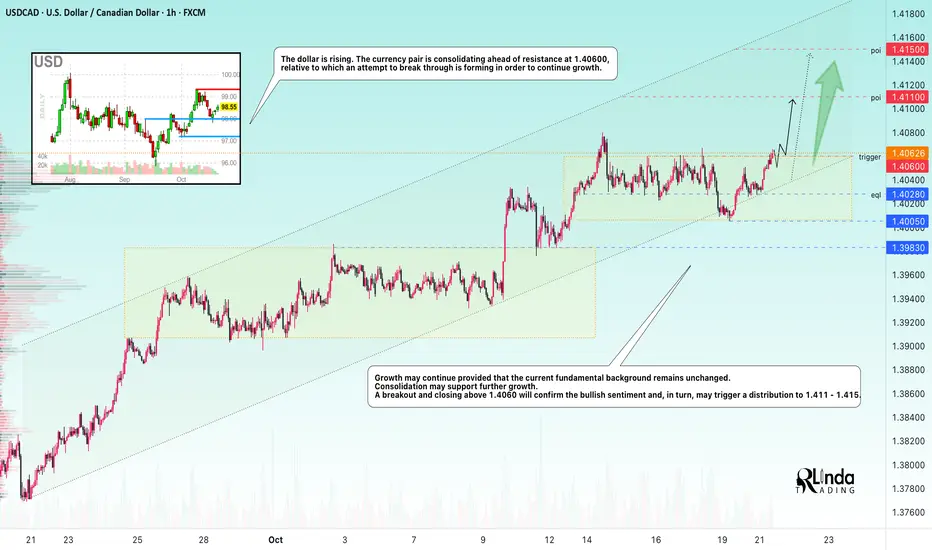
USDCAD → Attempt to break through resistance to continue growth FX:USDCAD is attempting to break through consolidation resistance within an uptrend. Growth in the dollar index may support the current trend.
The dollar is rising. The currency pair is consolidating ahead of resistance at 1.40600, against which it is attempting to break through in order to continue growing.
The growth may continue if the current fundamental background remains unchanged. Consolidation may support further growth. A breakout and closing above 1.4060 will confirm the bullish sentiment and, in turn, may trigger a distribution to 1.411 - 1.415.
Resistance levels: 1.4060
Support levels: 1.4028, 1.4005
The trend is bullish, with virtually no pullback after the growth, only consolidation, which is technically a positive sign. A breakout of the specified consolidation resistance could trigger distribution to areas of interest.
Best regards, R. Linda!
Gold last push up? 18/Oct/25XAUUSD will its recently scary exciting 1500++ (pips/meter) roller coaster ride end soon? Probably is the beginning?! That Roller Coaster just moving into standby position at 4125 "meter" height before climbing slowly to the Height of 4430 And finally "rolling down"!!??

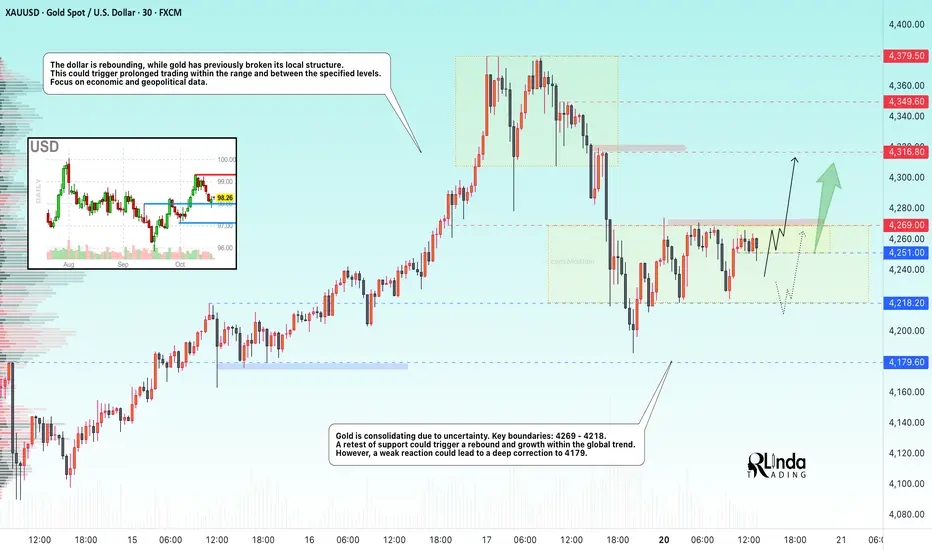
GOLD → Consolidation. 4269 - trigger. Chances for growth?Gold is consolidating due to uncertainty. On Friday, the market broke its local structure, which slightly changed sentiment. Focus on current consolidation.
Key drivers of the week: Trump's threat to impose 100% tariffs on Chinese imports and China's response supported demand for safe havens. Problems with regional banks (Zions, Western Alliance) and the fall in Treasury bond yields below 4% increased the inflow into gold. Powell maintained a neutral tone, but markets are expecting two rate cuts in 2024.
All eyes are on inflation data, US-China negotiations, developments between Russia, the US, and China; any de-escalation of the situation could trigger a correction.
Technically, the upward trend in gold remains relevant. Corrections will be bought up as long as uncertainty surrounding trade policy, the banking sector, and the Fed's monetary policy persists.
Resistance levels: 4269, 4316
Support levels: 4251, 4218
At the moment, a pre-breakout base is forming around 4269. If the structure remains intact and the price continues to attack resistance, the chances of a breakout and growth will be high. Otherwise, a close below 4251 could trigger a retest of 4218.
Best regards, R. Linda!
Gold’s Golden Retest?Gold continues to trade within a rising blue channel, maintaining its overall bullish structure.
Currently, price is retesting the intersection between the lower blue trendline and the red structure zone, which has acted as strong support multiple times.
As long as this confluence area holds, I’ll be looking for trend-following longs targeting the upper boundary of the channel.
A break and close below this zone would temporarily pause the bullish momentum and open room for a deeper correction.
⚠️ Disclaimer: This is not financial advice. Always do your own research and manage risk properly.
📚 Stick to your trading plan regarding entries, risk, and management.
Good luck! 🍀
All Strategies Are Good; If Managed Properly!
~Richard Nasr

XAUUSD-GOLD 1H Chart—SELL Setup with 3 Profit TargetsHello Guys,
Here’s my 1-hour XAUUSD-GOLD analysis for you.
These are the exact SELL levels I’ll be watching:
🔵SELL level: 4285.9
🔴 Stop level:4335.3 (or adjust based on your own margin)
🟢 TP1: 4264.8
🟢 TP2: 4232.1
🟢 TP3: 4185.0
Risk-to-reward ratio on this setup: 2.05
If XAUUSD-GOLD reaches these levels, I’ll definitely take a SELL position.
Every like is my biggest motivation to keep sharing these analyses.
Thanks to everyone supporting me!

Resistance then bearishwe see last week price ended up rising but reaching this resistance area we should expect it to continue falling.

XAU USD - keeps on giving in 2025Hello, it's been a while.
I've been on working building my pile in XAG, XAU reserves.
Now i am back, Gold is still giving a phenomenal return on printing up and right (meaning growth).
I don't know where price structure will end, however it's a highly probable chance we will hit $4,000USD per oz, and continue to raise.
Daily chart image shows my thought pattern and an opportunity I am waiting for price to revert to.
I'm referring to the Daily price chart and key counts are in line with Wave counting and supply and demand curve trading levels based on fair value gap intervals of weekly trading sessions plotted to a daily chart at intervals of 60.
Current wave - 3 of 5 in the Elliott wave count.
Master Key for zones
Red = Three Month
Blue = Monthly
Purple = weekly
Pink = Consolidative box example (Daily)
Orange = Daily
Risk Warning
Trading leveraged products such as Forex, commodities and CFDs, carries with it a high level of risk and so may not be suitable for every investor. Prior to trading the foreign exchange, commodity or CFD market, consider your investment objectives, level of experience and risk appetite. You should never risk more than you can afford to lose. If you fail to understand or are uncertain of the risks involved, please seek independent advice and remember to conduct due diligence as criteria varies to suit the individual.
Below are some of the take aways from the video - please listen again incase any detail is missed.
Do you enjoy the setups?
Professional analyst with 8+ years experience in the capital markets
Focus on technical output not fundamentals
Focus on investing for long term positional moves
Provide updates where necessary - with new updated ideas tracking the progress.
If you like the idea, please leave a like or comment.
To all the followers, thank you for your continued support.
Thanks,
LVPA MMXXIV

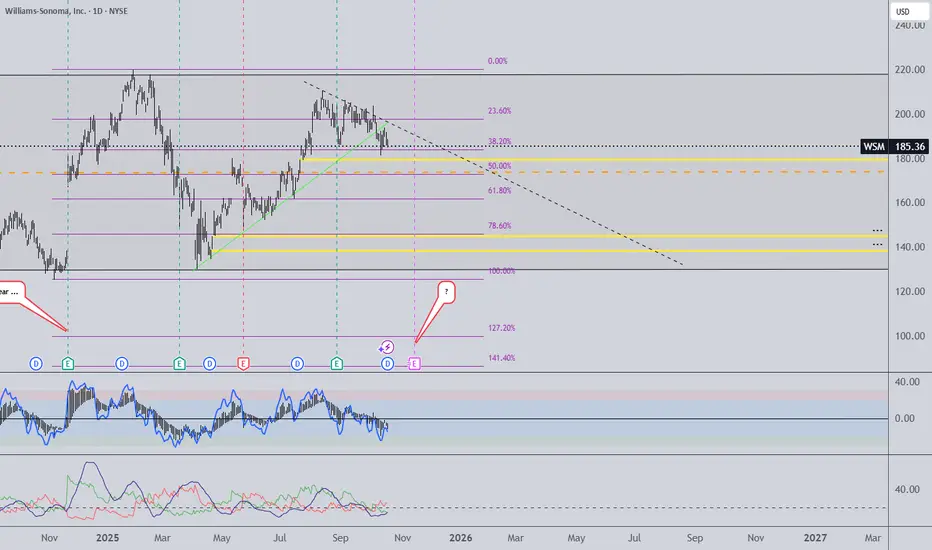
Bearish Setup in Progress?
Sharing a technical look and t he stock is showing signs of weakness — here’s the breakdown:
Price broke below a key ascending trendline (green line).
Now forming lower highs, potentially respecting a descending resistance line we got going .
Fibonacci levels following the bias of price moving in channel and surprisingly 50% could be the key element .
If this level breaks, next targets are the 61.8% retrace (~$162) and possibly the $150–145 zone (highlighted in yellow).
We can also see steady selling pressure — no clear reversal yet.
RSI is below 50, suggesting momentum is with the sellers.
No bullish divergence yet — so sellers still in control .
Dividend just paid (Oct 17) — stock often pulls back slightly afterward.
Important element here mid-November earnings — this could act as a major catalyst.
Not Financial Advice:
Just sharing the setup I’m watching. Risk is real — triggers matter. This one could show power of proper approach wit simple tools .
NOK/USD Long-Term Elliott Wave OutlookThis weekly chart of the Norwegian Krone against the U.S. Dollar (NOK/USD) shows a clear long-term bearish structure within a descending Elliott Wave channel. The pair has been in a sustained downtrend since 2008, forming a five-wave impulsive pattern.
Wave (1) and (3) are already completed, with Wave (3) extending to the 1.618 Fibonacci projection level — a typical target for a strong third wave. The recent corrective structure suggests the completion of Wave (2) of a larger degree, likely retracing between the 0.382 and 0.618 Fibonacci levels.
The projection anticipates the start of a new bearish cycle with the unfolding of Wave (3) → (4) → (5), targeting the 0.055–0.06 zone. This region aligns with long-term Fibonacci confluence and the lower boundary of the descending channel, representing a potential final low before a major trend reversal.
Traders should monitor confirmation signals on lower timeframes to validate the start of Wave (3) down.
Disclaimer: The charts I post are based on Elliott Wave Principle and are intended to be self-explanatory. TradingView requires a meaningful description, and this text was AI-generated to provide accessible context for those less familiar with Elliott Wave concepts. This is not financial advice.

POL LongSince May when POL broke-out from its downward channel, it has formed a new upward channel. Currently, its near the channel bottom (which is at ~642).
New upward short-term targets can be 662, 692, 717 and 748.
I'm using adjusted charts so the historical prices you see on unadjusted chart can be different.
This is my personal view and not a buy / sell call.

Gold can Fail its Rally and Fall Towards 4125Hello traders, I want share with you my opinion about Gold. The market for Gold has been through a highly complex and volatile phase after breaking down from its prior upward channel. This led to a significant fall into the support zone, followed by a strong recovery that has since pushed the price of XAU above a major ascending trend line. Currently, the asset is undergoing a corrective pull-back towards this broken trend line, setting the stage for what I believe is a critical test. In my mind, the price action is setting up a potential 'bull trap'. I expect that the price will first make a correction to the trend line, find support, and then attempt another rally. I think this rally will be exhaustive and will fail upon reaching the 4280 mark. A confirmed rejection from that peak would signal a major reversal. The subsequent decline should have enough momentum to break the major ascending trend line. Therefore, I have placed my TP for this reversal scenario at 4125. Please share this idea with your friends and click Boost 🚀
Disclaimer: As part of ThinkMarkets’ Influencer Program, I am sponsored to share and publish their charts in my analysis.

Bitcoin at the EdgeShort-Term View:
Bitcoin (BTCUSD) has broken below the lower boundary of its rising channel near $111,000–$112,000, signaling potential short-term weakness. However, the price is still hovering close to this zone, meaning a false breakdown and quick recovery could still happen.
If BTC reclaims $114,000, a rebound toward $118,000 → $122,000 becomes likely.
A daily close below $104,000 would confirm a deeper bearish move.
Long-Term View:
As long as Bitcoin stays above the $101,000–$102,000 area (the last major swing low), the broader bullish structure remains intact. A recovery back inside the channel could reignite the uptrend toward $125,000–$128,000.
If the breakdown holds and BTC closes multiple days below $101,000, the long-term support could shift lower toward $92,000–$88,000.
Summary:
Bitcoin is currently testing the bottom of a long-term ascending channel, making this a critical zone for market direction.
A recovery above $114K could turn sentiment bullish again, while sustained weakness below $104K opens the door to a larger correction.

Next Stop: 8K? Ethereum’s Big Breakout LoadingEthereum has been building a clean bullish structure for years and right now it’s standing right at the edge of a major breakout.
If ETH manages to hold above the 4K zone, the 6K–8K targets are just the beginning.
Above that, we enter the FOMO Zone, and a move toward 13K is totally on the table.
As long as price stays above 2.75K, the bullish structure remains solid.

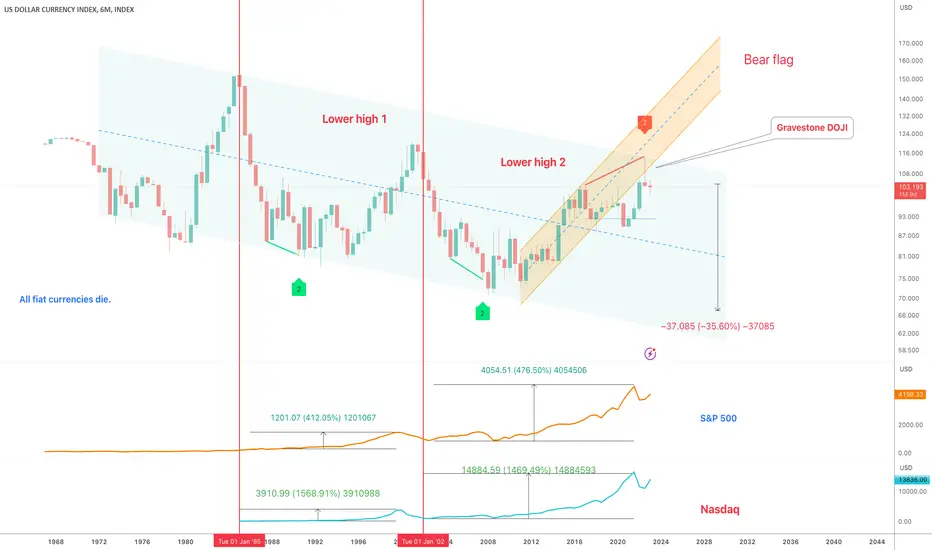
Dollar index - Macro Bearish divergenceA lot of information in the above 6-month chart of the dollar index, could discuss for hours.. some highlights:
1) The bearish divergence currently printing shall confirm by July 2023 should 100 level collapse. It is the only time in history a bearish divergence of this strength has printed on the 6-month chart.
2) IF it confirms, the index will target the lower side of the channel around 60-70 level.
3) Notice the trend of the index, lower highs lower lows. It is remarkable how many are bullish on the dollar, in the macro sense.
4) Both the S&P 500 and the NASDAQ made considerable gains in the 10-year period that followed a rejection from the upper side of the channel. Many ‘experts’ now talk about the coming lost decade. Gold is the only option, they say. Is that what you see in this chart?! Not what I’m seeing..
Will return in July to see how this candle prints, however with 1.3 months to go it is not looking good for the dollar.
Ww
XAUUSD: Rally can Reach new ATH - $4520 pointsHello everyone, here is my breakdown of the current Gold setup.
Market Analysis
Gold has been in a very strong and complex uptrend. We saw the price break out of an initial range and then establish a major Trend Line that has guided it higher, breaking through key levels like Support 2 at 3670 and Support 1 at 4020.
Currently, the most significant event is that the price has broken out above its main Trend Line. After this powerful move, the market has entered a natural corrective phase and is pulling back towards this broken line for a classic retest. This is a critical area to watch.
My Scenario & Strategy
I'm looking for the price to complete its correction down to this main ascending trend line. The key signal for me would be a confirmed and strong bounce from this dynamic support, which would tell me the pullback is over and the primary trend is ready to accelerate.
Therefore, the strategy is to watch for this bounce. A successful defense of the trend line would validate the long scenario. My new target for the next impulsive wave higher is 4520, which would represent a new ATH.
That's the setup I'm tracking. Thank you for your attention, and always manage your risk.

NExt LEg for EURCADA correction phase in play or short retracement into higher highs. The market leads, I follow
