EURUSD Short-Term Correction Within Bullish StructureHello traders! Here’s my technical outlook on EURUSD (1H) based on the current chart structure. EURUSD recently shifted into a bullish phase after completing a prolonged corrective move inside a descending channel. Price respected the lower boundary of that channel multiple times, forming higher reactions from support and signaling weakening seller pressure. Eventually, buyers took control and triggered a strong impulsive breakout to the upside, decisively breaking above the channel resistance and accelerating higher. This impulse confirms a short-term bullish market structure and strong momentum from buyers. Following the impulsive rally, price pushed directly into a clearly defined Seller Zone / Resistance Level around 1.1880, where a fake breakout occurred. The sharp rejection from this area indicates that sellers are active near the highs and that the market may be temporarily overextended. Such behavior after a vertical move often signals exhaustion rather than immediate continuation. As a result, EURUSD is now showing signs of a corrective phase. The most logical scenario is a pullback toward the previous Buyer Zone around 1.1790, which aligns with the former resistance turned support and the broader Support Level marked on the chart. This zone represents a key area where buyers previously stepped in aggressively, making it a natural magnet for price during a retracement. My scenario: after the strong impulse and rejection from the Seller Zone, EURUSD may continue to correct lower toward the 1.1790 support area (TP1). As long as price remains below the resistance and inside this corrective structure, a pullback remains the favored outcome. A clean reaction and stabilization from the support zone could later open the door for trend continuation to the upside. However, a failure to hold this support would increase the probability of a deeper correction. For now, this is a counter-trend pullback scenario within a broader bullish context, with sellers in control in the short term and buyers expected to re-enter at key support. Please share this idea with your friends and click Boost 🚀
Parallel Channel

Gold Roadmap | Short-termAs Gold( OANDA:XAUUSD ) blasts through the $5,100 barrier on January 26, 2026, captivating investors worldwide, the surge reflects a perfect storm of global uncertainties and economic shifts.
Key Fundamental Reasons:
Geopolitical Tensions: Rising tensions in the Middle East due to US actions over the past few days, as well as President Trump's threat to impose 100% tariffs on Canada
Central Bank Buying: Continued accumulation by central banks, including China's $4B acquisition of a miner, to diversify reserves amid economic risks.
Weakening US Dollar( TVC:DXY ): Dollar's decline against currencies like the yen, fueled by intervention risks, making gold more attractive.
Interest Rate Expectations: Anticipated Fed rate cuts (at least two quarter-point reductions) reduce the opportunity cost of holding non-yielding gold.
Economic Uncertainty: Fears of slowdowns, inflation persistence, and potential U.S. government shutdowns drive investors to gold as a store of value.
Let’s take a look at the technical setup for gold on the 1-hour timeframe. Stay with me!
To start, as I’ve mentioned in previous ideas, assets hitting all-time highs make technical analysis challenging due to the lack of historical data. Therefore, my goal is to identify key zones that can assist in trading gold. Recently, gold has risen significantly due to fundamental factors and policymakers’ statements.
Gold has created a new gap($5,003.70-$4,987.54) at the start of this week, indicating what might be considered a gap party (a playful note) due to multiple price jumps.
In the past nine days, Gold appears to have formed an ascending Channel, and within that channel, there is a smaller ascending Channel that can serve as support and resistance levels.
From an Elliott Wave perspective, it seems that gold is currently completing the microwave 4 of the main wave 5, and this main wave 5 appears to be extended.
I expect that gold will start to rise again from the lower line of the small ascending Channel and move toward the Potential Reversal Zone(PRZ) . After reaching that zone, we might see a pullback, depending on news and geopolitical developments.
What do you think about gold’s bullish trend? How far can it go before a correction begins?
I’d love to hear your thoughts on gold. How long do you think it can maintain this bullish trend?
💡 Please respect each other's opinions and express agreement or disagreement politely.
📌 Gold Analyze (XAUUSD), 1-hour time frame.
🛑 Always set a Stop Loss(SL) for every position you open.
✅ This is just my idea; I’d love to see your thoughts too!
🔥 If you find it helpful, please BOOST this post and share it with your friends.

GOLD - The market bought the dip. ATH retest. 5150?FX:XAUUSD , after an aggressive rally, faced a correction (profit-taking) near 5100. However, the market is quickly buying back the decline and is once again storming the ATH with the aim of continuing its growth.
Fundamental situation
- Trump continues to escalate relations with Canada (new tariffs) and maintains tensions with the EU...
- Russia-Ukraine negotiations in Abu Dhabi ended without result, which maintains geopolitical risks.
- The Fed meeting (decision on January 31) will be the main event of the week. Rates are expected to remain unchanged, but Powell's tone could cause volatility. However, the market expects two Fed rate cuts in 2026.
Technically, the market has the potential to continue its movement due to fundamental support.
Resistance levels: 5100, 5111, 5125, 5150
Support levels: 5075, 5055
In the current situation, it is logical to consider two scenarios:
- steady growth without pullbacks and a storming of resistance could lead to a breakout of 5100 and an upward momentum. Local target 5125-5150
- retest of the liquidity zone (long-squeeze) 5075 - 5055 before continuing growth
Best regards, R. Linda!

USDJPY - Interventions strengthen the JPY (price decline)FX:USDJPY is in a negative rally phase, passing through the entire trading range, breaking through the daily timeframe support at 154.450 and closing below the level, hinting at a possible continuation of the decline.
The dollar is falling, the yen is strengthening. The Bank of Japan intervened, which contributed to the strengthening of the national currency. The current movement may continue...
The currency pair breaks through the fairly important support level of 154.500 (154.45) as part of the rally and closes below the level. Consolidation is forming on the local timeframe, which may be aimed at a further decline. A short squeeze in the 154.45 zone could trigger a decline to 153 - 151.8
Resistance levels: 154.45, 155.65
Support levels: 152.96, 151.85
A breakdown from the local consolidation could trigger a continuation of the decline, as could a retest of the nearest resistance (liquidity hunt).
The market still has the potential to continue falling to 151.85 and to the intermediate bottom of 149.5.
Best regards, R. Linda!

SLP Pump warning---Do not miss that 10XThe daily chart structure for SLP has been decisively broken, marking a potential shift following an extended multi-year downtrend. The significant decline observed over the previous five years may have established a long-term accumulation base, from which a sustained recovery can emerge.
Recent price action, supported by notably high volume and likely institutional (“whale”) accumulation visible on daily candles, suggests early signs of momentum reversal. Should this volume-backed breakout hold, the scale of the preceding decline could support a substantial upward revaluation.
Measured move projections from the breakout zone indicate a potential appreciation range of 5x to 10x over the medium to long term, provided the asset maintains its newfound support and continues to attract sustained buying interest.
DISCLAIMER: ((trade based on your own decision))
<<press like👍 if you enjoy💚

DOGE is super bullish in lower timeframes DOGE is displaying a confluence of bullish signals across timeframes. On the hourly chart, a decisive breakout above both a channel resistance and a descending trendline has occurred. Concurrently, the price is consolidating near a significant daily support level, adding further strength to the technical structure.
This multi-timeframe alignment suggests a high-probability setup for an upward move. The minimum measured technical target from this configuration projects approximately +30% upside from the current level.
For leverage traders , this presents a potential high risk/reward opportunity, provided entries are taken upon confirmed momentum and with strict stop-loss management below the daily support zone.
DISCLAIMER: ((trade based on your own decision))
<<press like👍 if you enjoy💚

GBPAUD higher bearish from here for expect
OANDA:GBPAUD price is break DESCENDING CHANNEL, from here just higher bearish to expect.
SUP zone: 2.00400
RES zone: 1.98100, 1.97400

BITCOIN - Consolidation below 90K. Weak marketBINANCE:BTCUSDT failed to break through the 90K area, and the market is forming a cascade of resistance, indicating the dominant position of sellers in the current circumstances.
The market still looks quite weak, and any attempts at growth are a hunt for liquidity. Global and local trends are bearish, with sales dominating (outflow of funds).
There is no fundamental support, the transfer of assets to crypto exchanges and the outflow of funds from ETF funds continues, which in general indicates weak market sentiment during the crypto winter. The current cycle is downward, and there is a possibility of a retest of the 80,000-75,000 zone.
Technically, Bitcoin is facing strong resistance at 89K and, unable to continue its growth, is rebounding and heading downwards. A short squeeze may form before the fall.
Resistance levels: 88,950, 89,590, 90,350
Support levels: 86970, 86100
If the bears keep the price below 89000, the market may fall to an intermediate bottom of 86000, however, closing below 86K could signal a further decline to 80K.
Best regards, R. Linda!

FTM [FANTOM] EWP TC FIB ANALYSIS WEEKLY TFFTM – Weekly Structure Overview
Price completed a clear 5-wave impulse from the 2020 low into the 2021/22 peak. Since then, the market has been unfolding a higher-degree A–B–C correction within a descending channel.
Wave B stalled in the typical 0.618–0.707 Fibonacci retracement zone, followed by an impulsive decline forming Wave C. The current selloff remains technically corrective and is approaching a strong confluence support area between the 0.5–0.618 retracements, aligned with long-term channel support.
Structure suggests late-stage correction, not trend failure.
A completed Wave C would open the door for a new primary impulsive cycle.
Key Takeaways:
• Macro trend remains structurally intact
• Current price action appears to be late-stage corrective behavior
• No bullish confirmation yet — but downside risk is approaching exhaustion levels
• Patience is required until Wave C completes and structure confirms
Like and follow for more charts like this.

Gold Breaks $5,000 — Momentum Meets CautionGold has just smashed through the $5,000/oz level, marking a historic breakout. The move is being powered by Fed rate-cut expectations and ongoing safe-haven demand amid global uncertainty.
Technically, price is riding a steep ascending channel, showing strong trend momentum — but RSI divergence is flashing early warning signs that bullish momentum could be running out of steam.
If gold holds above the lower channel trendline, the uptrend remains intact. But a breakdown here could trigger the first meaningful correction in weeks.

Usdchf long?This count is based on my assumptions so anything can happen not a trading or financial advice just for educational purposes only kindly do your own ta thanks trade with care good luck.

DXY [US$ INDEX] EWP TC FIB ANALYSIS MONTHLY TFDXY – Monthly Macro Structure
The U.S. Dollar Index continues to trade within a long-term descending macro channel originating from the 1985 Plaza Accord high. The 2001 and 2022 peaks both align precisely with this falling resistance, confirming a multi-decade pattern of lower highs.
The advance since the 2008 low appears corrective, forming a large W–X–Y structure rather than a five-wave impulse. The current recovery phase represents the final wave Y, now approaching confluence between declining channel resistance, horizontal supply, and Fibonacci retracement levels.
Momentum supports this interpretation. Monthly RSI shows clear bearish divergence relative to the 2022 high, indicating structural exhaustion rather than trend continuation.
If wave Y completes within this resistance zone, a decisive breakdown below the corrective structure would signal the end of the entire post-GFC dollar rally. Long-term technical projections point toward the 58 region, aligning with historical support and lower-channel targets.
From a macro perspective, current strength remains corrective until proven otherwise.
Like and follow for more charts like this.

GOLD - Waiting for a pullback to enter a long position...FX:XAUUSD continued its record growth for the sixth consecutive day, reaching $5,110. The driving forces behind this are geopolitical uncertainty, expectations of a softening of Fed policy, active purchases by central banks, and an outflow from the dollar...
Fundamental drivers
Geopolitics: Russia-Ukraine, Trump's threats of 100% tariffs on Canada, and the risks of further escalation with the EU...
The dollar fell to its lowest level since September 2025 due to interventions by the Bank of Japan and expectations of interest rate cuts. At the same time, central banks in many countries continue to show high interest in the metal.
The Fed's interest rate meeting is coming up (January 31 - February 1). The tone of the regulator is important; there are doubts about further rate cuts, and if this is confirmed, the market may enter a correction...
Resistance levels: 5110, 5150
Support levels: 5080, 5055, 5031
Technically, it is quite risky to open long trades from the current price position (in the 5090 zone). I recommend waiting for a correction to the specified support zones to find more profitable and safer entry points!
Best regards,

BAJAJ CONSUMER Buy This price broke out after 6 years..from a parallel pattern...tgt calculated as per pattern is 60% in 3 years...approximately...Note volumes also support this move..So buy

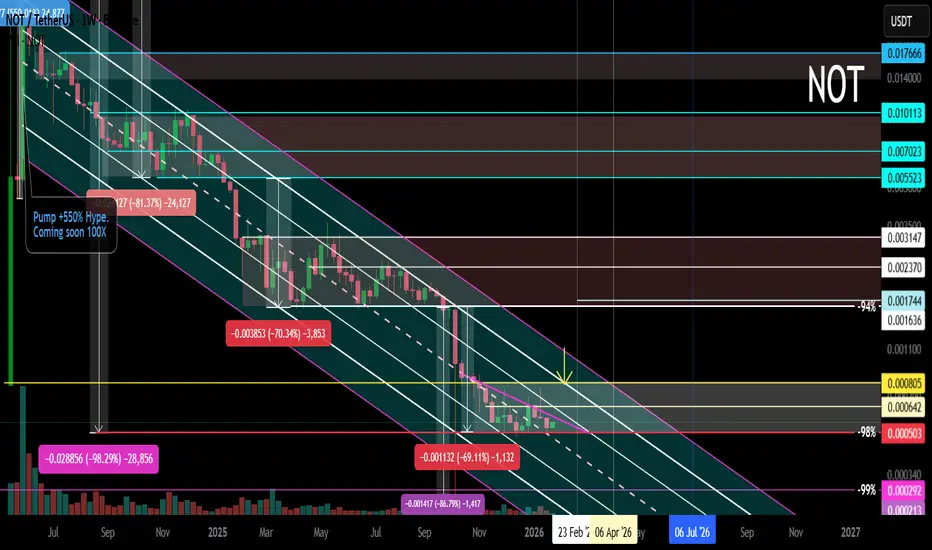
NOT Main Trend. Descending Channel -98% 01/27/2026Logarithm. Time frame: 1 week.
The price is in the main trend and remains in a downward channel with a given volatility range.
It's important to understand that the creators of this cryptocurrency always sell at any price (they're created for profit, fueled by hype). However, at low prices (-94-99%), a dilemma arises:
1️⃣ invent a reason for a scam and abandon the project;
2️⃣ or reverse the trend and temporarily restore faith in this scam cryptocurrency. In order to continue sales.
You can use this and profit from it. But, in the long term, you should be cautious with such assets. This applies to absolutely all cryptocurrencies created for hype and without any real future use. When trading such a dying former super-hype, manage your risks. This is the basic principle. If you can't do this, avoid it.
NOT Local trend. Sideways. -98%. Reversal zones 27 01 26
JPM – JPMorgan Chase (Daily)JPM is trading inside a well-defined ascending channel after a strong bullish rally.
Price has now pulled back sharply and is currently testing the lower boundary of the channel, making this a critical decision zone.
Technical Structure
• Primary trend: Bullish (as long as channel support holds)
• Pattern: Ascending Channel
• Moving Average: Price slightly below MA → short-term bearish pressure
Key Levels
• Major Support:
295 – 298 (Channel bottom)
• Next Supports if broken:
285 → 275
• Resistances:
315 → 325 → 335
Bullish Scenario (Primary)
If:
• Price holds above 295–298
• Reclaims the channel structure
➡️ This move would be considered a healthy pullback within an uptrend.
Upside Targets:
315 → 325 → Upper channel (~335)
Bearish Scenario (Alternative)
If:
• Daily close below the channel support
➡️ Bullish structure weakens and deeper correction becomes likely.
Downside Targets:
285 → 275
Final Takeaway
JPM is at make-or-break support.
Holding the channel keeps the bullish trend alive; losing it opens the door to a deeper correction.

XAUUSD Long: Bullish Trend Intact Below the $5,000 Supply ZoneHello traders! Here’s a clear technical breakdown of XAUUSD (1H) based on the current chart structure. Gold is trading within a well-defined bullish trend, supported by a clean ascending channel that has guided price higher from the lower levels. Earlier in the move, XAUUSD respected the lower boundary of the channel and formed a sequence of higher highs and higher lows, confirming sustained buyer control. During this advance, price entered a consolidation range, signaling temporary balance and accumulation before continuation. This range eventually resolved to the upside, triggering a strong impulsive breakout and accelerating bullish momentum. After the breakout, Gold pushed higher within the ascending channel and approached a major Supply Zone near the psychological 5,000 level. At this area, price showed hesitation and formed a fake breakout above resistance, indicating that sellers were active near the highs. Following this rejection, XAUUSD pulled back toward the mid-lower area of the channel, where previous resistance has now turned into a Demand Zone around 4,870. This zone aligns with channel support and a key structural level, making it an important area for buyer reaction. The recent dip into demand appears corrective rather than impulsive, suggesting a pause within the broader uptrend.
Currently, XAUUSD is trading above the demand zone and remains inside the ascending channel, with buyers defending structure. The market is compressing after the pullback, which often precedes continuation in trending conditions.
My scenario: as long as Gold holds above the 4,870 demand zone and continues to respect the ascending channel, the bullish bias remains intact. A renewed push higher could lead to another test of the 5,000 Supply Zone (TP1). A clean breakout and acceptance above this level would confirm trend continuation and open the door for further upside expansion. However, failure to hold demand and a breakdown below channel support would weaken the bullish setup and signal a deeper corrective phase. For now, structure and momentum continue to favor buyers. Manage your risk!

BTCUSDT: Buyers Defend 88,500 Support, Targeting 90,600 RetestHello everyone, here is my breakdown of the current BTCUSDT setup.
Market Analysis
BTCUSDT is trading within a broader corrective-to-recovery phase after a strong impulsive move earlier. On the left side of the chart, price was capped by a descending triangle resistance line, where multiple breakout attempts occurred, including fake breakouts, before buyers finally gained momentum. This breakout led to a sharp bullish impulse, pushing price into a clearly defined range zone between approximately 94,000 and 98,000, where the market transitioned into consolidation. After spending time ranging, BTC failed to hold the lower boundary of the range, resulting in a strong bearish breakdown and acceleration to the downside. This impulsive sell-off brought price into a key Support Zone around 88,500–88,800, where selling pressure weakened significantly. Buyers stepped in aggressively from this demand area, leading to a sharp rebound and the formation of a new ascending channel, signaling the start of a short-term bullish recovery structure.
Currently, price is respecting the upward channel, forming higher lows and showing gradual bullish pressure. BTC is consolidating just below the Resistance Zone around 90,600, which previously acted as a key level and is now being tested again. Price action near this level suggests compression and potential buildup rather than strong rejection, indicating that buyers are attempting to regain control.
My Scenario & Strategy
My primary scenario remains bullish as long as BTCUSDT holds above the 88,500–88,800 support zone and continues to respect the lower boundary of the ascending channel. A confirmed breakout and acceptance above the 90,600 resistance would validate continuation and open the path toward higher targets within the recovery structure.
However, if price breaks above resistance with momentum, continuation toward the next resistance levels becomes likely. However, if BTC fails to break higher and loses the ascending channel support, a pullback toward the support zone could occur for another potential reaction. A decisive breakdown below the support zone would invalidate the bullish recovery scenario and suggest a deeper continuation of the corrective move. For now, structure favors buyers while support and the ascending channel remain intact.
That's the setup I'm tracking. Thank you for your attention, and always manage your risk.

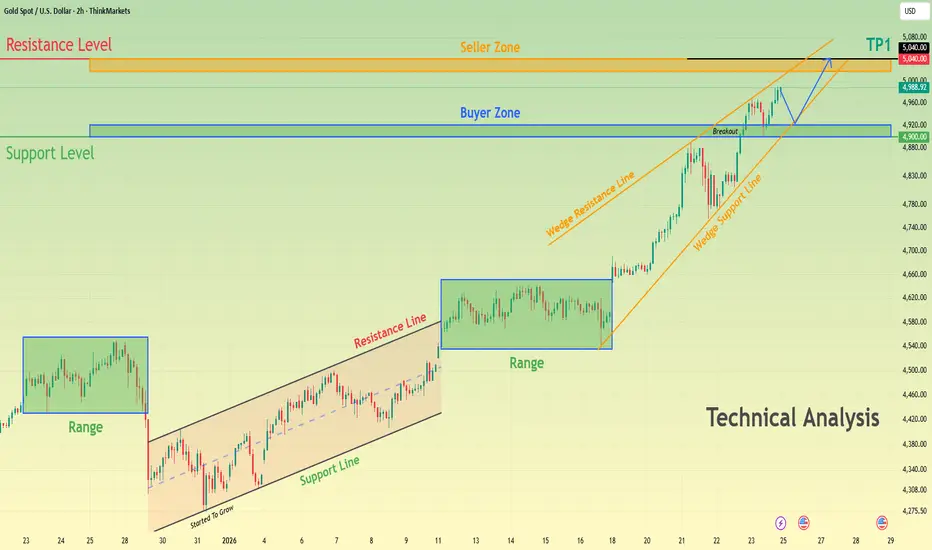
XAUUSD Bullish Structure Intact - $5,040 AheadHello traders! Here’s my technical outlook on XAUUSD (2H) based on the current chart structure. Gold continues to trade within a broader bullish context, maintaining a sequence of higher highs and higher lows. Earlier in the move, price spent a significant amount of time consolidating inside multiple range structures, indicating accumulation before continuation. After breaking out of the most recent range, XAUUSD accelerated higher and respected a rising trend structure, confirming sustained buyer control. This bullish impulse transitioned into a rising wedge formation, where price continued to climb while compressing between the wedge support and resistance lines. During this phase, pullbacks remained corrective, and buyers consistently defended higher support levels. Recently, Gold broke above the key Buyer Zone around the 4,900 level, confirming a successful breakout and acceptance above previous structure. This level has now flipped into support and aligns with the broader Support Level marked on the chart. Price is currently consolidating above this zone while respecting the wedge support line, suggesting continuation rather than exhaustion. Above the market, a well-defined Seller Zone and Resistance Level near 5,040–5,050 stands as the next major obstacle, where profit-taking or selling pressure may emerge. My scenario: as long as XAUUSD holds above the 4,900 Buyer Zone and continues to respect the rising wedge support, the bullish bias remains intact. I expect buyers to maintain control and attempt a continuation toward the 5,040 resistance area (TP1). A clean breakout and acceptance above this Seller Zone would confirm further upside continuation and open the door to new highs. However, a clear rejection from resistance could lead to a short-term pullback toward the Buyer Zone before the next directional move. A decisive breakdown below support would weaken the bullish structure and signal a deeper corrective phase. For now, market structure and momentum continue to favor buyers. Please share this idea with your friends and click Boost 🚀
GOLD - Test $5000... Will the rally continue?FX:XAUUSD closes Friday's session with a new record and consolidation after the rally. Focus on 4988 - 4968. The session closed quite favorably for continued growth, everything depends on Asian traders...
Fundamentals:
The tense situation between Trump and the EU over Greenland and tariffs is still present. The Bank of Japan intervened (which strengthened the yen), triggering a fall in the dollar, which in turn is affecting the price of gold. Overall, the market remains aggressively bullish.
New session:
- Fed meeting (January 31) – focus on Powell's tone. Softening rhetoric on inflation could weaken the dollar and support gold.
- Selection of a new Fed chair (announcement possible by the end of January) – candidates Waller or Warsh are perceived as more “dovish,” which could put pressure on the dollar.
- Geopolitics – any escalation with Iran will trigger a new influx into gold
Resistance levels: 4988, 5000, 5024
Support levels: 4967, 4958, 4945
Gold maintains its upward momentum, driven by a weak dollar and geopolitical risks. Any correction is likely to be limited.
Asian traders may buy up all the supply. A breakout and close above 4988 could trigger a continuation of the rally to 5025-5050. However, it is possible that the market may test support at 4958-4945 before rallying...
Best regards, R. Linda!

LTCUSDT - Hunting for liquidity before the fallBINANCE:LTCUSDT is consolidating below 70.0 before a possible continuation of the decline. The global trend is downward, liquidity is low...
After a sharp decline, the coin entered a consolidation phase, during which a cascade of support is observed, which may falsely indicate the presence of a buyer. The goal of such a maneuver may be to capture liquidity at 69.70 before falling to 65.0
Within the context of a downtrend and low liquidity, MM may form a retest of the 69.3-69.7 zone (liquidity area) to continue consolidation and further decline to 67-65.
Resistance levels: 69.30, 69.70
Support levels: 67.0, 65.3
A retest of the resistance and liquidity zone and the absence of bullish momentum may form a false breakout of the upper boundary of consolidation, which in turn may provoke a continuation of the decline towards both local targets and the global bottom...
Best regards, R. Linda!

BTCUSDT - The battle for 90K may end in a decline BINANCE:BTCUSDT , against the backdrop of Trump's speech and various comments, caused a shake-up within the range of 87,800-90,300, but the price is consolidating below key resistance within the current downtrend...
The downtrend may continue if Bitcoin consolidates below 90K. There is a chance of this happening as there is still no fundamental support for the market. Everyone is talking about the "CLARITY Act" on cryptocurrencies, but there is no date for its signing, and there are rumors that the process may be postponed until late winter or mid-spring, leaving the market without a bullish driver.
The market is experiencing a phase of struggle for the 90K resistance zone. Bears are stubbornly resisting, forming a false breakout and consolidation below resistance. The structure could be broken if there is an impulsive breakout of the 90,500 zone and the bulls are able to keep the price above this zone, but the bears have formed a fairly strong resistance zone.
Resistance levels: 90,400, 91,400
Support levels: 87800, 85000
I do not rule out another attempt to retest the 90350 zone, but if the bears keep the price below 90K, the market will have no chance for growth. In this case, a pullback to 89K - 88K can be considered.
Best regards, R. Linda!

Silver Miners Still Cheap!Silver Miners vs Silver chart (parallel channel)
The more the price of silver goes up, the more profit silver miners stand to make.
