GOLD - Consolidation ahead of news. Long squeeze?FX:XAUUSD is trading in the $4575-4600 range (consolidation) ahead of US inflation data (CPI) for December...
Inflation remains above the Fed's target (2%), making the data key to assessing the timing of rate cuts. XAU is consolidating below record highs. Profit-taking is observed ahead of the data release. Geopolitical risks and concerns about the Fed's independence support long-term demand for gold.
The reaction to CPI data may be short-term, as these factors remain a priority:
• Above forecast: dollar growth, gold correction to $4550 - 4520.
• Below forecast: dxy weakening, gold growth to $4650 - 4700
Gold retains its upside potential, but in the near term, its movement will depend on inflation data. Any correction can be seen as a buying opportunity amid ongoing geopolitical and monetary risks.
Resistance levels: 4600, 4630, 4650
Support levels: 4577, 4560, 4550
The initial retest of 4600 may end in a pullback, and a close below 4577 may trigger a decline to 4561 - 4550 before an attempt to grow (interest in the liquidity zone). However, against the backdrop of news reaction, gold may test 4550 - 4520 before continuing to rise. Very weak news may trigger a breakout of 4600 and an aggressive rally. It is important to monitor the context...
Best regards, R. Linda!
Parallel Channel

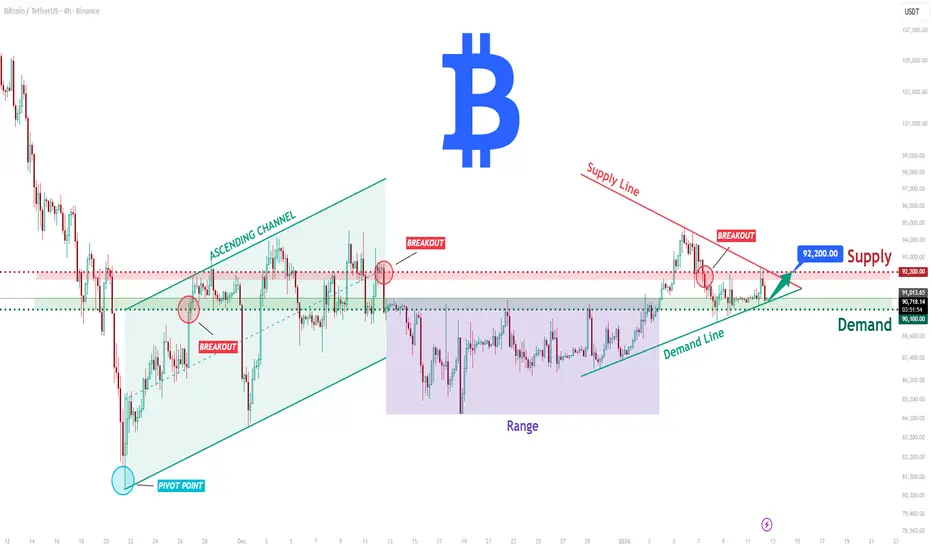
BTCUSDT Long: Demand Holding at 90,100 - Eyes on 92,200 SupplyHello traders! Here’s a clear technical breakdown of BTCUSDT (4H) based on the current chart structure. After a strong bearish move, BTC formed a clear pivot low, from which price transitioned into a bullish recovery phase. From this pivot point, the market developed a well-defined ascending channel, confirming a shift in market structure and increasing buyer control through a sequence of higher highs and higher lows. This channel guided price higher until BTC reached a key Supply Zone around 92,000–92,200, where selling pressure emerged. At this supply area, price experienced a rejection and breakout failure, indicating that sellers are actively defending this level. Following the rejection, BTC briefly broke below short-term structure and moved into a consolidation range, reflecting temporary balance between buyers and sellers. More recently, price has started to recover again, respecting a rising Demand Line, which signals that buyers are still defending the broader bullish structure.
Currently, BTC is trading between a key Demand Zone near 90,100–90,300 and the overhead Supply Zone around 92,200. This area represents a critical decision zone for the market, where the next directional move is likely to be defined.
My scenario: as long as BTCUSDT holds above the Demand Zone and continues to respect the rising demand trend line, the bullish bias remains valid. I expect buyers to attempt another push toward the 92,200 Supply Zone. A clean breakout and acceptance above this level would confirm bullish continuation and open the door for further upside. However, a strong rejection from supply followed by a breakdown below demand would weaken the structure and increase the probability of a deeper corrective move. For now, price remains in a compression phase between demand and supply — patience and proper risk management are key. Manage your risk!
EURJPY - NEW BREAKOUT!Hello traders,
the EURJPY has formed a descending channel.
Currently, the resistance line is broken!
Based on this breakout, I expect a bullish move.
🎯 TARGET: 185.500

ETHEREUM - Retest resistance before a possible declineBINANCE:ETHUSDT is trading within the range of 3050-3150, with a local and global bearish trend. The market is still waiting for positive drivers, and until they appear, it is possible to trade within the channels...
Against the backdrop of a global downtrend, Bitcoin is forming a bullish wedge/ascending triangle, which in the current circumstances I consider to be a consolidation pattern before a possible liquidation and decline to 80-75K, which in general could trigger a decline across the entire market. Ethereum is forming a trading range against the backdrop of a local downtrend.
Focus on trading boundaries, namely resistance at 3150
After a short squeeze and a price decline to 3060, a liquidity pool of 3060-3050 (area of interest for MM) has formed below the local level
Resistance levels: 3150 - 3181
Support levels: 3083, 3056, 3000
A retest of 3150 and a lack of momentum may confirm the dominance of bears in the market, which in turn may form a false breakout of resistance and a reversal to the zone of interest and liquidity pool 3050.
Best regards, R. Linda!

GOLD - Consolidation near 4600. Breakout or correction?FX:XAUUSD has updated its ATH to 4600. A local range is forming, with growth potential, against the backdrop of escalating geopolitical risks and concerns about the independence of the Fed, which remain.
Trump's consideration of military operations in Iran amid internal unrest and the tense situation in the Russia-Ukraine conflict (emergency UN Security Council meeting) create geopolitical risks.
Questions for the Fed: A criminal investigation has been launched against Chairman Powell, heightening concerns about pressure on the central bank's independence.
US employment data (NFP) for December (+50K) was weaker than expected, supporting expectations of Fed policy easing. Attention is shifting to December inflation data (CPI), which will assess the likelihood of a rate cut in March (current probability ≈30%).
The correction may continue, but the combination of risks and soft monetary policy creates medium-term support for further growth.
Resistance levels: 4600, 4625, 4650
Support levels: 4561, 4550, 4517
Since the opening of the session, gold has exhausted its intraday ATR reserve, which creates additional opportunities for consolidation or correction, within which the market may test key support zones, such as the previous ATH, before continuing to grow. A long squeeze of the specified support may provide the market with liquidity for further growth. However, an aggressive market could trigger a breakout of 4600 without correction...
Best regards, R. Linda!

USDJPY - Consolidation may turn into upward distribution FX:USDJPY is storming the resistance zone of the current consolidation. Focus on 157.88, a breakout of the current border could trigger an upward movement...
The Japanese yen is testing the intermediate bottom, hinting that the currency is preparing to continue falling. Against the backdrop of a weak yen and a strong dollar, the currency pair may continue its upward trend.
Retesting resistance, the reaction from the bears is weakening, and the bulls are trying to keep the price above 157.88. If there is no reaction (pullback), then growth may continue from the 157.15 - 157.88 zone, provided that the price closes above the level.
Resistance levels: 157.88
Support levels: 157.15, 156.18
Technically, against the backdrop of an uptrend, consolidation is forming, within which the market is not updating local lows, but is gradually contracting towards resistance at 157.88. There is a high probability of a breakout (possibly after a slight correction to local support). Nearest targets: 160.0 - 161.5
Best regards, R. Linda!

$TDOC – Moderate Uptrend and Potential BreakoutTDOC shows a moderate upward trend within a local ascending channel. A breakout to higher levels may occur ahead of the earnings release. As mentioned, it might present a trading opportunity.
I am not recommending buying or selling.

XRP - PICK YOUR FAVORITE COLOUR !!! Follow up from Sunday January 4th, a week ago. I warned everyone....
CHARTS ALWAYS LOOK OBVIOUS IN RETROSPECT !!
For the Weekly Chart to look OBVIOUS and look GOOD:
- there is a need for ONE LAST DUMP, a long wick SWEEP similar to Oct 10, except this time the candle will end up green with a large upper body surpassing the open of the candle.
- The Depth of that dump will have to be at the bottom of either the RED or GREEN or PURPLE Channels, indicated by the 3 highlighted green circles.
PICK YOUR FAVORITE COLOUR !!!
The Pump will not happen until:
- on the weekly chart, the RSI average is slopping up and is closer to the 50%. (Look at the previous pump)
- Black Rock, Fidelity, Vanguard, Morgan Stanley ETFs have a chance to buy a bottom very low
KEEP IT SIMPLE !!

CHFJPY - Pullback Into a Key Confluence!CHFJPY has been overall bullish , respecting the rising blue channel nicely over the past weeks.
Right now, price is pulling back into an important intersection:
the demand zone lining up with the lower blue trendline.
This is the kind of area where trends usually get tested, not broken.
As long as this confluence zone (highlighted by the blue circle) continues to hold, my bias remains straightforward:
I’ll be looking for trend-following long setups, preferably after confirmation on lower timeframes.
⚠️ Disclaimer: This is not financial advice. Always do your own research and manage risk properly.
📚 Stick to your trading plan regarding entries, risk, and management.
Good luck! 🍀
All Strategies Are Good; If Managed Properly!
~Richard Nasr

EURUSD Long: Bulls Defend 1.1620 Demand, Targeting Supply 1.1680Hello traders! Here’s a clear technical breakdown of EURUSD (2H) based on the current chart structure. EURUSD initially traded within a well-defined range, where price moved sideways for an extended period, reflecting a balance between buyers and sellers. During this consolidation phase, the market attempted several breakouts, including a fake breakout to the upside, which signaled weakness and lack of bullish continuation. Eventually, price achieved a valid range breakout, initiating an impulsive bullish move. Following this breakout, EURUSD reached a pivot point, where bullish momentum stalled and sellers began to step in. From this pivot high, price structure shifted into a descending channel, characterized by a series of lower highs and lower lows, confirming short-term bearish control. Price respected the channel boundaries well, indicating an orderly corrective move rather than panic selling. As EURUSD continued lower, it approached a strong Demand Zone around 1.1620, which aligns with a rising higher-timeframe trend line. This confluence area acted as a key support, where buyers responded aggressively. From this demand zone, price broke out of the descending channel, signaling weakening bearish momentum and a potential shift back toward bullish control.
Currently, price is reacting positively from demand and attempting to move higher. The next key level to watch is the Supply Zone around 1.1680, where previous selling pressure is expected to reappear. This level also coincides with prior structural reactions, increasing the probability of a pause or rejection.
My scenario: as long as EURUSD holds above the 1.1620 Demand Zone and respects the rising trend line, the bullish bias remains valid. I expect buyers to push price toward the 1.1680 Supply Zone, where a reaction or short-term pullback may occur. A clean breakout and acceptance above supply would confirm bullish continuation. However, a strong rejection from supply or a breakdown below demand would increase the probability of bearish continuation. For now, price is at a key decision area, and disciplined risk management is essential. Manage your risk!

XAUUSD Long: Demand Defended - Bulls Prepare for Push To $4,530Hello traders! Here’s a clear technical breakdown of XAUUSD (3H) based on the current chart structure. Gold is trading within a well-defined ascending channel, confirming sustained bullish control and a strong trending environment. Price has consistently respected both the channel support and resistance, forming higher highs and higher lows. This structure highlights healthy momentum rather than an exhausted move.
Earlier, XAUUSD pushed into the Supply Zone around 4,500–4,530, where selling pressure appeared and price experienced a sharp rejection. This rejection led to a corrective pullback, during which price briefly broke below short-term structure before finding support at the Demand Zone near 4,400. This area aligns with the channel support and acted as a key reaction level. Within the pullback, price formed a Head and Shoulders–type corrective pattern, which completed near demand. Instead of continuation lower, sellers failed to follow through, and buyers stepped in aggressively. Price reclaimed structure with a clean breakout back above local resistance and the rising Demand Line, signaling that the move lower was corrective rather than a trend reversal. Currently, XAUUSD is holding above the 4,400 Demand Zone and continues to respect the ascending channel. Price is consolidating and building higher lows, suggesting accumulation before the next impulse.
My scenario: as long as Gold holds above the demand zone and the rising demand line, the bullish structure remains intact. I expect buyers to defend this area and push price toward the 4,530 Supply Zone (TP1). A clean breakout and acceptance above supply would confirm bullish continuation and open the door for further upside expansion. However, a decisive breakdown below the demand zone would weaken the structure and increase the risk of a deeper correction. For now, the trend favors the bulls, with demand holding and momentum gradually rebuilding. Manage your risk!

GBPJPY: Breaking Another High 🇬🇧🇯🇵
GBPJPY is breaking another high after a consolidation
and accumulation within a horizontal channel on a daily.
The market will most likely continue rising.
The next strong resistance will be 213.5.
For extra confirmation, I recommend waiting for a daily
candle close above the underlined structure before you buy.
❤️Please, support my work with like, thank you!❤️
I am part of Trade Nation's Influencer program and receive a monthly fee for using their TradingView charts in my analysis.

EURUSD: Fake Breakout at Resistance Targets 1.1600 SupportHello everyone, here is my breakdown of the current EURUSD setup.
Market Analysis
EURUSD previously traded within a well-defined upward channel, respecting both the rising support and resistance lines, which confirmed a short-term bullish structure. During this phase, price produced a series of higher highs and higher lows, showing steady buyer control. This bullish move eventually led to a breakout into a broader range, where price action shifted into consolidation, reflecting temporary balance between buyers and sellers.
Currently, EURUSD is trading below the key Resistance Zone and is moving toward the Support Zone near 1.1600, which aligns with prior demand and a structural reaction area. The sharp rejection from resistance suggests that the recent bullish move was corrective rather than impulsive, and momentum has now shifted in favor of sellers.
My Scenario & Strategy
My primary scenario: as long as EURUSD remains below the 1.1690 Resistance Zone, the bearish bias remains valid. I expect price to continue its downside move toward the 1.1600 Support Zone, which acts as the first key downside target. Acceptance below this support would open the door for further bearish continuation toward lower levels.
However, a strong bullish reclaim and acceptance back above the resistance zone would invalidate the short scenario and signal a potential return into the range. For now, sellers are in control after the fake breakout, and price action favors further downside as long as resistance holds.
That’s the setup I’m tracking. Thank you for your attention, and always manage your risk.

Gold Defends Buyer Zone, Upside Toward 4,550 in FocusHello traders! Here’s my technical outlook on XAUUSD (3H) based on the current chart structure. Gold previously traded inside a well-defined range, where price moved sideways for an extended period, showing balance between buyers and sellers. This consolidation acted as an accumulation phase and marked the point where the market started to grow. A strong breakout to the upside from the range confirmed renewed bullish interest and initiated an impulsive move higher. Following the breakout, price respected a rising Support Line, forming a clear sequence of higher highs and higher lows, which confirms a bullish market structure. During this phase, XAUUSD advanced steadily within an ascending channel, with pullbacks remaining shallow and corrective — a sign of strong buyer control. As gold pushed higher, it reached the Seller Zone / Resistance Level around 4,550, where selling pressure emerged. Price reacted from this level and pulled back, indicating that sellers are actively defending this resistance. The pullback, however, remained controlled and corrective, with price returning toward the Buyer Zone, which aligns with a key Support Level around 4,400 and a previous breakout area within the broader bullish structure. Currently, XAUUSD is holding above the Buyer Zone and the ascending support line, showing that buyers are still defending structure. The recent price action suggests consolidation rather than a breakdown, keeping the bullish scenario valid as long as support holds. My scenario: as long as XAUUSD remains above the Buyer Zone and respects the rising Support Line, the bullish bias remains intact. I expect buyers to defend this area and attempt another push toward the 4,550 Resistance Level (TP1). A clean breakout and acceptance above resistance would confirm bullish continuation and open the door for further upside. However, a decisive breakdown below the Buyer Zone would weaken the structure and increase the probability of a deeper corrective move. For now, price is at a key decision area, and patience with proper risk management is essential. Please share this idea with your friends and click Boost 🚀

ISMQ is testing resistance level - Waiting for breakout !Weekly chart, the stock EGX:ISMQ is drawing an ascending channel, and is trying to break the resistance line R.
Above 7.60 for 2 weeks, the target will be 10.1 - 10.3
Near stop loss is 7.00
Below 7.00, the support will be line S (then, a price action around 6.60 - 6.50)
So, a new entry should be above R breakout (closing above 7.60 for 2 weeks), or after a price action at 6.50 - 6.60 and rebound.

XAUUSD Rising Support Holds - Next Target 4,500 ResistanceHello traders! Here’s a clear technical breakdown of XAUUSD (4H) based on the current chart structure. After a prolonged consolidation phase, Gold was trading inside a well-defined range, indicating balance between buyers and sellers. This range acted as an accumulation zone before price initiated a bullish expansion. Following the breakout from the range, XAUUSD entered an ascending channel, confirming a shift toward buyer control with a sequence of higher highs and higher lows. During this phase, price respected both the channel support and resistance lines, using them as dynamic structure levels. As price approached the upper boundary of the channel and the Resistance / Seller Zone around 4,500–4,510, bullish momentum started to weaken. Multiple fake breakouts above resistance signaled strong selling pressure at the highs. This led to a sharp corrective move lower, where price broke below short-term structure before finding support. Currently, XAUUSD is holding above the Buyer Zone around 4,400, which aligns with a key Support Level and a prior breakout area. Price has already shown a reaction from this zone and is now forming higher lows along a newly respected rising support line, suggesting buyers are attempting to regain control. The recent breakout back above local resistance reinforces the idea of a corrective pullback rather than a full trend reversal. My scenario: as long as XAUUSD holds above the 4,400 Buyer Zone and respects the rising support line, the bullish bias remains valid. I expect buyers to defend this area and attempt another push toward the 4,500 Resistance / Seller Zone (TP1). A clean breakout and acceptance above this level would confirm bullish continuation and open the path for further upside. However, a decisive breakdown below the buyer zone would weaken the structure and increase the risk of a deeper correction back toward lower support levels. Please share this idea with your friends and click Boost 🚀

POLUSDT Relief Bounce vs Bearish ContinuationPOLUSDT remains in a well-defined falling channel, with overall structure still favoring downside continuation. Price is currently staging a relief rally, pushing into a crucial supply zone that will act as a major decision area. A clear rejection from this zone would align with the prevailing bearish structure and favor continuation toward the highlighted downside targets. Conversely, a successful break and acceptance above supply could invalidate the bearish channel and trigger a stronger upside rally.
Reaction at this level will be key in determining the next directional move.

CVX | Houston, We Have A Problem | LONGChevron Corp. engages in the provision of oil and gas energy solutions. It provides crude oil and natural gas, manufactures transportation fuels, lubricants, petrochemicals, and additives, and develops technologies that enhance business and the industry. It operates through the Upstream and Downstream segments. The Upstream segment consists of the exploration, development, and production of crude oil and natural gas, the liquefaction, transportation, and regasification associated with liquefied natural gas, the transporting of crude oil by major international oil export pipelines, the processing, transporting, storage, and marketing of natural gas, and a gas-to-liquids plant. The Downstream segment consists of the refining of crude oil into petroleum products, the marketing of crude oil and refined products, the transporting of crude oil and refined products by pipeline, marine vessel, motor equipment, and rail car, and the manufacturing and marketing of commodity petrochemicals and plastics for industrial uses and fuel & lubricant additives. The company was founded on September 10, 1879 and is headquartered in Houston, TX.

GOLD - Storm 4475 ahead of the news. NFP aheadFX:XAUUSD is stabilizing at 4475 in a state of consolidation. However, ahead lie US employment data and the Supreme Court's decision on Trump's trade powers...
Fundamentals:
60K new jobs are expected to be created in December, unemployment may fall to 4.5%, and wage growth to 3.6% y/y. As for the Supreme Court, it will decide whether Trump can impose tariffs without Congress' approval (IEEPA law).
The market also continues to expect 2-3 interest rate cuts in 2026. Geopolitical tensions are supporting demand for defensive assets.
Today, the market is waiting for NFP. Strong data will lower expectations of Fed easing, strengthen the dollar, and put pressure on gold (to $4300), but weak NFP data will reinforce bets on rate cuts and support gold (to $4550). The court's decision on tariffs will affect trade policy and the dollar.
Resistance levels: 4475, 4500, 4525
Support levels: 4460, 4442, 4427
A breakout and consolidation above 4475 could open the way to 4500, a breakout of which could trigger a rally to 4525-4550, but given the volatility of the news, the market may test the support zone before a possible rise.
Best regards, R. Linda!

BTCUSDT Long: Holding Above Demand, Eyes on 91,800 RetestHello traders! Here’s a clear technical breakdown of BTCUSDT (3H) based on the current chart structure. BTCUSDT initially traded within a well-defined descending channel, where price consistently respected the lower highs and lower lows, confirming strong bearish pressure. This bearish structure eventually reached a key pivot point, from which price reversed and broke out of the descending channel to the upside. This breakout marked a structural shift and initiated a new ascending channel, signaling a transition from bearish to bullish control. Following this rejection, BTCUSDT moved into a range, highlighting temporary equilibrium between buyers and sellers. From this range, price attempted another push higher, once again testing the supply zone. The most recent price action shows rejection from the same area, reinforcing the importance of this resistance.
Currently, BTCUSDT is consolidating between clearly defined Demand (~89,600) and Supply (~91,800) zones after transitioning from a descending channel into an ascending structure. Despite the recent rejection from the supply zone, the overall market structure remains bullish as long as price holds above the key demand area.
My primary scenario: long bias remains valid as long as BTCUSDT holds above the 89,600 Demand Zone and no strong bearish acceptance occurs below this level. I expect buyers to continue defending the demand area, forming a higher low or showing a clear bullish reaction (long lower wicks, impulsive bounce, or an internal break of structure). Once buyer strength is confirmed, a move toward: TP1: a retest of the 91,800 Supply Zone. TP2: in case of a clean breakout and acceptance above 91,800, continuation toward new local highs. Manage your risk!

EURUSD Rejection From Key Resistance, Target 1.1640Hello traders! Here’s a clear technical breakdown of EURUSD (1H) based on the current chart structure. After a strong bullish impulse earlier, EURUSD transitioned into a corrective phase and started trading inside a well-defined descending channel, indicating controlled bearish pressure rather than an aggressive sell-off. Price respected both the channel resistance and channel support, confirming the validity of this corrective structure. On the left side of the chart, we can see a breakout from a prior consolidation, followed by an impulsive bullish move. This rally eventually stalled and turned around near the upper highs, where selling pressure emerged and pushed price into the descending channel. During this phase, multiple reactions from the channel boundaries showed balanced participation from both buyers and sellers. As price moved lower, it approached the highlighted Seller Zone / Resistance Level around 1.1680. A short-term fake breakout above channel resistance occurred, but buyers failed to hold acceptance above it, signaling that sellers are still active at higher levels. Price then continued lower within the channel. The primary bearish scenario comes into play if EURUSD fails to hold above the 1.1680 Resistance / Seller Zone and shows clear rejection from this area. This zone aligns with the descending channel resistance, making it a high-probability area for sellers to step in. If price retests the 1.1680–1.1700 resistance area and forms bearish rejection signals (long upper wicks, bearish engulfing candles, or failure to hold above channel resistance), it would confirm that the move higher is corrective in nature. In this case, sellers are likely defending the structure and maintaining overall bearish control. Once rejection is confirmed, I expect price to resume its move lower inside the descending channel, targeting the 1.1640 Buyer Zone / Support Level as the first downside objective (TP1). A clean break and acceptance below this support would strengthen bearish momentum and open the path toward lower support levels, extending the correction further. However, if price breaks and holds above the descending channel resistance and the 1.1700 level, the short scenario becomes invalid, signaling a potential trend shift or deeper bullish continuation. For now, the market remains in a corrective bearish structure, and shorts are favored on pullbacks into resistance, as long as price stays below the key resistance zone. Please share this idea with your friends and click Boost 🚀

SOLANA - retest resistance of the trading range BINANCE:SOLUSDT has been rising since the session opened amid a weak market. The altcoin is showing bullish momentum in a predominantly bearish market, with a focus on the 145.0 zone.
Bitcoin is rebounding from resistance amid a global downtrend. There is currently no bullish potential (across the entire market), which is putting pressure on altcoins overall.
SOL, against the backdrop of a neutral market, is seeking to test the resistance zone of 144.7 - 146.0 - a key liquidity zone that plays an important role for MM in the current circumstances.
A short squeeze and the formation of a reversal pattern could shift the imbalance towards sellers, which in turn could lead to a decline.
Resistance levels: 143.4, 144.7, 146.0
Support levels: 134.3, 127.55
Solana is trading in a neutral trading range of 145.0 - 123.0. The main trend is bearish. The bullish run and retest of resistance can be perceived as a hunt for liquidity. We are interested in the above-mentioned resistance zone and confirmation in the form of a false breakout to enter the market.
Best regards, R. Linda!

GOLD - Correction and retest of support on a bullish trend FX:XAUUSD is forming a correction from the resistance level of 4500 and reaching a local low of 4415. Against the backdrop of DXY growth, the correction may continue. The market is awaiting economic news...
Mixed US data: JOLTS job openings fell to 7.146 million. ADP employment rose by 41,000. The ISM services index rose to 54.4, which is higher than expected.
Expectations for two Fed rate cuts in 2026 remain (≈61 bps). The fundamental backdrop is mixed, with additional confirming data needed.
Geopolitics supports demand: the US has confirmed negotiations on the acquisition of Greenland. China has imposed a ban on the export of dual-use goods to Japan. The focus is shifting to Friday's US employment report (NFP).
The correction in gold appears to be temporary amid continuing expectations of Fed policy easing and geopolitical tensions. The NFP report will be the decisive factor in determining the direction — weak data could trigger a new round of growth.
Resistance levels: 4442, 4475, 4497
Support levels: 4427, 4400
As part of the correction, gold may test the support zone of 4425-4400. Overall, the trend is bullish, and the market correction may be temporary. A false breakdown and the bulls holding the price above key zones could trigger growth towards the flat resistance.
Best regards, R. Linda!
