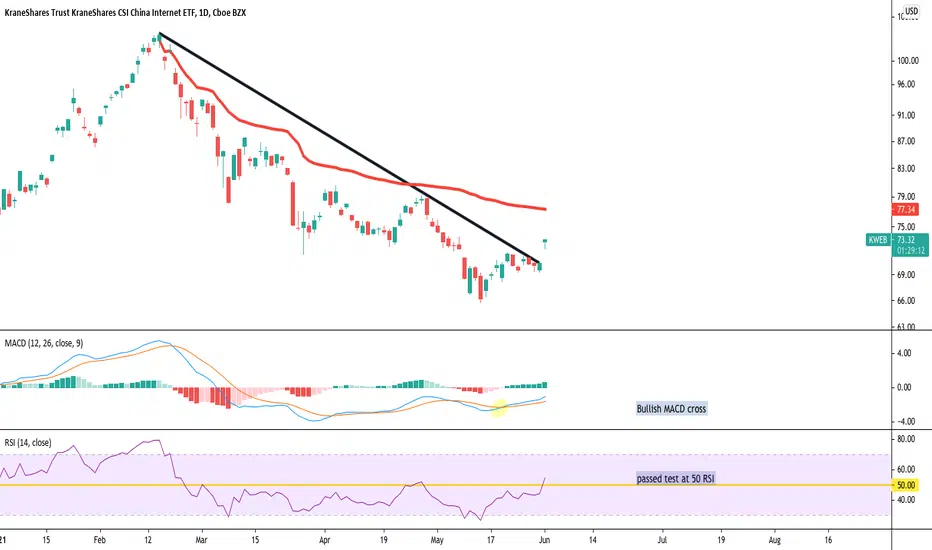
go long KWEBtrading below its VWAP from the previous high, Emerging Markets expected to outperform this year, KWEB is a good way to focus exposure in China while getting a diverse basket of high growth names that are titans over there with names like Alibaba, Tencent, Pinduoduo, Baidu, and JD.com.
Diversification is key especially as US markets top out in the near term
PDD
PDD Bullish Along with Chinese Tech.$PDD: Falling wedge pattern, this might take a little bit of time to marinade. We are tactically overweight on Chinese Tech as inflation is on the rise. China's economy is slated to rebound quickly and this stock is at a 40% discount from its highs! We think this is a high conviction name for recovery and have seen unusual options activity with this name the past 1-2 weeks! Setup is invalidated if it breaks below 110.

PDD - GREAT Short Opportunity, IF ... !!Hello! Friends,
- This would be a great short Opportunity, IF NASDAQ:PDD breaks down the Daily Support line at $124.00 (with a WHOLE DAILY Candle) !!

PDD: You should be aware of this chart pattern!Hello traders and investors! Let’s talk about PDD today! It is the first time I analyze this stock, and I hope my insights can be helpful. In this analysis, I'll present you two strategies to follow.
First, in the 1h chart, we have a Descending Triangle chart pattern, and the trend is clearly bearish, as the 21 ema is pointing down, and the price can’t trade above it.
This makes the situation more favorable to the bears, at least in the short-term , and as long as we don’t see a clear breakout upwards from this Triangle, the bear trend will persist. This Triangle is the best chance PDD has to reverse this bearish sentiment.
Now, there’s two strategies we can use. First, if we see an upwards breakout, second, if we see a downwards breakout. Either way, this Triangle is the key, and the targets are better seen in the daily chart:
If PDD breaks this Triangle downwards, then it’ll just seek the next support level, and the most meaningful support is the red line at $ 121.28. Then we’ll see how to proceed. Maybe PDD will lose this line, or it could do a nice candlestick pattern and trigger a possible Double Bottom pattern – we can’t know for now.
On the other hand, if PDD does an upward breakout from the Triangle in the 1h chart, the next resistance is the target, which is at the green line ($ 152.06). This is also a pivot point , and the trigger of an Inverted H&S chart pattern , as evidenced by the green area. If triggered, this pattern will officially reverse the trend in the mid-term , and PDD would have a first target at $ 188 , and it could go even higher, above $ 200.
Since PDD is dropping with low volume , this makes me wonder if this bearish movement will have the strength to persist.
Either way, we must keep watching PDD closely, and if you liked this analysis, remember to follow me to keep updated with my daily studies, and please, support this idea with your like!
Thank you very much!

PDD short position ideaPDD formed a head and shoulder patter in the past few months. it broke the neck line ($133.88) on 24/3/2021.
Today just retested the same neck line but failed to break out. Right now would be a good point for short position.
Target price is at $60.8 but pay attention to the red line. It could be act as support.


go Long on PindoodooWith Alibaba and the other Large Cap tech giants in China coming under heavy scrutiny and anti-trust regulation opens up the door for PDD to take off and assume a lot of market share. Tencent and BABA tower over PDD which is only a Mid Cap company. Taking into account the law of large numbers, a mid cap company has much more Alpha potential albeit with slightly more beta.
20 day MA just broke through the 50 day MA on the news and I expect this trend to continue as the story plays out. China wants to fight the giants to make room for the little guys; well here's a medium sized company that you don't have to worry about its business plan failing altogether.
Pinduoduo, or Pindoodoo as I like to call them, are integrated in almost every facet of life in China either in the forefront or behind the scenes. Go long! #LongandStrong


Why i will sell pdd.The high has formed, the bears are about to push it down. remember to sell highs.

PDD in healthy consolidation, two scenarios going forwardPDD has been consolidating since the earning jump. The consolidation is very healthy in that: 1. price is tightening, a ascending triangle and a bullish flag is emerging on the chart; 2. Volumes patterns give me high confidence, up on strong volume while down days are often in low volume.
Going forward, there are two key levels to watch:
1. $145, which has been a resistance twice. Also note that the controlling volume after earning is right at 145.
2. $116, this is the top before the gap. There is a chance that the gap may be filled if the market corrects. In addition, PDD's price strength is weakening as can be seen in the MACD and MFI at the bottom of the chart.
Keeping the two levels in mind, I see two scenarios:
1. We keep consolidating for more weeks, and then breakout the 145 resistance. If this happens, I'd not be surprised by a double digit run.
2. The price weakness exacerbates and PDD does a cup, attempting to fill the gap, and then rebound and resume the bull trend.
I think the two scenarios are equally likely, although I'd prefer to see the second, because it gives us a fimer base to work with. Also the gap gives us a hint on the potential bottom of the cup so we may get a better entry point.
Best luck investing!

PDD - inside daily candle - 11/16/2020set you alerts at Today's high/low. if it breaks with volume , expect it to continue on to the target set on that side of the break.
#PDD $PDD

PDD daily inside candle - 11/6/2020set alerts monday on today's high/low. if it breaks with volume play it to the target in that direction
#PDD $PDD

PDD long in the short termPDD down from 100$ to 72$.
Today having a doji candle exactly on previous support line. It might serve as reversal.
In addition, RSI is at 30 which indicate oversold.
Buy @ 75$
Stop < 72$


PDD BUY OR LONG , TARGET UP TO $135PDD will confirm the " Ascending Triangle " pattern at $101. I will Long (Buy) when the price breack out to $101.
PDD buy : $101
PDD target : $130 +-2
Stop loss auto : 8%
Wish you a good deal!

Pinduoduo- E-commerce outperforms and boomsE-commerce will continue to have strong CAGR as the brick and mortal stores fold under the pressure and the whole world becomes even more digitalized in the future.


