Bitcoin can rebound up from support line of pennant to 65K pointHello traders, I want share with you my opinion about Bitcoin. Looking at the chart, we can see how the price some time ago entered to range, where it at once reached a resistance level, which coincided with the seller zone and then rebounded down to the bottom part of range. After this movement, the price in a short time rose until to top part of the range, but soon turned around and started to decline inside the downward pennant. Later BTC quickly declined until to support level, which coincided with the buyer zone, thereby breaking the 68500 level and also exiting from range. Soon, the price broke the 57500 level too and dropped to the support line of the pennant, after which at once made a strong impulse up. After this movement, BTC broke the support level one more time and some time traded near this level. Next, it reached the resistance line of the pennant pattern, but not a long time ago fell back. At the moment, it trades near the support line of the pennant and I think that the price can make a small movement up first and then correct to the support line again. Next, Bitcoin will rebound up from this line, exit from the pennant, and continue to grow, therefore I set my TP at 65000 points. Please share this idea with your friends and click Boost 🚀
Pennant

Buy ITC aggressively CMP 492, Target-580 within a month.Technically we see a formation and breakout of Bullish Pennant chart pattern. Also we can confirm its strength from being continuously above all the short term averages even in market downside. ITC is a star performer and our last buy call at the bottom price of 425 worked very well. At higher levels also, surprisingly again it is in buy radar after formation and breakout of a beautiful chart pattern.
Last month Quant Mutual Fund bought ITC shares worth 3,669 crores. This is a big plus news as Quant MF are trending in MF industry due to their good buying decision and consistently outperforming the market benchmark returns. All the big institutions and Brokerage house already gave the target of 550 plus and technically it is confirming the same.
We feel that still there is a lot of value unlocking left in this counter due to their multiple businesses working so well as compared to the peers in the respective industry and still it is just valued majorly on based of Tobacco business. Demerger going ahead is the key to value unlocking and this share can quote even value of 750-800 soon and this is not hypothetical figure but based on real possible valuation in near term as well. So, buy this stock aggressively and you might think that the stock in last month already gone up and you might wait for the dips which might cost you a good opportunity as the big hand may not give you the dips unless there is a big fall in nifty itself. With regards to Nifty, it can give strong positive contribution to nifty movement and support nifty if other nifty stocks correct.

GBPAUD1.GBPAUD has made a break of structure off of the Bearish Pennant Pattern.
2.The price broke the previous Lower High of the Pennant, which shows buyers taking over the market.
3.Now we place buys and hold as per take profit.
Lets take buys on GBPAUD

Bitcoin can drop to support level, exiting from pennantHello traders, I want share with you my opinion about Bitcoin. By observing the chart, we can see that the price some days ago rose in an upward channel, where it reached the support level, which coincided with the buyer zone and soon broke this level. Then BTC made a retest and at once rebounded up until to resistance line of the channel, which coincided with the resistance level with the seller zone. After this movement, the price made a little correction, after which broke the 65600 level, and some time traded near, and even made a fake breakout. Next, the price rose to 70000 points and started to decline inside the downward pennant, where it soon broke the resistance level, thereby exiting from the upward channel also. After this, BTC dropped until to support line of the pennant, breaking the 57100 level, but at once turned around and in a short time rose higher this level, breaking it one more time and reaching the resistance line of the pennant pattern. At the moment, the price trades near this line and I think Bitcoin can make movement up, thereby exiting from the pennant and then will fall to the 57100 support level, therefore I set my TP for this level. Please share this idea with your friends and click Boost 🚀

EURUSD1.EURUSD has been on a consolidation inside of the Bullish Pennant pattern.
2.It mwanaged to break out of the Pennant.
3.Now we waited for the retest, which really occured after a long wait.
4.Now we buy EURUSD without hisitation.

ETH.D Bearish PennantSelf-explanatory really - ETH Dominance, bear pennant. Statistically should break down.

INDIA CEMENT:- Momentum TradingINDIA CEMENT: Momentum Stock
This counter is showing VCP(Volatile Contraction Pattern).
This may see Momentum, when it crosses 275.
SL as 20 SMA (Weekly Close Below)
Disclaimer
The information and publications are not meant to be, and do not constitute, financial, investment, trading, or other types of advice or recommendations supplied or endorsed by Me.


Euro can leave pennant and continue to decline nextHello traders, I want share with you my opinion about Euro. Looking at the chart, we can see how the price some time ago started to trades inside range and at once reached the top part, after which started to decline. The price quickly fell to the 1.0815 support level, which coincided with the buyer zone, and some time traded between this level. After this, the Euro dropped lower 1.0815 level, breaking it, and also exited from the range, after which the price entered to upward pennant. In this pattern, EUR at once made a strong upward impulse from the support line to the resistance level, breaking the 1.0815 support level one more time. Next, the price broke the 1.0930 level, which coincided with the seller zone, and rose until to resistance line of the pennant, after which turned around and in a short time declined lower than the 1.0930 level, breaking it again. After this, the EUR tried to rise back, but when it entered to seller zone, it made a correction movement to support line of the pennant pattern. But a few moments ago it rebounded from this line and at the moment EUR trades near the resistance line. So, I think that the price can fall to the support line, after which bounces up to the resistance line and then continues to decline, exiting from the upward pennant as well. Therefore I set my TP at 1.0850 points. Please share this idea with your friends and click Boost 🚀

ripple road to $589, i see the lightive never understood how ripple fans found the $589 target... now i do.
explanation on screen

Bitcoin can exit from pennant and continue to grow to 63K pointsHello traders, I want share with you my opinion about Bitcoin. Observing the chart, we can see that the price some time traded in the range, where it fell to the resistance level, which coincided with the seller zone, and then rebounded up to the top part of the range. Then BTC turned around and dropped lower than the 66700 level, breaking it and some time traded in the seller zone. Later price continued to decline inside the downward pennant, and fell until to the 55000 support level, which coincided with the buyer zone and even broke this level. Next, BTC fell to the support line of the pennant, turned around, and in a short time rose to the 55000 level, broke it again, and continued to grow. But a not long time ago it made a correction to the support line of the pennant and then rebounded up to almost the resistance line, where at the moment continues to trades near. In my opinion, Bitcoin can make small movement down and then rebound up, higher than the resistance line, exiting from the pennant pattern. For this case, I set my TP at 63000 points. Please share this idea with your friends and click Boost 🚀

Bearish Signals on AluminiumAluminium versus the USD (ticker: XAL/USD) has traded southbound since reaching a high of $2,800, limited between a descending channel (extended from $2,800 and $2,475).
Adding to the bearish vibe, price action manoeuvred below trendline support, taken from the low of $2,110, and retested the underside of the ascending line to form resistance. What also might interest technical analysts is the head and shoulders top pattern (head at $2,800), which was completed in mid-July (neckline breached). Price has yet to reach the pattern’s profit objective at $2,131, therefore, further underperformance could be seen for the base metal this month. In addition to this, you may acknowledge the potential for a bearish pennant pattern to form (drawn from the high of $2,321 and $2,206).

Can AVAX continue down this path?Scenario casting #Avalanche versus #Ethereum
as we go forward into 2024
The blast off from the lows has to be respected and is a significant show of strength
and shames other blockchains price performance these past few weeks
I'm looking at you #Algorand & #HBAR

CEG has broke out of the pennant and is ready to RISEEThe pennant after the price run has broken out and is ready to rise

XDefi Wallet Second DiamondGATEIO:XDEFIUSDT
⏰ TimeFrame 1Day
👉 💎 Diamond reversal❓ or continuation❓
👉0,031-0,044
✔️Logarithmic (Log) Chart

nas100 Identifying Key Levels
The chart highlights several significant levels and zones that influence the current market behavior:
• PMH & PML: Previous Month High and Low, serving as significant resistance and support levels.
• PWH & PWL: Previous Week High and Low, indicating recent market highs and lows.
• PDH & PDL: Previous Day High and Low, indicating recent market highs and lows
• Daily FVG: Daily Fair Value Gap, indicating areas of market imbalance.
• BSL: Buy-side Liquidity, areas where buy orders are placed.
• SSL: Sell-side Liquidity, areas where buy orders are placed.
• Always wait for confirmation

Solana weekly bull pennant. This is what I see. I am long Solana and will hold until etf is approved. Happy trading.

IOC, Bull PennantPotential breakout from the Pennant,
Target at 194, Stoploss at 159
Disclaimer : I am a aspiring swing trader, i have only started to learn to catch the pattern. So, please take this only as a idea

DLF, Bull PennantPotential breakout from the Pennant,
Target at 962, Stoploss at 795
Disclaimer : I am a aspiring swing trader, i have only started to learn to catch the pattern. So, please take this only as a idea

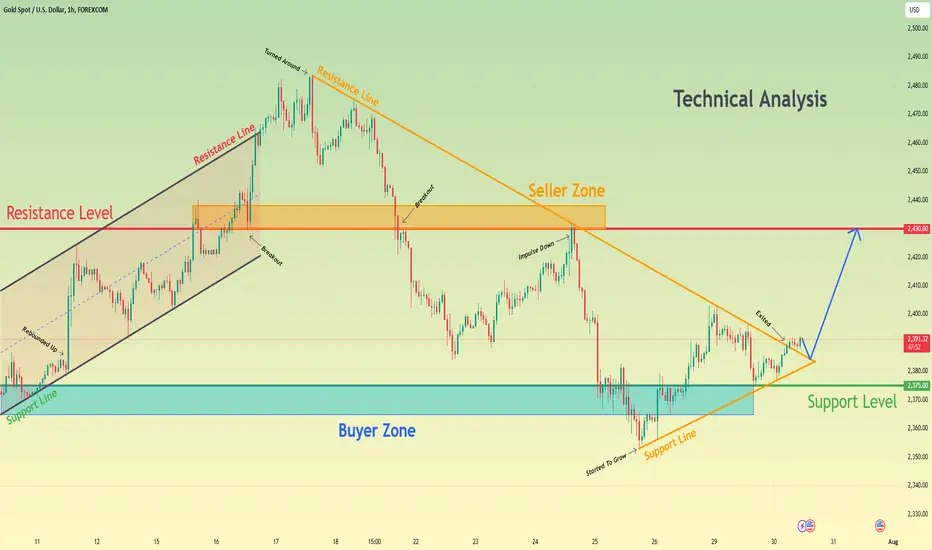
After exiting of pennant, Gold can make retest and continue riseHello traders, I want share with you my opinion about Gold. By observing the chart, we can see that the price started to grow inside the upward channel, where it rebounded from the support line at once and quickly rose to the resistance line. Then XAU made a correction to the support line, after which continued to grow inside the channel to the resistance level, which coincided with the seller zone. Soon, Gold broke the 2430 level and rose higher than the resistance line, thereby exiting from the upward channel. Next, the price entered to pennant, where it at once turned around and started to decline. In a short time, the price dropped lower 2430 level, breaking it, after which tried to grow but failed and declined more. Gold fell firstly to the 2375 support level, which coincided with the buyer zone, and soon broke it and fell until to the support line of the pennant. But then, the price started to grow from this line and in a short time rose higher than the 2375 level, breaking it and recently exited from the pennant also. At the moment, I think Gold can make a retest, after exiting from pennant and then continue to grow to the 2430 resistance level, therefore I set my TP at this level. Please share this idea with your friends and click Boost 🚀
Long trade
Pair XAUUSD
Buyside trade
Entry 2374.171
Profit level 2401.409 (1.15%)
Stop level 2366.891 (0.31%)
RR 3.74
Fri 26th July 24
5.00am LND Session

LONGING $NVDAWhy I am bullish on NASDAQ:NVDA
On the 4 hour timeframe:
- Retesting support zone
- Bottom of bullish pennant chart pattern
- Wick-to-body forecast is bullish
My personal trade:
Stop Loss / Take Profits:
- Entry: $118.00
- Take Profit: $136.16
- Stop Loss: $114.97
