Bitcoin can break resistance line of pennant and continue growHello traders, I want share with you my opinion about Bitcoin. Observing the chart, we can see that the price rebounded from the support line and started to rise to the resistance line, thereby breaking the 30000 resistance level, which coincides with the seller zone. After the price reached this line it bounced down and in a short time fell back to the support line, breaking the 30000 level again. Next BTC some time traded below and even later tried to rise back, but the price only reached the resistance level and then made a strong downward impulse until below the 25800 support level, thereby breaking resistance and support lines. Also, BTC entered to the pennant, where it soon bounced from the support line and rose higher of the 25800 support level. And now the price continues to trade inside the pennant close to the resistance line. Probably Bitcoin can break the resistance line, thereby exiting from pennatn, and then continue to rise. For this reason, I set up two targets, the first target at the 27500 and the second - at 28500 levels. Please share this idea with your friends and click Boost 🚀
Pennant

USDINR to drop to 75 levelsThis looks like a failed pennant breakout for USD. Very likely to see sharp reversals, next support is at Rs. 75 levels.

Silver ~ Snapshot TA / Bullish ConsolidationTVC:SILVER rallying to the upside & revealing its Bullish inclinations ahead of key Global Economic events.
Fibonacci Extension doing a great job identifying key Demand/Supply zones to watch for smaller-timeframe trend rejection/continuations.
Dashed horizontal lines (~25.26/~22.21) highlight key Make or Break levels for longer duration Swing Trades.
Golden Pocket/Gap Fill confluence presents interesting Stink Bid opportunity if Silver price action turns to disaster.
Boost/Follow appreciated, cheers :)
OANDA:XAGUSD COMEX:SI1! COMEX:SI2!

ONMOBILE: PENNANT FORMATIONNSE:ONMOBILE Is forming Pennant. The trade should be taken only after confirmation of pattern that is after closing of candle above pattern. Target and stoploss for the same are given

Hawaiian Electric ShortI doubled down on my short position on Hawaiian Electric ( NYSE:HE ), increasing it from 100 shares to 200, while also acquiring 9 puts with a strike price of $22.5 expiring in September. Additionally, I purchased 5 puts at a strike price of $12.5 expiring in December. The market rebound on Friday appeared to be a mere dead cat bounce, as indicated by technical analysis revealing the presence of bearish pennants. Consequently, my target price remains resolute at $6 per share.

Short Hawaiian Holdings - $8 TargetShort 100 NASDAQ:HA shares at $9.62; 10 puts, $10 strike, expiring Jan '24. TA indicates bearish pennants, possible fall to $8 mid-term. Goldman maintains sell, target $8.

XRP + XLM Local trend. Wedge + triangle (pennants).Logarithm. Time frame 1 day. Local trend.
Two cryptocurrencies are shown at the same time, as it should be understood that it is one and the same. Pumps (exit from accumulation) similarly began almost simultaneously July 13 on day 273 (code). XRP a little earlier by a few hours. I think it will be something similar this time.
Pullbacks after pumping up about +100% on both assets (exiting the long term accumulation zone). The reversal zones as well as the percentages to local significant resistance levels in case of breakout are shown on the chart.
This is how it looks on the linear without squeezes (market noise), although it is not necessary for local work.
The ideas of secondary trends (accumulation) to understand this local zone attached to this idea.

AUDCHFAUDCHF on intraday perspective going some bullish outlook.
As the price is in symmetrical triangle and it is printing HHs in triangle.
It is looking like the price is ready to break through triangle.
if breakout happens and to be hold, the optimum target could be 0.5660.

$HE Bearish Pennant w sub 10 targetNovice bulls, with no prior posting history, appear discontent as my puts/shorts are up 200%. Hawaiian Electric's bonds have been junked, and power wasn't cut during fires. Tread carefully in buying this dip.

VBL- PENNANT PATTERNNSE:VBL 868
1.Price movement is moving according to the Ascending Triangle Pattern (TF- 6 Months)
2. Breakout with the Bullish Marubozu candlesticks
3. Strong volume in last two days in row
4. Upcoming levels to watch 925-100 Levels
5. support to watch the 820-800 levels
#TechnicalAnalysiswithMrChartist

Ripple can bounce down from buyer zone to 0.6000Hello traders, I want share with you my opinion about Ripple. Looking at the chart, we can see how the price a few moments ago bounced down from the support line of the downward channel and fell firstly to the 0.6850 resistance level, which coincides with the seller zone. Then price continue to decline, broke this level, and made a strong impulse down to 0.6285 current resistance level, thereby exiting from the downward channel. After this Ripple declined below the 0.6285 level to the buyer zone, and at once it tried to rise, but failed and declined to support line of pennant. Then the price rebounded and rose to the resistance level, but a not long time ago Ripple declined to the current resistance level and some time traded near this level. Also recently, the price exited from pennant and now it trades in the buyer zone near the 0.6285 resistance level. Probably Ripple can decline lower buyer zone, therefore I set up my target at the 0.6000 level. Please share this idea with your friends and click Boost 🚀

Positional Pick. Webelsolar Enery Syst.This chart came to my attention 2 weeks before when it gave a breakout around 97. Since then it is showing very good strength on the charts. I am especially interested in this chart due to the gap up opening. Last 2 weeks the stock is successfully trading above the gap and it has shown no sign to fill up the gap. In my opinion, it is a very good sign and worth of a trade.
CMP - 113.3
T - 133, 163 W
SL - 100 W

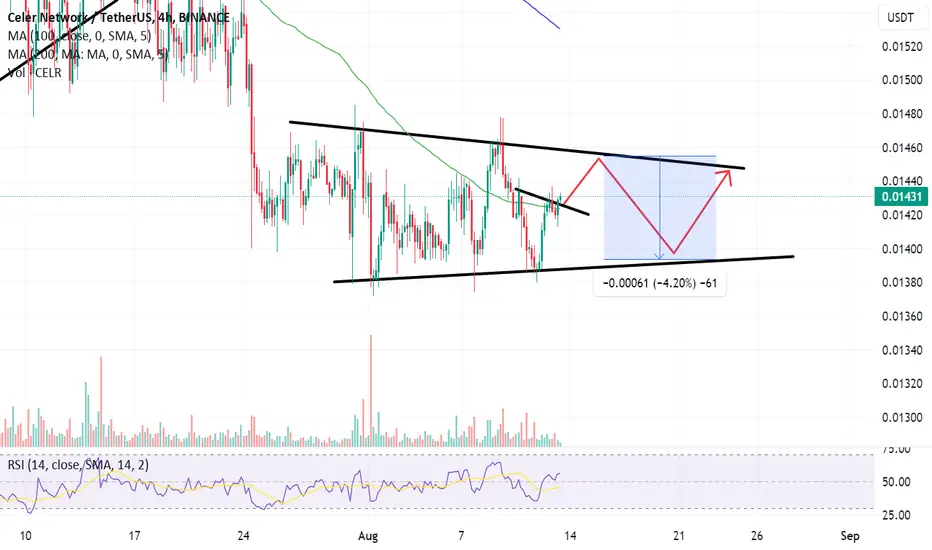
Celer Possible Playout Chart this week
The price movement of CELR is predicted to experience sideways movement within the symmetrical triangle channel, with the potential to move in the price range of $0.01402 to $0.01453 for the upcoming week, with a volatility potential of around 4%. At the beginning of the next week, an increase is anticipated towards its resistance line at the price of $0.01453.
WLD big move to come?
By looking at this chart, would we call it a bullish flag?
Breaking-out would trigger a big move. Currently I've not seen a big buying volume yet but it may come with some 'news', anytime. Stoploss is always needed because BTC is not bullish.

Chart of the week. Digvijay CementDigvijay cement has given a pennant breakout. I particularly liked the volume with which it has given the breakout. This stock has consistently outperformed and the strength can be easily seen on the chart. Fundamentally too the stock has a good track record. I feel it's a worth of a trade.
CMP - 91 W (6/8/23)
T - 121, 160 W
SL - 75 W

The Graph /GRT/ moving through boring holidays. 1USDGRT moving through boring holidays.
GRT prepared for bullish movement to 23 cent. If resistance breakout price rise to 1 dollar. Take position after breakout and retest in daily time-frame we are now in resistance area. Bullish divergence pattern Lower low spotted. DYOR
