Pennantbreakout

EURGBP - What Is a Pennant?What Is a Pennant?
In technical analysis, a pennant is a type of continuation pattern formed when there is a large movement in a security, known as the flagpole, followed by a consolidation period with converging trend lines—the pennant—followed by a breakout movement in the same direction as the initial large movement, which represents the second half of the flagpole.
Pennants are continuation patterns where a period of consolidation is followed by a breakout used in technical analysis.
It's important to look at the volume in a pennant—the period of consolidation should have lower volume and the breakouts should occur on higher volume.
Most traders use pennants in conjunction with other forms of technical analysis that act as confirmation.
Understanding Pennants
Pennants, which are similar to flags in terms of structure, have converging trend lines during their consolidation period and last from one to three weeks. The volume at each period of the pennant is also important. The initial move must be met with large volume while the pennant should have weakening volume, followed by a large increase in volume during the breakout.
Here's an example of what a pennant looks like:

NEA - Bullish Pennant in Formation I believe that there is a great buying opportunity in NEA, as it has been forming a clear Bullish Pennant since the end of August. It is clearly a continuation pattern and has been consolidating within this pennant. If Price Breaks this pennant with High Volume, this may be a sign that Price may continue pumping up with force and reach the (Resistance 2 - Zone) nearly $3.10 with a potential gain of nearly 32%. Price may even hit the Strong Resistance Zone of nearly $3.90, which may provide a gain of 62%. I believe this is a great medium term buying buying opportunity.
Please note these are my own notes, by no means trading advice. Please do your own research before entering into any trade.

Cumminsind - Flag BOCumminsind given flag breakout on 2hr TF, Let is break the pole neckline for further upmove. Volume show huge bullishness. Targets on chart...

DLF - Loooking for MOONPreviously dlf had pennant BO on 4hr TF and first target was done now it retraced and again formed a pennat on 30 and 60 mins TF. Hidden RSI Postive Divergence on 15 min TF... Targets on chart...


Cholafin - Pennant BOCholafin seems bullish as given a pennant breakout on 4hr TF. Already on support might break all time high. Targets on chart...

Muthootfin - Pennant BOMuthootfin has pennant breakout on 2hr TF but its struggling on 50% fib. Need to break resistance for further upmove. Targets on chart...


KAEF BULLISH PENNANT IDONESIA STOCKS EXCHANGEA BULLISH PENNANT IS A PATTERN OF CONTINUATION, KAEF ALREADY FORMED AND BREAK THE PENNANT TRENDLINE, WHICH WILL LEAD KAEF TO AROUND 3750-3800 FOR THE FIRST TARGET PRICE.
BEFORE START BULLISH IT MIGHT BE A PULL BACK TO THE AREA I MARK WITH A BLUE RECTANGLE (@3300~) IDX:KAEF
THE FIRST TARGET PRICE IS 3750 - 3950 (REASON: PENNANT TARGET PRICE)
THE SECOND TARGET PRICE IS 4170 - 4240 (REASON : FIBONACCI XAY : 1.618 CLUSTER WITH HARMONIC PRICEPROJECTION (HPP) : 78.6%)
THE LONG TERM IF THE TARGET PRICE ALL TIME HIGH WILL BE 4860 - 4970 (XAY : 2.618 CLUSTER WITH HPP : 1.272)
THE STOP LOSS AREA : 3090
DISCLAIMER ON!

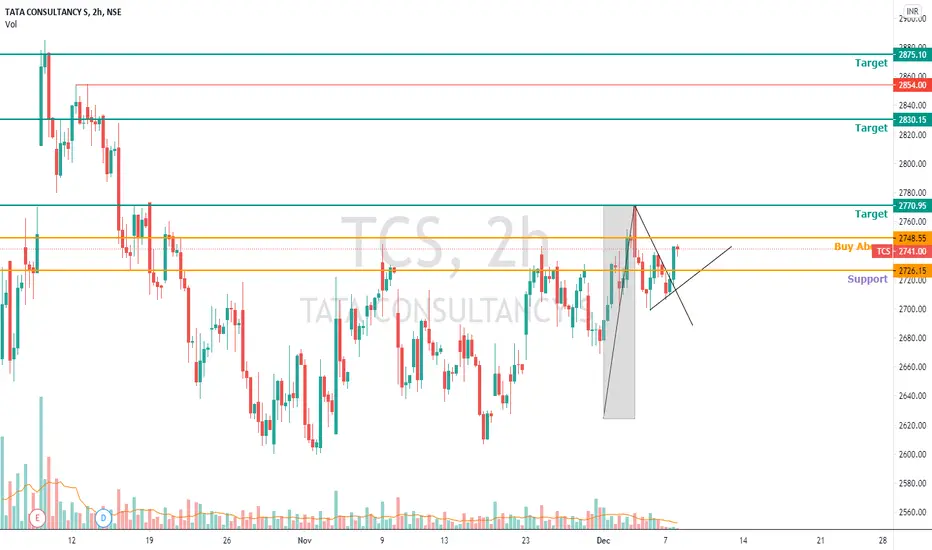
TCS - Pennant BreakoutTCS given pennant breakout, a resistance above which need to be broken for upmove,Targets on chart...

DLF - Pennat BreakoutDLF has pennant breakout at 4hr and daily TF, 258 might come in 2-3 weeks. Targets on chart...

Ultracemco - Pennant - Triangle BreakoutUltracemco gave pennant breakout on 4hr TF with considerable volume. Its on all time high so supply can be seen at top. Lets see how it react on top, Targets on chart...

BTC PENNANT BREAKOUT? IF SO TARGET IS $21KPENNANT PATTERN. TARGET SHOWS $21K, IT FAILS IF PENNANT BREAKS DOWN
NO INVESTMENT ADVICE The Content is for informational purposes only, you should not construe any such information as investment, financial, or other advice.

Breakout from strong bull pennant pattern (MOONSHOT 101)Caught this one at the bottom of a huge falling wedge. Entry almost couldn't of been better. Price consolidated into huge bull pennant, and has broken out on high volume, cruising through the old resistance at the consolidation high. Next target is to break through the previous flagpole high. The sky may be the limit on this one.
