GBPUSD pair has created a pennant pattern
The hourly chart shows the GBP/USD pair has created a pennant pattern - a bearish continuation pattern, meaning a downside break would open the doors to 1.30 (psychological level).
An upside break would abort the immediate bearish outlook.
I'm already short on this pair. Sold at 1.32010. If you like this trade idea, please give it a thumbs up. Thanks.
Pennantbreakout

BEARISH PENNANT What im looking for is for it to hit the 0.618 retracement for a break out, retest and off She Blows...

SPY, heads or tails?Dear all, thanks for reading this post. Lets get right to it. In my last post (SPY is playing Fibonacci Pinball) I noted that the market was difficult to read and was giving no clear signs as to its direction. This was b/c we had seen multiple higher lows (w/ decreased volume on each higher low which was a bullish sign) and higher highs in the ascending channel we were in. This channel has now broke, this is not a complete surprise to me as we are still in a corrective mode and I expect this market to dip. Also note that a red volume symbol at the bottom the the chart indicates that we have witnessed an uptick on volume during a dip, a reversal of the previous pattern.
Per the two small rectangular shaded regions we see that over the past three weeks the .786 & .618 Fibonacci lines have served as very accurate support/ resistance lines a total of 10 times! Going forward I anticipate we will break more support lines. Even if the pennant we are currently in demarcated with red trend lines breaks to the upside I still believe we will head down eventually. In the grand scheme, beyond the scope of this chart remember we are still in a 5 wave impulsive bullish set up that will likely take SPY much higher in 2019 than the 2018 highs.
Once the .236 support in our current bearish set up breaks, and I'm anticipating it will before this correction runs its course, we may be nearing completion of the correction and it will be probably be time for a bullish re-orientation. This is because we are most probably in a flat corrective wave (one of three types of corrective waves according to Elliot Wave analysis) which means that the C wave, completing the A-B-C corrective structure may run its course in a similar spot to the A wave, demarcated with a orange line with an arrow in the graph. By the same token in a flat corrective wave, wave B terminates near the origin of wave A, again demarcated with a orange line with an arrow in the graph. I am also leaning towards this hypothesis b/c of all the abnormal strength we have seen during this correction and SPYs tendency to rocket after touching the upper 250s. I will not wait for lower prices only to watch the market head up and lose a good buying opportunity. My two cents, I welcome all questions, comments, and criticism.

BTC Bottomed?! - A Tale of Bullish Bear Pennants BTCUSD
Bitcoin's bottom to top increase in February was approximately 96% and was 55% in April/May (ratio approx. 1.7:1). In early April Bitcoin found strong support in the low-mid $6000 region forming what looked like a traditional bear pennant but eventually broke the upside with relatively confident momentum. We now find ourselves, presently, back in the $6000 region forming what looks like another traditional bearish pennant. However, history tends to repeat itself and the pennant has formed proportionally in the 1.7:1 ratio compared to the last pennant. Therefore, I expect BTC to break the upside of this pennant and, in turn, out of the overall bearish trend. I wouldn't be surprised to see BTC heading to test the May high of around $10,000 soon.

BTC/USD Bearish pennant Hi guys, I am still bearish medium term but who knows for short-term, Bulls need to break 7700. well, our market cap still going down we're over 185,260,417. USDT , After that sharp drop in price, some sellers close their positions while other sellers decide to join the trend, making the price consolidate for a bit. As soon as enough sellers jump in so we’d put a short order at the bottom of the pennant with a stop loss above the pennant.
Thank you all <3

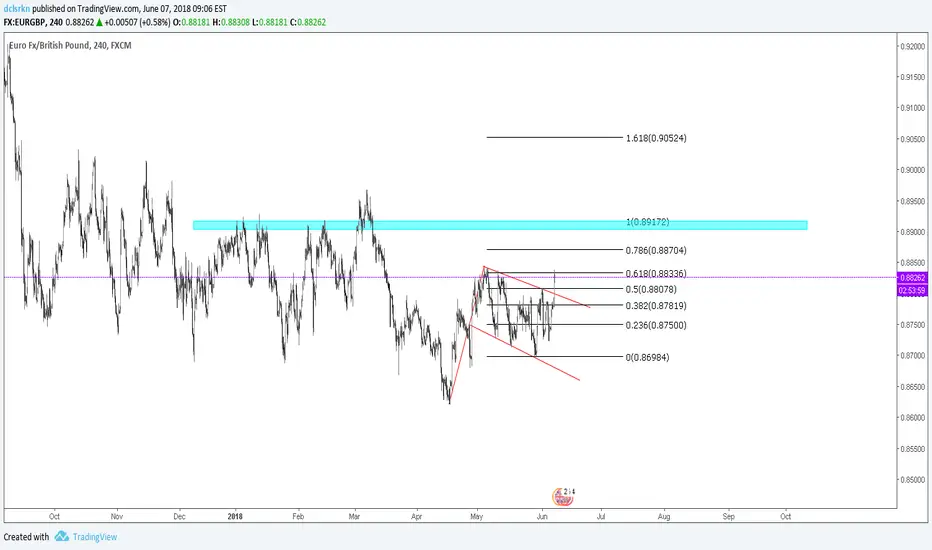
EUR/GBP, 240, PENNANT? The 0.618 Fib level is an important point of resistance. a "pennant" formation may occur if this level is passed.
Do you trade technicals? #technicalanalysis #stocks #tradingPennant/triangle pattern on ATVI. If you're into technical analysis you'll want to trade the breakout after the consolidation phase.

zil/btc pennant breakoutBINANCE:ZILBTC i think Zilliqa, the flavor of the week, has been forming a very obvious pennant, in its bitcoin pairing on Binance. With how young the coin is, there's not a lot to go off of, other than instincts, therefor not a lot to say here, This is my first published idea, for the record. I would really like to hear some other peoples opinions of this coin, if someone wouldn't mind sharing that in the comments, along with any other comments, questions, criticisms, thanks for checking this out! BINANCE:ZILBTC

Ontology about to break out of Bull PennantOntology is little known to most people, but has by far been one of the best performing coins, relative to its ICO price. It's about to break out of this pennant, and though some sideways consolidation is possible, I doubt it knowing how volatile crypto is.
I'm not making any moves at the moment, but definitely holding on to the ONT I already have.

BTCEUR Long position on Pennant breakout
UpTrend
Bullish Pennant
Good Risk/Reward
take profit on fibonacci 61.8

BTCEUR Long Position on Pennant breakout
UpTrend
Bullish Pennant
Good Risk/Reward
take profit on fibonacci 61.8

ARN next coin to be pumped?ARN is either forming a pennant to breakout or cup & handle. If it goes up meaning a pennant breakout. And if it goes down meaning it could form handle. Either way, ANT is a good coin to buy. Back in January ARN was pumped like crazy? will history repeat itself?

USDCHF potential break of pennantso we saw usdchf almost make it to the top of the pennant and begin its move down. We will be watching for a break and retest for a potential short.

BITCOIN (BTCUSD) - Clear signs of major trend change ahead(H4/D)Hello All!
Lowering recent bearish trendline (red) and the major ascending channel are forming grand bullish pennant formation.
After two consequent breakup attempts, the price kept always returning inside the major uptrend pattern.
RSI is demonstrating strong support for BTC higher low on both H4 and Daily timeframes.
Interestingly, the amount of short positions is showing clear bearish divergence:
The breakup above the indicated red line supported by solid volume increase, will ensure the validity of the grand ascending channel and its possible targets.
To sum all of this up - there are definite signs that BTC does have the chance to change current downtrend to bullish in the near future.
Thank you for reading!
Press like if you liked it :-)


DGD - Up or Down. What will it be BTC?Soooo. Which direction will it be. Usually the pennant should resume the uptrend. But as always... BTC will probably dictate the impulse. IF we go up, we SHOULD get a MACG crossing upwards on the 4hr chart. And then...Booom. Crossing fingers.


Neo short term bull pennant forming?Neo short term idea, bull pennant might be forming, otherwise wait for price to retrace to fib 0.5 to 0.618 level to buy in!

GBPUSD LongRight now we are seeing price action consolidate within a pennant inside our upward channel. I am expecting this structure to continue to consolidate and eventually break out upwards to our first take profit at 1.41587. After that, I am looking for bullish signs to hold this pair through the week to test the top of our channel at our second take profit. Our stop loss could go down farther if you are willing to accept a larger initial draw down. We're goin to the moon with this one!
For more information on technical analysis and signal calls, please visit rileyedwardsfx.com.
Happy Trading!

BTC to under 7k Part 2We have broken down out of the bear pennant and have rejected as it stands the inverted H&S, the 4 hr chart showed a nice H&S forming and looks to of followed to plan.
If we follow the 2nd impulse wave on our way towards the end of the abc correction it should stop a nudge under /over 9k before a pull back and then on with the 5th wave to the 7k zone.
Good luck, she is a wild beast to tame.

[LTCUSD] Consolidation Pattern Coming to and End Soon?LTC appears to have formed a symmetrical triangle in its consolidation period following its big run. Now with the Litecoin Cash fork passed, and the price holding above the rising lower trend line, it looks like the 5 wave contracting correction pattern is coming to its end. I am expecting a breakout above this triangle in the next wave, but Wave E could actually be part of Wave D which could mean another wave cycle inside the triangle before a breakout. If a price action can sustain levels above $225-$230, return to the previous bull trend is likely with a flag/pennant target price of $290, roughly. There is still plenty of opportunity for resistance before that though, the green and red upper trend lines in the $240-$260 range for example. If price movements continue past this range then we can easily go up towards the $300 area, in my opinion.
Thanks for checking out my analysis, please let me know any feedback/criticisms you have!
*This is not a recommendation to buy or sell, trade at your own risk*

Bullish Pennant after strong move - GO LONGPlease like and subscribe if you want more analysis from me...
Litecoin reacted positevly on a new that it can become a fork - right now we can see a Bullish Pennant Formation with projected MPO -0.35% near 300.
Litecoin declined into our projected important support as expected and turned just like BTC -2.92% and ETH, so it’s
first evidence that correction is over. On weekly, logarithmic scale chart market is showing a correction of
wave IV that can send price higher from current support based on a weekly reversal candlestick .
On daily chart you can clearly see only three waves (a)-(b)-(c) down with ending diagonal in wave (c), which
is the most important evidence that correction could be completed, especially if we consider that on 4hour
chart recent push out above upper line of an ending diagonal can turn into a support. There is a chance that
1175 is broken which can make room for 200, or even 300 area.

Bullish pennant pattern on the hourlyI bought the June $200 calls today, which provided the right amount of delta to have my stop below today's gap up candle.
On the daily you can see that this gap is a gap-n-go since traders were shorting for the past 3 days (black candle gapping up). If we go higher, the bears will be forced to close their positions or take some serious pain.
Let's see how she does with the rest of the market. SPY is down about 0.50 % after hours.
