Volume and Price Percent ChangesUsing Aritificial Intelligence to create a study with some criteria that includes changes in volume and price by certain percentage, and also dots to plot when a possible big move is coming. Testing with any instrument and timeframes. Comparing with the MACD and watching for accuracy and performance.
Percent

Raw VS Percentage Volatility FormatA Quantitative Comparison of "Buying & Selling Pressure" and "Average Bullish & Bearish Percentage Change"
In market analysis, the choice of averaging method can profoundly influence the insights derived. The "Buying & Selling Pressure " and "Average Bullish & Bearish Percentage Change" indicators demonstrate the unique strengths of fixed-period and candle-count-based averaging approaches.
Key Differences Between Fixed-Period and Candle-Count Averaging
Fixed-Period Averaging in BSP:
➡︎ In "Buying & Selling Pressure", candle metrics are averaged over a defined period (e.g., 14 bars).
➡︎ This provides rapid insights into market sentiment changes, making it ideal for tracking incentive shifts and volatility in real time.
➡︎ However, because this method includes all candles in the averaging window, it may reflect short-term fluctuations, offering less stability compared to candle-count-based methods.
Candle-Count Averaging in ABBPC:
➡︎ "Average Bullish & Bearish Percentage Change"uses a predefined count of bullish or bearish candles for averaging percentage changes.
➡︎ This produces stable and reliable values, which are less sensitive to noise and better suited for risk and reward assessment.
➡︎ The focus on specific candle states ensures that only relevant market behaviors contribute to the averages.
Using Percentage Change for Risk Definition
One of the greatest strengths of the "Average Bullish & Bearish Percentage Change" indicator is its ability to assist in risk and reward calculations with much more market related figures instead of raw values of volatility:
Defining Risk
The average percentage change of bearish candles can serve as a dynamic stop-loss level.
For example, if the average bearish percentage change over the last 10 candles is 2%, a trader can set a stop-loss at 2% below their entry to account for typical market behavior.
Quantifying Reward:
The average bullish percentage change helps identify realistic profit targets.
If the average bullish percentage change over the last 10 candles is 3%, a trader can set a target at 3% above their entry to maintain a favorable risk-to-reward ratio.
Dynamic Adjustments:
As the market evolves, these average percentage changes update, allowing traders to adjust their risk and reward levels in real time for better precision.
Quantitative Advantages of Percentage Change Averaging
Normalization Across Price Levels:
Percentage changes enable consistent comparison across assets with vastly different price ranges.
Enhanced Stability for Risk Assessment:
Candle-count averaging smooths out noise, offering a reliable basis for setting risk parameters like stop-losses and profit targets.
Improved Predictability:
By isolating specific candle behaviors, percentage-based metrics provide clearer signals for trend-following or mean-reversion strategies.
Advantages of BSP’s Fixed-Period Averaging
Despite being less stable, "Buying & Selling Pressure " excels in areas requiring speed and adaptability:
Fast Incentive Tracking:
Period-based averaging adapts quickly to changing market conditions, providing timely insights into shifts in buying or selling pressure.
Broad Volatility Capture:
BSP includes all candles in the defined period, capturing overall market dynamics, including sudden spikes or reversals.
Real-Time Decision Making:
Its responsiveness makes it highly suitable for momentum or breakout trading strategies.
Bottomline:
Use "Average Bullish & Bearish Percentage Change" for stable, consistent data ideal for risk assessment, particularly when defining dynamic stop-loss levels or profit targets based on average percentage changes.
Use "Buying & Selling Pressure " for its speed and adaptability in tracking real-time shifts in market incentives and capturing volatility.

ES Market Crash 45% IncomingI will reference the 1973 crash as proof that this is what is happening today.
Similarities:
8% between the 200sma and the all time High
Daily Pennant/ Triangle Formation
Bear Market Rally breaking above the 200sma, formed a double top
45% crash in prices in 232 trading days
50% crash from all time highs
1973 went 3 full range expansions
2023 potentially go to 1.5 full range expansions
Both years ending in 3
MACD above the zero line, bearish cross and rolled over
I will ride it down to 2280 and then accumulate SPY at 230
Massive wealth will be available to those who take it
Here is the chart of November 1973 and how they are IDENTICAL to today

ANKR 1600% ANKR Price Live Data
The live Ankr price today is $0.015504 USD with a 24-hour trading volume of $13,168,813 USD. We update our ANKR to USD price in real-time. Ankr is down 5.73% in the last 24 hours. The current CoinMarketCap ranking is #129, with a live market cap of $149,814,186 USD. It has a circulating supply of 9,662,899,378 ANKR coins and a max. supply of 10,000,000,000 ANKR coins.
If you would like to know where to buy Ankr at the current rate, the top cryptocurrency exchanges for trading in Ankr stock are currently Binance, BingX, Bitrue, CoinTiger, and CoinW. You can find others listed on our crypto exchanges page.


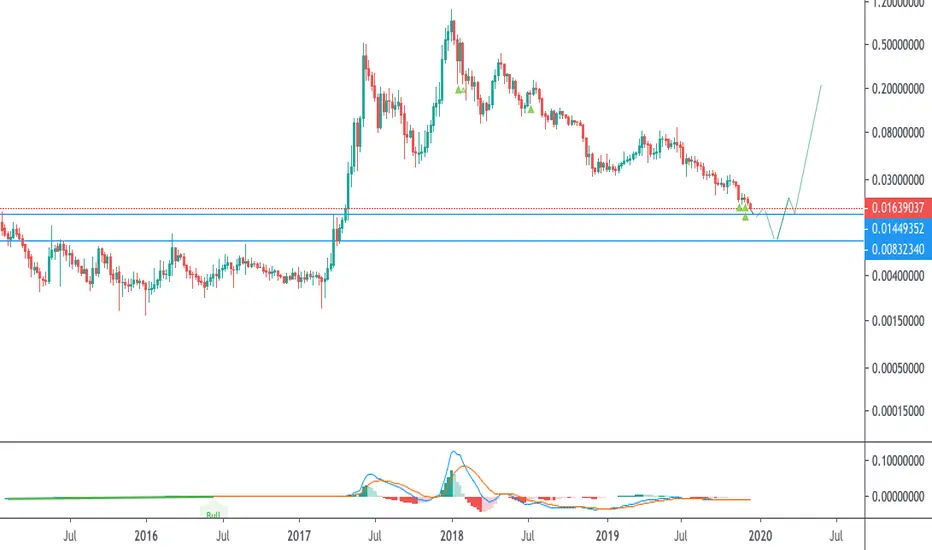
Bitcoin end of year target 2022 early 2023I am using the Beam Band to help us see the possibility of Bitcoin's price action end of the year 2022. Notice we have touched the bottom of this Beam Band twice already and afterward, a price surge happened like clockwork. The question is when will we touch down again this year if at all? What we do know is as soon as it happens we can, with high probability, expect a surge in price soon afterword based on previous examples. The green checkmarks are touchpoints at bottom of the Beam band and the red one is the possible expected touch we are anticipating. Also, notice the average percentage between the first two comes out to 800%. If we move from this expected bottom price on the beam band then at 800% would give us over a $200k BTC price.
If we do not see the BTC peak this year most likely will happen in 2023. Taking the average day count from both bottom touches on the Bean band and averaging them out gives us about 295 days afterward for the possible peak which, if so, takes the peak well into March of next 2023

ENS Will Be Ready SoonExpecting a 10-15% move, then $56, and then $62 if I can hold long enough. May not be done dipping until price gets near/under $46 imo.

XRP GETTING READY FOR LAUNCH!!!XRP Cryptocurrency has shown great strength recently but the strength is only in its middle phase. A wave of bullish strength can push XRP +93% to 3.30, which is showcased as the next major technical resistance. XRP has great room for growth and the charts are showing nothing less than that. Stay focused, and EXECUTE!!!

SPX's Percent of Stocks Above 50d MA.
****************************
****Reading Table:******
****************************
-Green Lines readings below 10%
-Black Lines readings Between 10%-20%
-Red "Date Range" is reading above 90%
- Pinks are Crossing below 50% then
Crossing above it again. "Bottom finder"
-----------------------------------------------
Reading Between 10%-20% :
( 9 Signals)
--------------------------------------
Bottom
- before bottom
bottom
bottom
bottom
bottom
going down
botom
bottom
----------------------------
Conclusion:
-90 % success rate at Bottoms
-Much better surprisingly than
going below 10% which is most
extremes
----------------------------------------------------------------------
Reading Below 10% : (11 signals since 2009)
------------------------------------------------------
Bottom
bottom
False
bottom going down
3 weeks before a bottom
bottom
bottom
bottom
bottom
going down
bottom
-------------------
Conclusion :
- much better to wait for it to
crosses above 10% just to clear off errors .
- 54% confirmed bottoms,9% false signals
- 18 % going down to a bottom
----------------------------------------------------------
Readings Above 90% :
9 signals
----------------------------------
up swing ( small dip)
up swing
up swing
top "small dip"
up swing
top small dip
up swing
Major top
up swing
-----------------------------------------
conclusion :
- Small dips 7%-5 %
-89% of the time just up swing
showing how strong the market
is.
-11% Major top
------------------------------------------------
Summary:
*** Above 90% is just up swing, 89% of the time!!
***Surprisingly between 10%-20% is much better
than going below 10% ! !! 90% VS. 54%.
***Both lowest section readings either we are very
close to a bottom like weeks or at one.
***Like any other indicator, during crashes we
will get false signals across the board like allot!!!
*** All dips if i may say, happened between pink
lines when single or between them for longer pullbacks

Time for new resolutions or do we mess it up more?U.S. Public Debt at 127.78% of GDP... How sustainable is it?
Overall, as the U.S. Federal Debt keeps on climbing, the S&P 500
keeps on climbing... It might be great for the U.S stock market
but it is very bad for present and future generations.
Federal Debt:
FRED:GFDEGDQ188S
S&P500:
CURRENCYCOM:US500 CURRENCYCOM:US500
The U.S. Public Debt is now at 127.78% of the U.S. GDP...
How sustainable is this trend?
There used to be lots of international buyers who were keen on
buying U.S Treasury Notes and U.S Treasury Bonds, such as China.
Will China still buy happily those financial products,
thereby financing this ever-increasing debt, set on an uncontrollable path?
As we now enter a phase where each country thinks of its own survival,
how will be willing to finance the debt of other countries?
It is becoming less and less likely.
International cooperation related to unsustainable borrowing, will trickle down considerably.
And the new reality of "to each his own" will become a renewed source of conflict,
domestically and globally.
Time for new resolutions or do we mess it up more?
François Normandeau
Institutional Research Director at ADX-BRIEFING


CHFJPY- 15 MIN ENTRY.QUICK FRIDAY PIPSWe can see price previously made a lower low, i am looking to go short upon a lower high, however i need a confirmation candlestick to confirm my short entry. A wick to the 50EMA then rejection down to the 61.8 could look likely...

Why Cardano Could See a 100% Run!This is a very simple analysis based on ratio analysis.
Based on the last several waves down ADA saw a 81%, 80%, and most recently, a 79% retracement.
These ~80% retracements were then followed by a 150% and 132% bounce.
Therefore, if this pattern continues we should expect ADA to make a nice run to the 800 sat level. Coming to about a 100% return from the 400 sat level.
The Plan:
In the coming days/weeks ADAXBT should form a nice bottom pattern to help support this analysis.
I plan to gradually average in on retracements.
Stop/Loss: 355 sats
Primary Target: 810 sats
I hope you found this analysis interesting and maybe even a little helpful!
I wish you the best of luck!

EASY 20% Projected rebound and beyondBased on the volitility of this stock my short term projected gain is 20% and 100% exit after this gain. Load up on this one!

BITCOIN DROPS TO 0 ON BLX! -100% !!!Can anyone explain what is going on here?
The BLX chart shows a drop of 100% to 0 on Bitcoin.
Certainly on any other chart/exchange bitcoin is a normal levels.
Has anyone any idea what this means?
This shows only on the 3D and Monthly timeframe,
all others are at normal price levels.
This needs clarification!!
Cheers,
Konrad

Market Cycle of EmotionsI'm feeling depressed, angry, and doubtful about my BTS position.
I can feel the emotion creeping in. I can feel the thoughts coming on: "sell now, you can find another coin. This coin is dead."
In the cycle of market psychology, it could be the time for me to buy more.
If BTS was at .20 I'd probably have a million and one emotional reasons to buy more.
We have retraced 98% from ATH. What an opportunity!
Horizontal lines are support levels.
Who knows?
Good luck.
TRXUSD, Nearing a drop to 10% of it's current valueBy year end, TRX should be worth about 10% of it's current value right now. Looks like we are in Wave-E of a bullish diametric, and using trendlines, I've picked an approximate target of around $0.0011.
Will be a while before things start to get bullish on it again, but likely it won't ever see those lows anytime soon, sdo make sure to stock up at New Years on it.

IS IT WORTH TAKING THE TRADE? THE FINAL DECISIONSSo you have the "perfect" setup; all the stars align and you feel utterly confident in taking the trade, but should you? I have a process that must be completed before I even think about pressing the trigger.
Fundamental analysis points me in one of two directions, then from there I'm either short or long. I then look if there is a technical entry point that lines up in the way I want to enter. The final step to take is too see what target will be and what my R:R is.
For those that don't know R:R is risk to reward. So if you have 1:1 R:R and you risk 1% of your capital on a trade, then you stand to gain only 1%. This is pretty much a 50/50 gamble, and we don't gamble in trading.
If all the stars align and the R:R is 1:1 DON'T TAKE THE TRADE, MOVE ON!
We win by having better winning trades than looser's. Ideally I want a 1:1.5 R:R, ideally 1:2 (So if i risk 1% and my trade reaches TP I gain 1.5% or 2%).
If I have a R:R less that this I stay away or risk 0.5% on a trade, but I advise you stay away from the trade and look for another opportunity. After all, there are infinite entries in the future.
Happy Trading.


Xrp correctionLooks like a correction could be imminent. A nice bullish run had led to some nice profits. However, on the 1D chart, the CCI is dropping, the stochastic is high and has maintained its momentum for a while. With the MACD and CCI making a correction, the stochastic will soon drop with it. This will cause xrp to fall down in price.
The next line of support is around $0.65 cents but on the 25/04/18 that was temporarily broken, indicating weakening momentum in my opinion. If sold at its peak a potential 30% profit could be gained.
This is my opinion. I am not a financial adviser. This is information for analysis and educational purposes only.

All moments in three year time BTC buy percentage passed 50%I've used: www.turtlebc.com for this analysis, and followed every wave of buy percentage that passed 50% and marked in on the chart with an arrow, you can clearly see it was always followed by a bullish trend.
Good luck :)

BTC Short Trade Close @ 9% ROI..Re Short (10% of 17% ROI)
Open:7400 Stop 7450
Closes: T1 6500 T2 6100 T3 5850
Duration: 2D 12H
-----------------
Resistance
Significant Trendline and pivot at 6500 region.
New Stop 6700
-----------------
Possible bounce to 7100 (H&S) region for potential right shoulder.
Thumbs up would be appreciated & comments valued!
