AuropharmaNow the pharma sector is showing some move after a long consolidation. One can look for longs in Auropharma as it has given a breakout of a falling trendline and is coming out of a range.
Entry- 1253-1255
Support- 1225/1220
Target- 1280, 1300
Declaimer- This is just for educational purpose.
JAI SHREE RAM.
PHARMA

Teva 2026: The Biopharma Titan of the AI Protein Era
Teva Pharmaceutical Industries has moved far beyond its origins as a generics giant. Under the "Pivot to Growth" strategy, the company recorded its 11th consecutive quarter of growth in late 2025. As of January 2026, Teva stands as a revitalized biopharma leader. The company’s transformation focuses on innovative medicines, biosimilars, and high-tech manufacturing.
Geostrategy and Macroeconomics: A Resilient Foundation
Teva utilizes its massive global footprint to navigate complex geopolitical shifts. With over 50 manufacturing facilities, it maintains the industry's largest fully integrated network. This scale provides a critical buffer against global supply chain disruptions. Furthermore, Teva has successfully managed the impacts of the U.S. Inflation Reduction Act. The company’s strategic pricing and market access ensure steady revenue from blockbuster assets like Austedo.
Industry Trends: The Biologics Pivot
The pharmaceutical industry is rapidly shifting toward complex biologics. Teva anticipated this trend by divesting its small-molecule active pharmaceutical ingredient (API) business. This move reallocates billions in capital toward high-margin innovative therapies. The company’s biosimilar portfolio is expanding aggressively, with plans for over 30 products by 2027. This shift significantly improves operating margins and strengthens Teva’s competitive moat.
Management and Leadership: The Francis Era
CEO Richard Francis has redefined Teva’s corporate culture. His "Pivot to Growth" framework focuses on four key pillars: growth engines, innovation, generics, and business focus. Analysts praise his disciplined capital allocation and focus on pipeline maturity. Under his guidance, Teva has stabilized its debt and regained the trust of institutional investors. The company is now a lean, innovation-first organization.
Innovation and Patent Analysis: Protecting the Future
Teva’s innovation engine is delivering record results. Branded drugs like Austedo, Ajovy, and Uzedy showed 33% growth in recent cycles. The company actively secures patents for long-acting injectables and next-generation delivery systems. These intellectual property assets prevent competition and ensure long-term profitability. Teva’s patent strategy focuses on high-value therapies that will remain exclusive well into the 2030s.
The Premier "Fab" for AI Protein Folding
The surge in AI-driven protein folding companies creates a massive need for manufacturing capacity. Teva is perfectly positioned to become the "Fab" (fabrication) partner for these digital biotech firms.
* World-Class Bioreactors: * Teva operates one of the most sophisticated mammalian cell-culture networks globally.
* Teva Rise Platform: This open innovation hub directly connects AI startups with Teva's manufacturing expertise.
* The Bridge to Scale: Protein folding companies design molecules digitally but lack the factories to produce them. Teva provides the physical infrastructure to turn AI designs into life-saving medicines.
* Bioprocess Expertise: Teva’s scientists excel at the complex folding and purification of recombinant proteins.
By acting as the manufacturing backbone for the AI revolution, Teva secures a dominant role in the future of biotechnology.
Digital Frontier: Cyber and Science
Teva integrates "Industry 4.0" technologies across its entire production line. The company uses AI to predict product quality and optimize supply chain logistics. This scientific approach reduces waste and accelerates the delivery of medicine to patients. Robust cyber-resilience protocols protect Teva’s valuable proprietary data from evolving threats. These advancements solidify Teva's status as a modern high-tech leader.

Novo Nordisk (NVO) 1WI’m looking at the weekly NVO chart as of late December 2025, and this is no longer about fear or headlines. It’s about structure and valuation. After a powerful multi year rally from 2022 to 2024, the stock went through a deep and healthy correction. In 2025, price built a strong weekly demand base around the 50–55 USD area, where volume profile, historical support and long term buyers align. Selling pressure is fading, volatility is compressing, and price action is stabilizing.
Technically, NVO is transitioning into a post correction accumulation phase. On the weekly timeframe, RSI has recovered from oversold territory and is holding a neutral bullish range. MACD is forming a constructive reversal structure, while declining volume on down moves suggests exhaustion rather than distribution. As long as price holds the weekly base and does not break lower, the recovery scenario remains valid, with upside reference zones near 72–75 USD and later 90–92 USD if momentum confirms.
From a fundamental perspective, as of the end of 2025, Novo Nordisk remains one of the highest quality businesses in global healthcare. Revenue exceeds 39 billion USD, with the Diabetes and Obesity Care segment generating more than 85% of total sales, continuing to show resilient growth. The United States and Europe remain the core revenue drivers, while international markets continue to expand steadily.
Cash flow quality remains strong. Operating cash flow is above 18 billion USD on a TTM basis, free cash flow stays positive despite heavy investments into capacity expansion and R&D. Dividend policy remains disciplined and shareholder friendly, with TTM dividend yield around 2.3% and a payout ratio near 35–36%, leaving room for both reinvestment and future dividend growth.
What matters is that the 2025 correction did not come with any structural deterioration of the business. This was not a business breakdown, but a valuation reset after an extreme growth phase. Expectations have been normalized, multiples compressed, while fundamentals stayed intact. That’s where asymmetry begins to emerge.
Tactically, I see NVO as a long term quality compounder, where 2025 served as a reset year. As long as the weekly structure holds, the path for gradual upside remains open. This is not a short term trade, but a trend rebuilding phase driven by cash flow, market leadership and scale.
Sometimes the best opportunities appear not at peak optimism, but when the market has already done its emotional damage and the numbers are still standing.

HINOON📊 HINOON (PSX) – Daily & Weekly Technical Setup
HINOON has made a fresh all-time high and is now retracing to the 0.5 Fibonacci level, forming a textbook continuation setup for HHHL (Higher High, Higher Low) structure 📈
🔹 Daily & Weekly trend: Bullish
🔹 Retracement: 0.5 Fib – healthy pullback
🔹 Structure: Trend intact, continuation likely
🎯 Targets:
TP1 – as marked on the chart
TP2 – as marked on the chart
🛡️ Risk Management:
Strict stop-loss below invalidation
Maintain favorable risk-to-reward
🧩 Fundamental Verdict (Strong Support) 💊
HINOON is fundamentally a strong pharmaceutical company in Pakistan:
✅ Consistent growth in revenue & profit
✅ Attractive margins vs industry peers
✅ Solid dividend history
✅ Ongoing export expansion
📌 Conclusion:
Technical continuation + strong fundamentals = high-probability setup
➡ Trade with discipline, not emotions.

ESPR 1W: cholesterol therapy for patients and investors alikeEsperion Therapeutics (ESPR) has broken its long descending trendline and retested the $2.4–$2.6 support area, forming a solid triple bottom with rising volume. The stock is now holding above key moving averages, signaling accumulation. While above $2.5, the technical setup points to a move toward $6.4, aligning with major resistance and the 200-week MA.
Fundamentally, the company enters one of its strongest phases in years. Following earlier liquidity struggles, Esperion has stabilized its operations and regained investor confidence. The core growth driver is Nexletol (bempedoic acid), a non-statin cholesterol-lowering therapy for patients intolerant to statins. In 2025, combined Nexletol and Nexlizet sales jumped over 45% year-on-year, surpassing $170 million for the first nine months. Recent safety data were positive, leading to new approvals across Europe and Japan - expanding partnerships and licensing revenues. Cash position strengthened via milestone payments from Daiichi Sankyo and Viatris, reducing debt and supporting R&D without new dilution. Challenges remain: profitability is still out of reach, as marketing and development expenses stay high, though liquidity provides breathing room. The broader biotech sector’s rebound amid rate-cut expectations adds tailwind to revenue-backed small caps like Esperion.
Tactically, holding above $2.5 keeps the bullish trajectory intact toward $6.4. A weekly close below $2.3 would negate the setup and re-test lower support, though current accumulation favors the upside.
Esperion helps reduce cholesterol - ironic that its chart still raises investors’ heart rate.

VKTX Viking Therapeutics Exploding Higher TodayVKTX surges higher today after pulling back again near 200-day EMA. Not sure what the news is that's driving the big move higher. The news I did find talks about the following:
1) Viking Therapeutics completed a drug clinical trial stage earlier than expected last week
2) VKTX is on lists of hot stocks to buy for 2026 and could be a takeover, acquisition target
3) VKTX is recommended by 15 Wall Street Ranked analysis who give stock 12-month consensus average price target of $92
4) VKTX is on lists of stocks with high short interest (over 20% short interest) TO BUY because they are vulnerable to getting short-squeezed
Let's talk about the 4th item above. Just imagine VKTX continues to move higher on good news about clinical trials or possibly getting acquired by a larger company. This would push the stock even higher and will force traders who have big short positions on the stock to quickly cover, creating a snowball effect that frantically drives VKTX even higher and completely surges! This is reminiscent of what happened to Game Stop (GME) a few years back. I hope that this happens because I am long on several rather large call option positions on VKTX!
Whatever you all decide to do..... Good Luck!

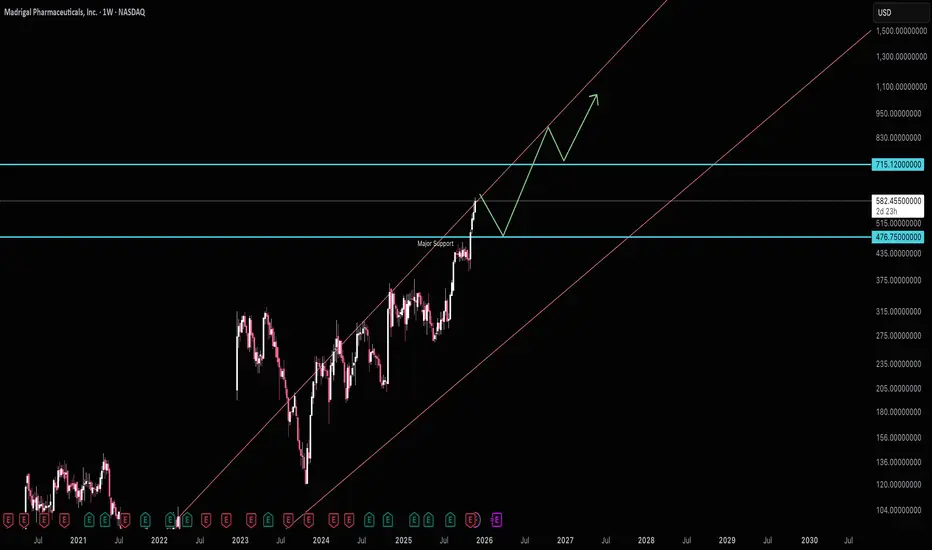
Looking to pickup at $476$476 is the buy area target $715. It's best to wait for support to hit before jumping into this one.
Good luck!
Eli Lilly: The Trillion-Dollar Cure for Market Volatility?Eli Lilly has officially shattered the Silicon Valley ceiling, becoming the first healthcare company to achieve a $1 trillion market capitalization. While tech giants like Nvidia grapple with bubble concerns and doubts about AI monetization, Lilly has delivered tangible, recurring revenue through its dominance of GLP-1. This milestone is not merely a pharmaceutical victory; it represents a fundamental shift in market leadership from speculative tech to essential biopharma.
Macroeconomics: The Flight to Quality
The Federal Reserve’s pivot is fueling this ascent. New York Fed President John Williams signaled imminent rate cuts, raising December cut expectations to 70%. Lower rates disproportionately benefit capital-intensive sectors like pharma, which require massive upfront R&D and manufacturing spend. Investors, wary of tech volatility, are treating Lilly as a "defensive growth" asset—a rare hybrid offering the stability of healthcare with the explosive growth of software.
Science & Innovation: The Dual-Agonist Revolution
Lilly’s valuation rests on **tirzepatide** (branded as Mounjaro and Zepbound). Unlike previous drugs that target a single hormone, tirzepatide mimics both GIP and GLP-1, delivering superior efficacy in weight loss and blood sugar control. This scientific leap has rendered competitors’ single-agonist drugs vulnerable. Furthermore, Lilly is already stress-testing its own dominance with **retatrutide**, a triple-agonist candidate showing even higher potency, effectively cannibalizing its own portfolio before rivals can catch up.
Business Models: Disrupting the Middlemen
Lilly is aggressively rewriting the pharmaceutical distribution playbook. The launch of **LillyDirect** bypasses traditional Pharmacy Benefit Managers (PBMs). By partnering directly with Walmart to offer cash-pay options for Zepbound vials, Lilly captures margin previously lost to intermediaries. This Direct-to-Consumer (DTC) model exerts immense pressure on insurers to cover these drugs, leveraging patient demand as a battering ram against restrictive formularies.
Geostrategy: Manufacturing Sovereignty
Management recognizes that demand is useless without supply. Lilly has committed over $27 billion to manufacturing expansion, predominantly in the US and Europe (Ireland and Germany). This strategy reduces reliance on fragile Asian supply chains, insulating the company from US-China geopolitical friction. By onshoring active pharmaceutical ingredient (API) production, Lilly positions itself as a national security asset, aligning corporate growth with Western industrial policy.
Technology & Cyber: AI-Driven Discovery
Lilly is moving beyond traditional wet labs. The company’s **TuneLab initiative** utilizes federated AI learning. This allows biotech partners to train models on Lilly’s proprietary data without exposing the underlying IP. Additionally, partnerships with Isomorphic Labs aim to accelerate small molecule discovery. This "tech-forward" approach reduces the years-long timeline of drug discovery, turning R&D into a computational problem rather than a biological guessing game.
Management & Leadership: The Ricks Doctrine
CEO David Ricks has executed a masterclass in capital allocation. While peers engaged in share buybacks, Ricks poured capital into manufacturing capacity ahead of approval. His leadership style is characterized by "preemptive scale"—building the factory before the drug is approved. This risk appetite allowed Lilly to meet the explosive demand for Zepbound faster than competitors, securing market share through sheer logistical brute force.
Patent Analysis: Building the Moat
Lilly is fiercely defending its IP territory. The company has launched legal offensives against compounding pharmacies attempting to sell unauthorized versions of tirzepatide. Simultaneously, they are layering patents on delivery mechanisms and combination therapies. The transition from auto-injectors to vials also serves a strategic patent function, complicating the regulatory pathway for future biosimilars.
Conclusion
Eli Lilly has successfully decoupled itself from the broader healthcare index. By combining Silicon Valley-style innovation with industrial-scale manufacturing, it has created a $1 trillion moat. As the Fed eases policy, Lilly stands ready to deploy cheap capital to further widen the gap against its rivals.

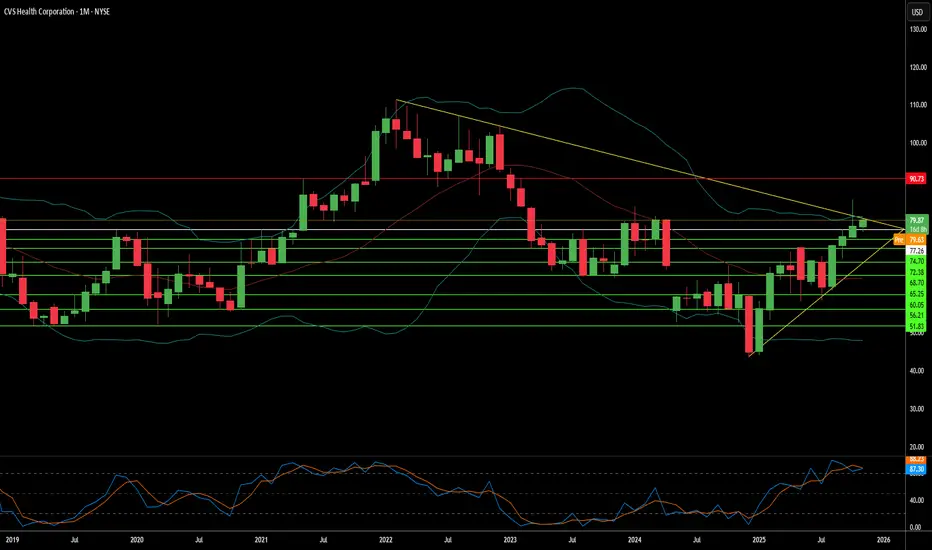
Can Integration Save CVS or Sink It?CVS Health confronts a dangerous convergence of risks that threatens its vertically integrated business model. The company's Pharmacy Benefit Manager (PBM) subsidiary, Caremark, faces intensifying regulatory scrutiny as lawmakers target the opaque rebate structures and spread pricing mechanisms that underpin PBM profitability. Simultaneously, the explosive growth of high-cost GLP-1 weight-loss drugs has created unprecedented formulary pressure. CVS's decision to exclude Eli Lilly's Zepbound in favor of Novo Nordisk's Wegovy, based purely on price, backfired spectacularly. Lilly publicly pulled its employees from CVS's PBM plan and shifted to competitor Rightway Healthcare, signaling deep market skepticism about CVS's ability to balance cost control with clinical outcomes. This defection validates concerns that major employers are increasingly willing to abandon the "Big Three" PBMs for transparent alternatives.
The company's acquisition strategy has proven economically disastrous, with CVS recording a staggering $5.7 billion goodwill impairment charge on Oak Street Health in Q3 2025, effectively admitting the primary care assets were dramatically overvalued. This massive write-down undermines the core thesis that vertical integration of insurance (Aetna), PBM (Caremark), and care delivery creates synergistic value. Meanwhile, operational margins erode from multiple directions: $833 million in litigation charges from past business practices, declining generic dispensing rates as expensive branded GLP-1 drugs displace generics, and the structural reality that robust patent protection on GLP-1 drugs extending into the 2040s eliminates the PBM's traditional leverage of threatening generic competition.
CVS faces additional systemic vulnerabilities across geopolitical, technological, and scientific domains. The company's reliance on Active Pharmaceutical Ingredients sourced from China and India exposes it to supply chain disruptions, tariffs, and mandatory but expensive domestic manufacturing mandates. Its vast integrated infrastructure creates an attractive single point of failure for cyberattacks, heightened by the $20 billion technology investment to further interconnect all segments. Most critically, pharmaceutical manufacturers hold unprecedented leverage due to the extended patent exclusivity of breakthrough GLP-1 therapies, with no meaningful generic relief for 15-20 years, forcing CVS into a perpetual choice between excluding superior drugs and losing clients, or accepting coverage that severely erodes margins.
Until CVS demonstrates sustainable PBM client retention among major employers, successful integration of its healthcare delivery assets without further impairments, and a viable strategy to navigate the regulatory assault on traditional PBM economics, the investment profile remains fundamentally challenged. The Lilly defection represents more than a single client loss; it exposes structural fragility in a business model increasingly misaligned with market demands for transparency, clinical appropriateness, and technological innovation.
SWING IDEA - NEULAND LABNeuland Lab , a niche API manufacturer with strong export presence and leadership in complex molecules, is offering a technically strong swing trade opportunity from key support levels.
Reasons are listed below :
11,500 zone acting as a crucial support area
Formation of a hammer candle on the weekly timeframe, signaling potential reversal
Reversing from the 0.618 Fibonacci retracement zone – the golden pocket
Taking support at the 50-week EMA , holding long-term trend structure
Target - 14900 // 17600
Stoploss - weekly close below 10215
DISCLAIMER -
Decisions to buy, sell, hold or trade in securities, commodities and other investments involve risk and are best made based on the advice of qualified financial professionals. Any trading in securities or other investments involves a risk of substantial losses. The practice of "Day Trading" involves particularly high risks and can cause you to lose substantial sums of money. Before undertaking any trading program, you should consult a qualified financial professional. Please consider carefully whether such trading is suitable for you in light of your financial condition and ability to bear financial risks. Under no circumstances shall we be liable for any loss or damage you or anyone else incurs as a result of any trading or investment activity that you or anyone else engages in based on any information or material you receive through TradingView or our services.
@visionary.growth.insights

Teva: The flag’s ready — someone just needs to hit “launch”Teva Pharmaceutical (TEVA) is setting up for a potential continuation move after a clean impulse. On the daily chart, we have a textbook bull pennant — and not just any sloppy one. Price has broken above the 200-day moving average, and all key EMAs (50/100/200) now sit below price, confirming a solid bullish structure.
Volume behavior fits the script: declining inside the pennant, signaling pressure is building. More importantly, the Volume Profile reveals a low-volume void above current levels — meaning there’s little resistance until we hit the $22+ zone. In other words, once this breaks, it could run fast.
RSI is comfortably in bullish territory without being overheated, and the flagpole projection gives us clean upside targets:
– Entry: breakout above pennant resistance
– Target: $22.80 — full flagpole height
– Support: $17.60 — confluence of 0.5 Fib + volume base
TEVA isn’t asking for confirmation anymore — it’s showing it. All systems are technically armed. Now we just wait for the market to press the button.

LLY LOOKS BULLISH OCT 31 2025I have LLY from lower levels of 870ish which was trade 2. Trade 1 was initiated at 637. Now again it looks ready to go to 890
I am long since $815 yesterday.
Trade as per your risk management and its a current price trade so SLs would be huge. But I can understand what price is trying to do here.
LLY should breakout

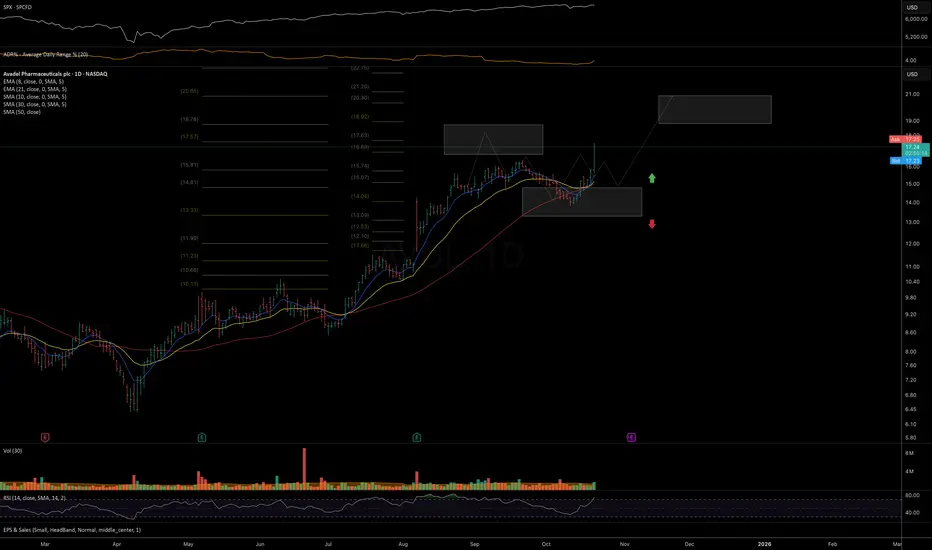
AVDL on the way to macro resistance Price continues to follow the trend structure outlined since August and is showing strong follow-through from the mid-term support mentioned last week.
As long as price is holding above the 21 EMA, I’m watching for upside momentum to extend toward the 19–21 macro resistance zone.
Chart:
Previously:
• On upside potential (Oct 14):
Chart:
www.tradingview.com
• On mid-term support (Oct 3):
Chart:
www.tradingview.com
• On resistance and support (Aug 27):
Chart:
www.tradingview.com
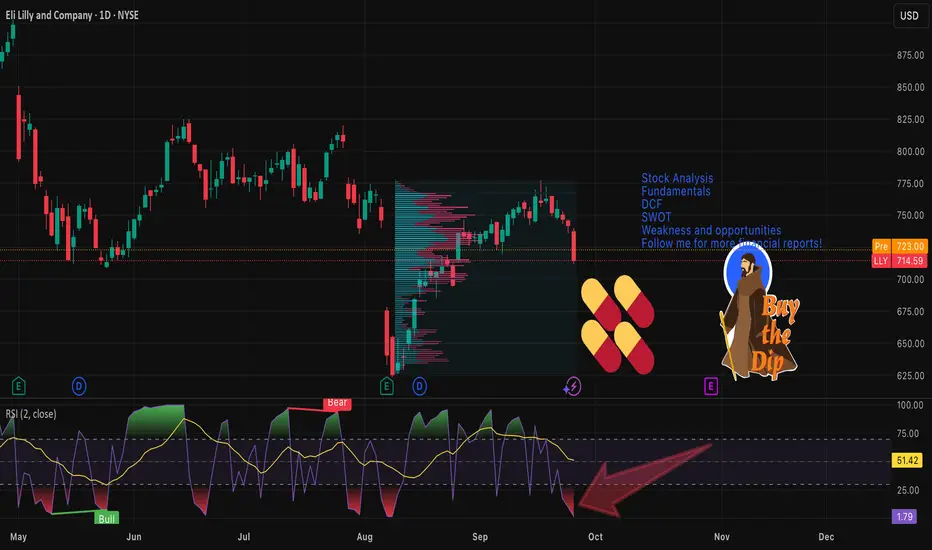
ELI LILLY COMPANY - STOCK REPORTExecutive Summary
Eli Lilly and Company (LLY) has delivered strong revenue and profit growth driven by blockbuster GLP‑1 therapies (Mounjaro, Zepbound) and continued pipeline progress in oncology and cardiometabolic indications. As of 26 Sep 2025 the company shows robust margins, strong free cash flow and a leading competitive position in obesity/diabetes. Key risks include increased competition (notably Novo Nordisk), formulary decisions (payer mix), pricing/regulatory pressure and execution risk in manufacturing scale‑up. Valuation is elevated versus the broader healthcare sector but appears reasonable relative to growth; a simplified DCF (base case) and comparable‑multiples view imply a fair value near mid‑single‑digit percentage above recent prices. Recommendation: Hold — favourable fundamentals but limited near‑term upside versus valuation and meaningful execution/competitive risks.
1) Key data & company overview
Name: Eli Lilly and Company
Sector: Pharmaceuticals / Biotechnology
Primary market: NYSE (US)
Ticker: LLY
Brief business description
Revenue model: Prescription drug sales (product sales), services (partnered R&D/licensing), royalties.
Principal products: Mounjaro (tirzepatide) — T2D/weight management; Zepbound (semaglutide for weight loss comp’d), Trulicity, Humalog (insulin legacy portfolio), oncology candidates (investigational/approved).
Geographic exposure: Global — largest sales in U.S., substantial Europe and row markets.
Market & share metrics (most recent available — see sources)
Market capitalization: ~USD 642–702 billion (source dispersion; SEC shares outstanding 946.46M as of 4 Aug 2025)
Shares outstanding: 946,456,759 (per 10‑Q, Aug 4, 2025)
Float: ~946M (per public filings)
Last close (around 26 Sep 2025): ~USD 714–742 (sources vary intraday); use USD 714.59 (MLQ / market snapshots) as reference.
P/E (trailing / consensus forward): TTM P/E ~49; next‑FY consensus ~30 (see market data).
EV/EBITDA (market snapshots): ~38x (site snapshots).
Price performance (approx., source snapshots to 25–26 Sep 2025): 1D: -3.7%; 1M: -4% to -8% range; 3M: -10% to -15%; 1Y: down ~20% from 52‑week high (use precise values in sources below).
(Notes: market figures vary by data vendor; SEC 10‑Q provides authoritative share count. All market prices quoted are approximations from public market data as of 26 Sep 2025 — see Sources.)
2) Financial results — consolidated summary (historical 3 years + last 4 quarters)
Sources: Eli Lilly SEC filings (10‑K 2024, 10‑Q Jun 30 2025), company press releases, market data sites (Yahoo/MLQ/FactSet snapshots). All amounts USD.
Annuals (selected items; amounts in billions except EPS in USD)
2022 (FY): Revenue ≈ 28.3; Net income ≈ 5.16; Diluted EPS ≈ 5.41; FCF ≈ 8.0 (approx).
2023 (FY): Revenue ≈ 40.5; Net income ≈ 11.0; Diluted EPS ≈ 12.99; FCF ≈ 11.5.
2024 (FY): Revenue ≈ 45.0; Net income ≈ 10.6; Diluted EPS ≈ ~12.00; FCF ≈ ~12.0.
(Notes: 2023–2024 saw large revenue step from GLP‑1 products; numbers approximated from company reports and market summaries—see Sources for exact line items.)
Most recent four quarters (approx, Q3 2024 – Q2 2025)
Q3 2024: Revenue ≈ 9.5B; Net income ≈ 2.2B; EPS diluted ≈ 2.32
Q4 2024: Revenue ≈ 11.0B; Net income ≈ 2.6B; EPS ≈ 2.73
Q1 2025: Revenue ≈ 14.0B; Net income ≈ 3.8B; EPS ≈ 4.2
Q2 2025: Revenue = 15.56B (company release Aug 7, 2025); Net income ≈ 4.9B; EPS (reported) ≈ 6.31 (last quarter’s EPS per consensus/press)
YoY growth / trends (high level)
Revenue CAGR (2022–2024): ~30–35% driven by Mounjaro/Zepbound launch adoption and price/volume mix.
Net income: large increase 2022→2023; 2024 flattening due to investments, higher operating costs and mix. Q1–Q2 2025 continue strong growth.
Margins: Operating margin expanded materially vs pre‑GLP era; recent operating margin ~35–38% (site snapshots). Net margin ~23–25%.
Tabular snapshot
Table: (Year | Revenue | Net income | Diluted EPS | FCF)
2022 | 28.3B | 5.2B | 5.41 | ~8.0B
2023 | 40.5B | 11.0B | 12.99 | ~11.5B
2024 | 45.0B | 10.6B | ~12.0 | ~12.0B
Last 4Q (sum) 2024Q3–2025Q2 | ~50.1B | ~14.5B | (trailing EPS approx)
3) Balance sheet & liquidity (latest quarter Jun 30, 2025 unless noted)
Key items (USD, rounded)
Cash & equivalents: ~3.1–3.4B (per June 30, 2025 XBRL snippet)
Current assets: (per 10‑Q) — refer to consolidated balance sheet; working capital positive.
Total debt: ~38–40B (notes due 2026/2030; total debt around $39.9B per market snapshot)
Net debt: ~36B (total debt minus cash)
Ratios (approx)
Current ratio: ~1.15
Quick ratio: ~0.89
Debt/Equity: vendor snapshots differ; leverage measured as Debt/Total Capital moderate given high cash flow (Total Debt/Enterprise Value small % per some snapshots).
Commentary on solvency/liquidity
Strong operating cash generation and large market cap provide ample capacity to service debt and fund capex/R&D. Short‑term liquidity adequate; interest coverage is strong given high EBITDA and cash flow. Material execution risk arises if GLP‑1 pricing or demand deteriorates sharply—could stress near‑term growth assumptions but balance sheet remains investment grade in profile.
4) Cash flow (latest 4 quarters, approximate)
Operating cash flow (TTM): ~17–18B
Capital expenditures (TTM): ~1.5–2.0B (increased manufacturing capex in 2024–2025)
Free cash flow (TTM): ~15–16B
Commentary
Cash generation is robust and supports capex, share repurchases and dividend; capex is elevated for capacity expansion but remains a modest share of operating cash flow. FCF margin is strong and sustainable if product demand persists.
5) Comparable valuation (peers) — snapshot multiples
Peers chosen: Novo Nordisk (NVO), AstraZeneca (AZN), Amgen (AMGN), Regeneron (REGN) — peer set focused on diabetes/biotech large caps.
Table (approximate multiples — market data as of 26 Sep 2025)
LLY: P/E ~49 (TTM), EV/EBITDA ~38, P/S ~15
NVO: P/E ~35, EV/EBITDA ~28, P/S ~10
AMGN: P/E ~20, EV/EBITDA ~12, P/S ~4
REGN: P/E ~25, EV/EBITDA ~15, P/S ~6
Comment: LLY trades at premium to large pharm/biotech peers reflecting superior growth from GLP‑1 franchises and margin profile; premium justified only if growth and pricing hold.
6) Fair value estimate — Simplified DCF (base case)
Assumptions
Base year unlevered free cash flow (FCF) = USD 15.5B (TTM approximate).
Explicit forecast horizon = 5 years.
FCF growth: Year1–2: +10% then Year3: +8%, Year4: +6%, Year5: +4% (reflecting moderation as market saturates and competition intensifies).
Terminal growth rate = 3.0% (long‑term GDP/inflation real+inflation).
WACC = 8.5% (reflects large cap pharma, low beta, moderate leverage).
Calculation (rounded)
Projected FCFs:
Year1: 17.05B; Year2: 18.76B; Year3: 20.26B; Year4: 21.48B; Year5: 22.34B
Terminal value at end Year5 = Year5*(1+g)/(WACC−g) = 22.34*(1.03)/(0.085−0.03) ≈ 22.34*1.03/0.055 ≈ 418.5B
Discount PV of FCFs + terminal (discounted at 8.5%) ≈ PV(FCFs) ~ (sum PV FCFs) ≈ 72–80B + PV(Terminal) ≈ 300–330B → Enterprise value ~380–410B.
Net debt (~36B) → implied equity value ≈ 344–374B.
Divide by shares outstanding (946.5M) → implied fair price ≈ USD 363–395 per share.
Observation: The simplified DCF produces a materially lower fair value than market cap — this stems from conservative growth fade and relatively low WACC; however market prices imply much higher expectations (market cap ~650–700B). Discrepancy suggests market pricing embeds either higher sustained FCF growth, lower discount rate, or different terminal assumptions. Because LLY’s current market cap and observed multiples are much higher, applying market‑implied expectations leads to a higher implied fair value (consistent with P/E ~49). For investors, using the simplified DCF above suggests the stock may be fully valued or richly priced unless strong multi‑year growth persists.
Sensitivity
WACC ±1% (7.5% / 9.5%) with base growth: implied price range roughly USD 470 (WACC 7.5%) to USD 295 (WACC 9.5%).
Terminal growth ±1% (2% / 4%): price moves roughly USD −60 / +90 vs base.
(Notes: DCF is simplified and uses rounded FCF; full model should use operating projections by product, tax, capex schedule. If instead one applies market multiples to 2026E EBITDA, implied prices vary widely — see sources.)
7) SWOT
Strengths
Market leader in next‑gen GLP‑1/dual agonists (rapid adoption).
Strong gross & operating margins; robust FCF generation.
Diversified pipeline (oncology, CV) and global commercial footprint.
Experienced management, strong manufacturing investment.
Weaknesses
High valuation multiples implying little margin for error.
Dependence on a few high‑revenue products (Mounjaro/Zepbound).
Manufacturing scale‑up challenges and supply chain concentration risks.
Increasing SG&A/R&D investment could press short‑term margins.
Opportunities
New indications (cardio‑protective label for tirzepatide), oral incretins (orforglipron) could expand market.
International expansion and formulary wins.
Bolt‑on M&A to diversify revenue streams.
Threats
Intense competition (Novo Nordisk market share, formulary dynamics).
Payer reimbursements, pricing caps, regulatory scrutiny.
Potential adverse trial/regulatory outcomes for pipeline assets.
Macroeconomic/tighter capital markets affecting healthcare spend.
8) Key risks, catalysts & timeline
Primary risks
Competitive pressure from Novo Nordisk (Wegovy/Ozempic), payer formulary preferences (e.g., CVS formulary moves).
Regulatory/pricing risk (US and international).
Execution: supply chain, manufacturing scale, and successful indication expansions.
Concentration risk: heavy revenue share from GLP‑1 franchise.
Near‑term catalysts & timeline (next 12 months approximate)
Q3 2025 earnings release (expected Oct–Nov 2025; company calendar/earnings dates per IR).
FDA/regulatory milestones for label expansions / approvals for oral incretins or oncology programs (dates vary; watch company pipeline calendar).
Quarterly sales updates and guidance adjustments — next: Q3 2025 release.
(Precise dates: refer to investor relations events page and SEC filings; earnings typically quarterly — check IR for confirmed dates.)
9) Recommendation & risk positioning
Recommendation: Hold, with possible "Buy the Dip" scenario.
Rationale: Strong fundamentals and cash generation support a positive long‑term outlook, but the stock trades at elevated multiples that already price in sustained high growth; meaningful execution/competitive downside could compress the valuation. Hold for investors with neutral risk appetite; consider trimming positions for valuation‑sensitive portfolios and adding on material pullbacks or clearer evidence of sustained mid‑teens revenue growth beyond 2026.
Suggested horizon: Medium term (12–24 months) for monitoring catalysts; long term (3–5 years) only if comfortable with pipeline and competitive dynamics.
Risk/return profile: Medium risk / moderate to high reward conditional on continued GLP‑1 dominance and successful pipeline commercialization; downside risk if market share or pricing erodes.
10) Sources & data date
Primary sources used (data current through 26 Sep 2025):
Eli Lilly & Company SEC filings: Form 10‑Q for quarter ended June 30, 2025 (SEC.gov).
Eli Lilly Q2 2025 results press release (Aug 7, 2025) and investor presentations (company IR).
Market data snapshots and summaries: MLQ.ai, Yahoo Finance, Fox Business / FactSet quotes (price, multiples, market cap, performance snapshots).
News: Yahoo Finance, PR Newswire coverage of Q2 2025 results.
Kenvue Tylenol Turmoil: Does the 33% Drop Scream Undervalued?While many stocks (especially tech) are near all-time highs and have high PE ratios, I'm still hunting for bargains, and Kenvue seems to be relatively cheap. More recently, it came under fire because of Trump's remarks on Tylenol, and the stock lost over 10% in a few days.
Since May 2025, the stock has lost 33%, putting it, in my opinion, in an undervalued zone.
Kenvue is the manufacturer of a bunch of health-related products, including Tylenol, Neutrogena, Band-Aid, Listerine, Benadryl, Zyrtec, Motrin, Aveeno, Johnson's, Rogaine, and many more.
I like this kind of health-related beaten-down stocks because they exhibit good uncorrelation with the rest of the stock market, and in bear markets, they tend to hold up well because people always need to buy healthcare products.
WHY BUY KENVUE STOCK?
The stock has a strong moat, with excellent market penetration, top-of-mind brand recognition, and consumer loyalty, as well as economies of scale, worldwide.
They have great management, with Kirk Perry and Andy Dasgupta leading the company. This guy has a great track record in the consumer product sector.
Despite the decent performance, the stock price is now at an all-time low.
KEY NUMBERS AND FUNDAMENTALS
Where should I start... Since they spun off from Johnson & Johnson, the stock is now the cheapest when compared to their revenue, income, and other metrics.
Diluted EPS is now at $0.22. The same level as in 2023, when the stock was at $24. The difference is that the stock is now at $16 (33% cheaper).
The dividend ratio is now at 5%, the best level ever. The last time it was this close to the current level was in mid-2024, when the dividend yield reached 4.6%. After that, the stock rose by 38% in less than 6 months. If you like dividends, you should definitly take a look at Kenvue.
The PE ratio is 22, which is low compared to the sector and the company's historical data.
Similar story for the PB ratio, which is now at an all-time low.
This data is telling us that the stock is comparatively cheap. Of course, one needs to ask: Is it cheap because of poor prospects for the company, or because the market is overly fearful? I'd lean for the second.
It's also worth adding that their gross margin is 58%, the EBITDA margin is 24% (quite good), and the forward PE is at around 15.
Finally, the analyst's price targets average $22, giving it an upside of around 34%.
MY GAMEPLAN
I'm going to allocate close to 1% of my net worth to this stock. In case the price drops, I will average down my purchasing price, considering that this company is likely to continue having a very strong moat for the coming years.
I plan to hold it for the medium/long term, potentially selling part or the entirety of my holdings once I get over 30% return. I will re-evaluate it later this year.
Quick note: I'm just sharing my journey - not financial advice! 😊

XAIR - Beyond Air - $4.96 Retest - $6.88 PTNASDAQ:XAIR had a breakout from a larger Descending Wedge that it broke out of and continued consolidation. The company's catalyst: FDA Orphan Drug Adoption for Brain Cancer Drug Candidate.
Looking for some consolidation back to that level or projected support, seeing we're not finding support, but resistance currently at the $4.35s which it's need some continued support to push up from here.

NBY - NovaBay Pharm - Missing AnalysisNot even going to say anything on this one. But she's a cranker! If you're still interested in entry (and if she even consolidates at this point), we would look for that high price level to play support as it previous resistance. Not even going to speculate beyond that at this point. The chart speaks for itself.
The company recently announced a one-time special cash divided of $0.80 per Share and the stock has just been soaring since.

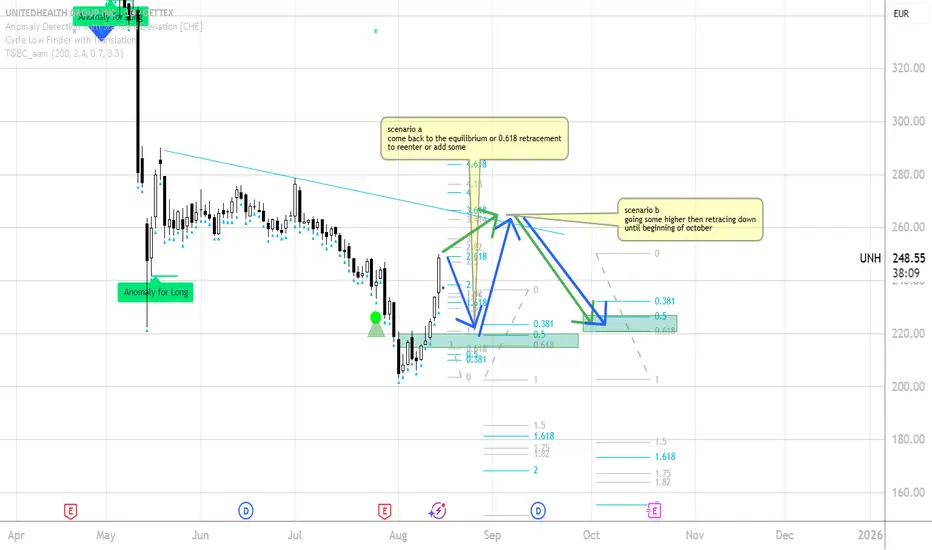
UNITED HEALTH UNH - Two scenarios based on my understanding a sescenario a:
coming back to the 50% or 0.618 retracement then up, then in a typical seasonal bearish period down until beginning of october
scenario b:
First target could be at the descrending trendline then retracement until beginning of october
to the 50% or 0.618
this is of course not a trade call or advide. for educational purpose only...
please comment or chat with me about it!
cheers!
Eli Lilly (LLY) – Pharma Giant at a Key Price LevelHi,
Eli Lilly & Co. is one of the world’s largest pharmaceutical companies, founded in 1876 and headquartered in Indianapolis. It operates in over 125 countries and is best known for blockbuster treatments in diabetes, obesity, oncology, and immunology. Recent growth has been driven largely by its GLP-1 class drugs Mounjaro and Zepbound, which have quickly become industry leaders in the weight-loss and diabetes markets.
Recent Fundamentals (Q2 2025)
Revenue: $15.56 B (+38% YoY)
- EPS: $6.31 (beat expectations)
- Mounjaro sales: $5.2 B
- Zepbound sales: $3.38 B
- Full-year guidance: Revenue $60–62 B, EPS $21.75–$23.00
- Margins: Gross margin ~82.6%, net margin ~25.9%
- Profitability: ROE ~75.5%, ROIC ~29.6%
While fundamentals remain strong, the recent Phase III data for the oral weight-loss pill orforglipron came in below expectations, sparking a ~14% drop, the stock’s steepest one-day decline in decades. Analysts have since trimmed long-term sales forecasts for this product.
From a valuation perspective, the stock trades at a premium (~41× P/E, ~10.7× P/S), leaving little room for major disappointments.
Technicals
Technically speaking, the price has arrived in the zone where I’ve been patiently waiting to share it as an idea. This is a good area from where to start building positions if you’re interested.
There are quite a few technical confluence factors aligning here, but be ready to grab it also around $500 if the market offers it. Let that be your guide:
- If you’re not willing to hold long-term, don’t touch it.
- If you’re not willing to buy more at lower prices, don’t touch it.
Good luck,
Vaido

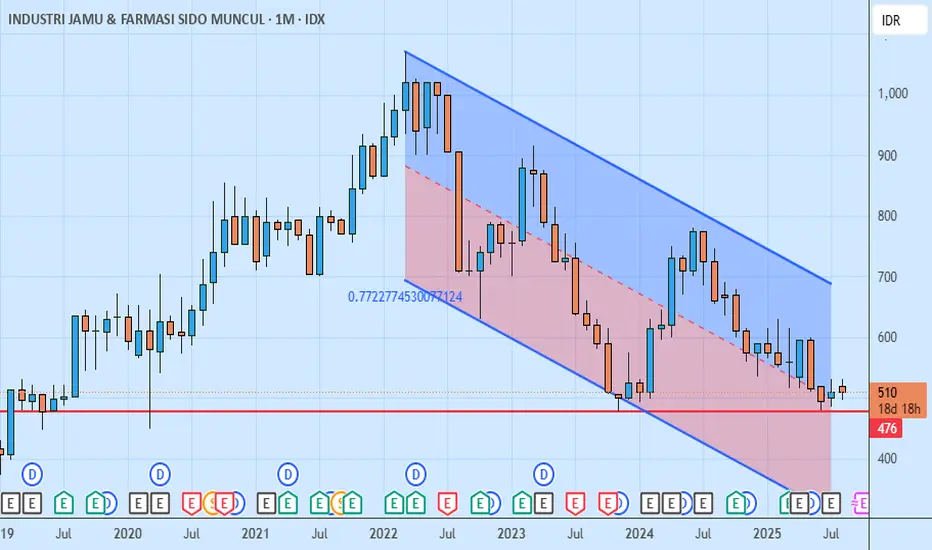
SIDO On the Crossroads?SIDO was a VERY reliable asset on my portfolio since the pandemic. It fell in the aftermath, but we can always hope for a meaningful recovery as the company is pretty much perfect on the books. But it fell so hard since mid-2024.
I stopped buying SIDO since then, though I still keep it on my portfolio for the sake of dividends. Now, I am thinking of buying it again.
On June, SIDO has touched multi-year lows under 500. Then it slowly woke up to just slightly above 500 now. Sufficient reasons to think it may temporarily go sideways or rise till the next stopover at 600-ish.
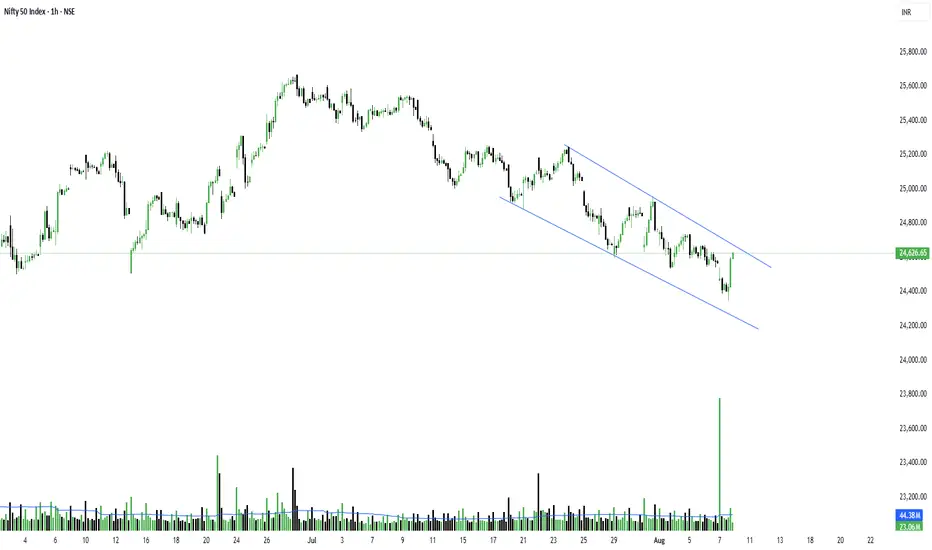
Nifty is bullish but the concern is...Total Volume and closing were strong today — that’s a good sign.
But the only concern is that sellers' volume was 218 million more than buyers. That’s a big gap and something we can’t ignore.
NSE:NIFTY Pivot is at 24,524, and Pivot Percentile is 0.29% — that’s slightly high, so expect volatility.
If Nifty opens with a gap down and then sustains above the Pivot for 1 hour, we might see a good upside, and it would be worth chasing.
A gap-up open won’t be ideal — a controlled open near the pivot is better.
Apart from sellers’ volume, everything else looks bullish.
Even the options data is pointing toward a move up, with a target zone near 24,800.
So, my view for tomorrow is cautiously bullish.
NSE:BANKNIFTY is looking much stronger than Nifty.
This time, the rally might be led by NSE:CNXPSUBANK .
- Support: 55,294
- Resistance: 55,650
If BankNifty moves, chances are Nifty will follow as well.
Top Sectors to Watch:
NSE:CNXIT
NSE:CNXPHARMA
If you remember, I had mentioned earlier — this time when the market starts bouncing back from the bottom, IT sector will be the first to run.
That’s all for today.
Plan your trade and Trade your plan.
Take care. Have a profitable tomorrow.
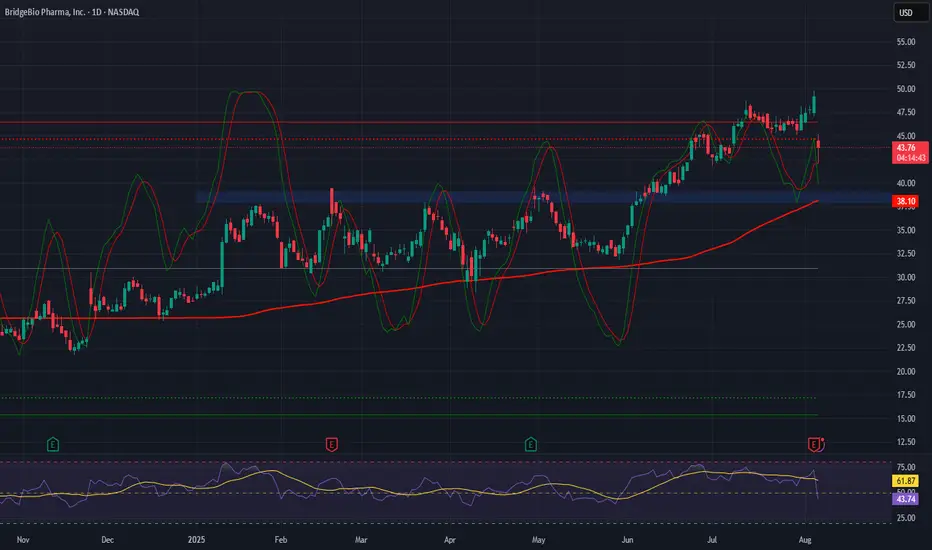
BridgeBio – Blockbuster Launch Fuels Global Biotech Momentum Company Snapshot:
BridgeBio Pharma NASDAQ:BBIO is transitioning into a commercial-stage growth story, anchored by its breakthrough ATTR-CM therapy Attruby (acoramidis) and a deep genetic disease & oncology pipeline.
Key Catalysts:
Attruby Launch Off to a Strong Start 🚀
$36.7M in first full-quarter sales from 2,072 unique prescriptions
Pivotal data:
42% reduction in all-cause mortality
50% fewer cardiovascular hospitalizations over 30 months
Positions Attruby as a potential first-line standard of care in ATTR-CM.
Global Expansion in Motion 🌐
Regulatory approvals secured in Europe, Japan, and the UK.
Strategic launch partnership with Bayer to accelerate physician adoption and market penetration.
Smart Capital Strategy 💰
Secured $300M in non-recourse funding via partial monetization of European royalties.
Funds a strong commercial push while retaining long-term upside from BEYONTTRA™ sales.
Robust Pipeline Depth 🧬
Over 30 clinical and pre-clinical programs, offering multiple shots on goal beyond Attruby.
Investment Outlook:
Bullish Entry Zone: Above $38.00–$39.00
Upside Target: $60.00–$62.00, driven by blockbuster drug momentum, global rollout, and pipeline expansion.
📈 BBIO has the dual advantage of a de-risked lead asset and a rich R&D pipeline—positioning it for sustained multi-year growth.
#BBIO #Biotech #Pharma #ATTRCM #Cardiology #DrugLaunch #PipelineGrowth #BayerPartnership #GlobalExpansion #ClinicalTrials #GeneticDiseases #Pharmaceuticals
Novo Nordisk (Revised) | NVO | Long at $47.78**This is a revised analysis from February 5, 2025: I am still in that position, but added significantly more below $50**
Novo Nordisk NYSE:NVO is now trading at valuations before its release of Wegovy and Ozempic... From a technical analysis perspective, it's within my "major crash" simple moving average zone (gray lines). When a company's stock price enters this region (especially large and healthy companies) I always grab shares - either for a temporary future bounce or a long-term hold. While currently trading near $47 a share, I think worst case scenario here in 2025 is near $38-$39. Tariffs may cause a recession in the second half of 2025, so no company would be immune.
As mentioned above, I am still a holder at $86.74. However, I went in much heavier within my "major crash" simple moving average band and have a final entry planned near $38-$38 (if it drops there). My current cost average is near $55.00.
Why do I still have faith in NYSE:NVO ? Because no one else does right now, yet it generated $42 billion in revenue, $14 billion in profits, and has significant cash flow YoY. The company has a massive pipeline, despite Wegovy and Ozempic competition, and I think the market is undervaluing its position in the pharmaceutical industry.
Revised Targets in 2028:
$60.00 (+25.6%)
$70.00 (+46.5%)
$80.00 (+67.4%)
