TCS BULLISH Pinbar at breakoutTCS very bullish at CMP 3217, SL 3160, Targets- 3400, 3500, 3700
TCS just broke out of a year long downtrend, and with less than a 3% risk, one can aim for amazing returns.
This idea is based on the pinbar on the last trading day and for a better trade, advisable condition would be a breakout above 3275 with an SL of previous swing.
Pin Bar

MSFT- found intermediate supportMSFT gapped down into intermediate support @ 220 today (after another round of "bad" CPI report that spooked the markets) but immediately reversed to form a bullish engulfing candle on the daily chart (and a potential pin bar on weekly chart).
Bullish divergence can be seen on both the weekly and daily charts which gave more conviction to this current support @ 220 (medium term resistence turned support)
Granted that a bounce from an bullish divergence can be just a short term counter trend (in a bear market), this support at 220 is still significant unless it is breached to the downside.
Disclaimer: Just my 2 cents and not a trade advice. Kindly do your own due diligence and trade according to your own risk tolerance and don't forget that money management is important! Take care and Good Luck!

REVIEW $POOLIt's the ability to believe in the unpredictability of the game at the micro-level and simultaneously believe in the predictability of the game at the macro level that makes the casino and the professional gambler effective and successful at what they do.

Topglove. JP Morgan’s TP May “failed” this time. 1/Oct/22Topglove. JP Morgan’s Projection of RM0.45 probably “failed” this time. As other 3 major player already posing a bullish reversal setup based on Elliott wave and cycle. Just waiting for “confirmation” signal. Topglove price has just broken RM0.605 a “confirmation signal “ +++ Price of weekly Topglove, kossan and monthly Harta has formed a hammer candle/ pin bar bullish pattern possible market “price in” A.S.P ( Average Selling Price) increment lead by Topglove as “catalyst” of the beginning of long term bull trend after long term “correction “ since August/Oct 2020..

Pip Goal: 185.0 Pips (NZDCAD)Rejection Candlestick (Pin Bar) formed on the Daily Time Frame. Enter a short position.

SPY - Short term bullish - Quick TradeHello Friends,
AMEX:SPY has shed a lot of value in a week but there seems to be some good news if you're looking for a very short term bullish trade. We will have to understand supply/demand levels on multiple time frames.
In a daily TF, Price opened gap down, approached a daily/weekly demand zone and closed within top 33.3% of a candle range(Bullish Pin bar candlestick). Bullish pin bar with a good volume suggests the presence of demand. There's a gap to be filled. So our first target is at the upper bound of a gap around 373.44. I like to use anchored VWAP as a dynamic support/resistance and also as an additional confirmation for the target. In a downtrend, I drop anchored VWAP from a recent swing high to find dynamic resistance level which is currently at 386. There's a visible supply zone between 381 and 390. So if price is able to breach our first target then the next safe target would be at 381. Target levels are marked on the chart below.
Zooming into 45 minutes TF, it is visible that before price opened gap down, there was a supply zone forming. Our first target is actually a lower bound of a supply zone. Additionally, a bullish RSI divergence is also visible which is an additional confirmation for price reversal.
Similar confirmations are found in 15 minutes TF as well.
Remember, Overall market is still bearish so you have to be very nimble while trading against the trend. A good trader always find opportunity in any market conditions!
Do you agree with my analysis? Please let me know your thoughts by commenting below and follow me for more such ideas. Happy and safe trading! :)

SPX - bullish divergence (short term bounce next? )SPX closed with a small pin bar on huge volume last Friday, coupled with a potential bullish divergence between price and RSI (daily chart), it Looks like we can expect yet another bounce soon. However, divergence usually result in a short term reversal (lasting 2 or several candles) and may not translate into a longer term trend reversal.
The last 3 weekly candles of SPX has formed a broadening "pennant", a pattern that signify a market that has been highly volatile with little to show in direction in the last 3 weeks.
So while we may expect some bounce next, it is probably just more whip saws in the near term, especially when most of the market leaders (mostly the MAANGT stocks are still weak (except perhaps NFLX and TSLA) aren't showing signs of having bottomed yet.
While there may be some stocks that have started to break up from base formations, only a handful are able to successfully trend up without too much volatility.
Let's wait for S&P be able to rise above the longer term resistence line (red) eventually, then perhaps we will have a more sustainable market recovery. Meanwhile, stay safe.
Disclaimer: Just my 2 cents and not a trade advice. Kindly do your own due diligence and trade according to your own risk tolerance and don't forget that money management is important! Take care and Good Luck!

Goal: 3342.2 Units (EURZAR)EURZAR Target Price 17.731. Pin Bar tail protrudes through a previous pivot point at price 17.327.

AUDNZD, Parallel Channel, Pin Bar, EMA 10, EMA 20AUDNZD still has not budge. I entered a long position based off the R1 Value, EMA 10, EMA 20, Pin Bars, and Descending Parallel Channel.


SPX and NQ - short term bounce comingAfter retracing 61.8% of the recent AB up swing (that lasted 2 months from 17 June to 16 Aug), the market finally seem to be finding support yesterday, forming a bullish pin bar and a potential bullish divergence between price and stochastics.
However note that a bullish divergence usually signify a SHORT TERM trend reversal (lasting only several candles) and may not translate into a longer term trend reversal.
There is a chance we could be in a whipsaw market for a while more. Need to be nimble still until we see a clearer picture.
Stay safe.
Disclaimer: Just my 2 cents and not a trade advice. Kindly do your own due diligence and trade according to your own risk tolerance and don't forget that money management is important! Take care and Good Luck!

Breakout StrategyPrice is in structured downtrend and it formed breakout + retrace formation and expecting to reach 0.794

Pinbar candle on demand zone?ETH 4h chartSo previous idea on ETH went perfect! (Check it if you haven’t seen it yet)
Following the analysis,we notice a pinbar candle on 4H ETH chart on demand zone which could lead to higher prices.but since the ascending wedge I told you about it the previous idea broke down,every upside is considered a pullback and an opportunity to sell or short.good luck all!

Strong Trading Strategy, Do not trust all the pin barsThe pin bar pattern is one of the best signals on any market for predicting the next move. But should you trust all pin bars? In my humble opinion, NO, and I’m explaining this idea below and the approach I take to distinguish valid pin bars from invalid ones.
I suppose you already know what is a pin bar, so I’ll not explain its basic details here. If you don’t know please, do a search and read its basics first.
I have 3 filters for my pin bars. Find them below and boost the idea if you liked it :)
1- What should it look like?
In my opinion, having a candle with a shadow (wick) longer than the other and a small body is not the only factor to call it a pin bar. I filter pin bars by expecting some pre-defined proportions and ratios between body size and shadow lengths. Here are my rules:
The body must be at least 2% of the candle height.
The long shadow must be at least 4 times bigger than the body.
The long shadow must be at least 2 times bigger than the short shadow.
I know you are rightly thinking about how to calculate them, but do not! There is a simple indicator that does this calculation and highlights the pin bars for you, the Abnormal Pin Bar indicator . You just need to set it up with your values. You can even set up an alert to let you know when a pin bar is shaped.
These are my rules and values that fit my strategy, you can use them. Also you can do your own tests to find the values that fit your psychology and your strategy. You can say you prefer a pin bar that has a bigger body than yours! it’s okay, just do your own tests to make sure it works for you.
2- What is behind that?
Always inspect the smaller timeframe to check if the sub-candles that shaped the pin bar confirm its bearishness or bullishness. Yes, you should always see the big picture but remember, all the moves start from smaller timeframes. You shouldn't expect too much from a movement with bad groundwork.
For a bullish pin bar, its bullish sub-candles must overcome the price action and volumes of its bearish ones, and on the other hand, for a bearish pin bar, its bearish sub-candles must surpass the price action and volumes of its bullish sub-candles.
It would be nice to write a long and detailed article about bearish and bullish sub-candles competition and when they overcome each other. It's not something you decide just by comparing the number of bullish and bearish sub-candles! Long story short, it’s all Price Action and Volume Analysis. and my favorite one is when the volume of sub-candles in one direction surpasses the volume of the candles in the opposite direction. Or you can look for volume and price anomalies.
What is the volume and price anomaly?
The volume and price anomaly is a simple pattern that occurs in two consecutive candles. Assuming two descending candles or two ascending candles in a row, if the body of one candle is bigger than the other one, we expect its volume to be larger, or if the body of one of them is smaller, we expect its volume to be small. Now, if this pattern is not observed for two consecutive candles, we call it a volume and price anomaly.
For example, a candle has a larger body than the previous candle, but its volume is smaller than the previous candle. Or a candle that has a smaller body than the previous candle, but its volume is greater than the volume of the previous candle!
Anomaly Confirmation Candle:
In most cases, after the volume anomaly, I wait for a confirmation candle. This candle will be a bearish candle for a bullish anomaly and will be a bullish candle for a bearish anomaly. The volume of the confirmation candle is very important in anomaly, and in addition to its shape and size, you should also pay attention to its volume.
I just explained the anomaly here to give you a point of view and perspective. I don't want to make this idea overlong so I do not go into more details. Maybe it would be a subject for another idea ;)
In which timeframe should the inspection be done?
You will understand which timeframe you should choose to inspect a pin bar sub-candles by experiencing it over time, but I personally consider two things:
1- The timeframe must be well-known and be used by not only me but also by most traders.
2- It must contain at least 4 sub-candles. e.g. for a daily pin bar, 12h reveals only 2 sub-candles while 4h reveals 6.
For example, for a closed daily pin bar, it would be a good check to inspect candles for the 4h timeframe. or after a weekly pin bar close, you can check the candles of the last 7 days.
Consider this instruction and practice on the chart to see the result.
If one of the pin bars in sub-candles is also a pin bar, do the same inspection for it.
3- On there any key level around?
A pin bar is an important pattern but one that touches a trend line or any important level is leading! The combination of a key level and a valid pin bar is something very valuable and instructive. It's definitely not to be missed, provided you do your own analyses.
Prioritising trend lines and important levels always makes my decision easier when a pin bar spawns near to more than one significant level.
Check twice if you face a pin bar in peaks, troughs, resistance or support areas, supply and demand zones, or as a rejection from a trend line.
You can use the Trend Key Point indicator to highlight important levels. Additionally, there is a guide about its usage .
Bonus Tips:
Pin bars on bigger timeframes are more reliable.
If there are lots of pin bars shaped on a chart, think twice, select a bigger timeframe, or do not use this strategy on that specific asset.
For two valid pin bars in a row, the one with a bigger volume is more important to me.
Check twice if the volume of a pin bar is bigger than the volume average.
Check twice if the volume of a pin bar is bigger than the volume of its previous candle.
Do you have any questions? ask in the comments.
Do not hesitate to write your opinion about this idea.
I'd appreciate if you share this idea with your network.

High Probability Setup on CSCO!I've identified a high probability setup on Cisco Systems (CSCO).
Confluences-The daily chart has a bullish pin bar on a support level and on the 20 EMA!
*This is not financial advice.
I really like this trade setup for this week!
Loved and Blessed,
MrALtrades00

NZDUSD SHORT SWINGIts about time. Potential Move to 0.60000 to complete cycle of Quarter Levels. Have posted this severally and was waiting for a confirmation. Current reversal level has seen price break the Monthly High Price and pull back. This could be a Fake move to induce Long position since the Monthly Bar just closed was a PIN BAR. A high chance that retail traders will trade the PIN BAR long a.k.a Price Action.

Uptrend Signal in the Ranging marketMarket is ranging quite long time and still it is part of uptrend move. Two days before market printed the Bullish Pinbar and expecting to go further high.

ATOMUSDTThe basic idea is that some pin bars will retrace to around 50% of the tail, so we can look to enter there with a limit order.
This provides a tight stop loss with our stop loss just above or below the pin bar high or low and a large potential risk reward on the trade as a result.

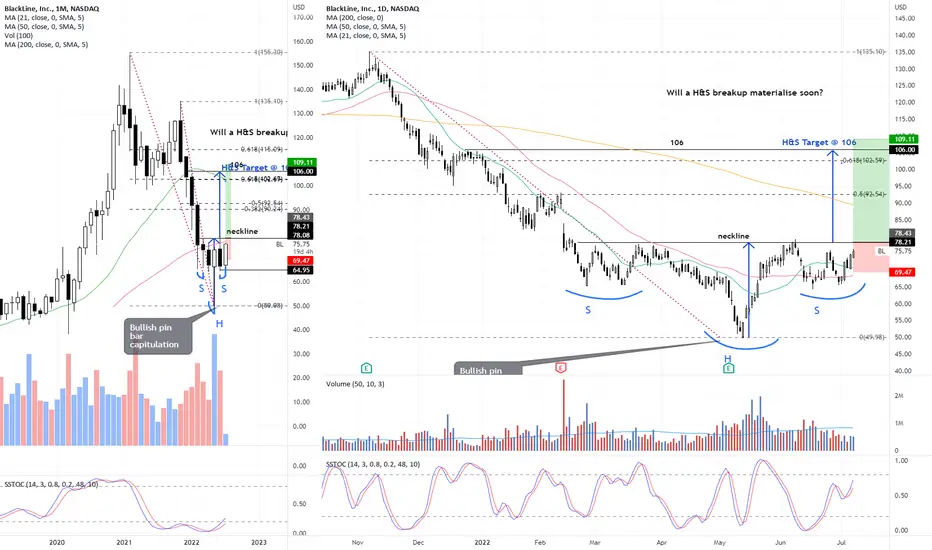
BL - potential bullish H&S PatternIt is likey the low of 49.66 hit on 12 May is "the" low for now as we see a bullish pin bar has formed on the monthly chart on relatively high volume.
Now appears to be forming the right shoulder of a Head and Shoulders pattern with neckline around 78. A breakup of this neckline (preferably on relatively good volume) will likely mean the stock has turned the corner with a possible H&S target for around 106.
Disclaimer: Just my 2 cents and not a trade advice. Kindly do your own due diligence and trade according to your own risk tolerance and don't forget that money management is important! Take care and Good Luck!
DXY - Weekly bearish divergence! + Elliott Wave + PIN BAR!- As per my Elliott Wave technical analysis - it looks like the massive impulse wave can be completed and we are now headed to a retracement.
- On the weekly chart we have a shooting star - bearish candle with a long wick ( PIN BAR )!
- If we take a look at the RSI indicator on this chart, we can see a bullish divergence , which is a pretty strong bearish signal.
- We don't really know how deep the retracement will be, but we can go back down to the acceleration point + 0.618 FIB.
- MACD histogram is going down and loosing momentum, which is a sign of weakness.
- Look at my ideas about Bitcoin, Ethereum and TOTAL crypto cap in the related section down below ↓
- For more content, please hit "Like" & "Follow"!

POWERFUL PIN-BAR SHOOTING STAR. BELOW THE ICHIMOKU , LONG WICKS Powerful Pin-bar Shooting Star.
Price Below The Ichimoku Cloud - Tested Return To Cloud And Was Rejected.
A Veritable Forest Of Long Upper Wicks.
Bear.
Drop Of Price Imminent.

GJ Long entryGJ produces a lovely pinbar, Oil is rising and we can buy GJ and aim for considerable rises. Best of Luck.

SPY SHORT - SUPPLY, LIQUIDITY, PITCHFORKWe are at a supply orderblock which caused a break of structure below. Upon reaching the orderblock, we saw a pinbar + inside bar combination pattern. Not only that, we are reacting to the upper parallel line of the pitchfork. We can target the imbalance and equal lows liquidity below.
