Wait for flag breakoutSee chart setup. Bullish flag, current support by 30's SMA. If the last daily high gets broken I expect another impulse move to the upside and also a break of the double-top to the upside. Looks bullish. Wait and see.
Next report date
≈
May 1
Report period
Q1 2025
EPS estimate
0.38 USD
Revenue estimate
167.33 M USD
2.59 USD
161.17 M USD
653.34 M USD
51.80 M
About BlackLine, Inc.
Sector
Industry
Headquarters
Woodland Hills
Website
Founded
2001
FIGI
BBG0029KJVB0
BlackLine, Inc. engages in providing a cloud-based software platform that automates and controls financial close and accounting processes. It operates through the United States and International geographical segments. The company was founded by Therese Tucker in May 2001 and is headquartered in Woodland Hills, CA.
6.5%
17.5%
28.5%
39.5%
50.5%
Q4 '23
Q1 '24
Q2 '24
Q3 '24
Q4 '24
0.00
45.00 M
90.00 M
135.00 M
180.00 M
Revenue
Net income
Net margin %
Revenue
COGS
Gross profit
Op expenses
Op income
Non-Op income/ expenses
Taxes & Other
Net income
0.00
45.00 M
90.00 M
135.00 M
180.00 M
Revenue
COGS
Gross profit
Expenses & adjustments
Net income
0.00
45.00 M
90.00 M
135.00 M
180.00 M
Q4 '23
Q1 '24
Q2 '24
Q3 '24
Q4 '24
0.00
400.00 M
800.00 M
1.20 B
1.60 B
Debt
Free cash flow
Cash & equivalents

BlackLine's breakout: Stock trading idea for 6/03/2024Shares of the accounting software developer BlackLine will be included in the S&P SmallCap 600 index starting from the trading session on 18 March. This index comprises companies with modest market capitalisations of up to 3.6 billion USD. Inclusion in the index means that the stock will automatical


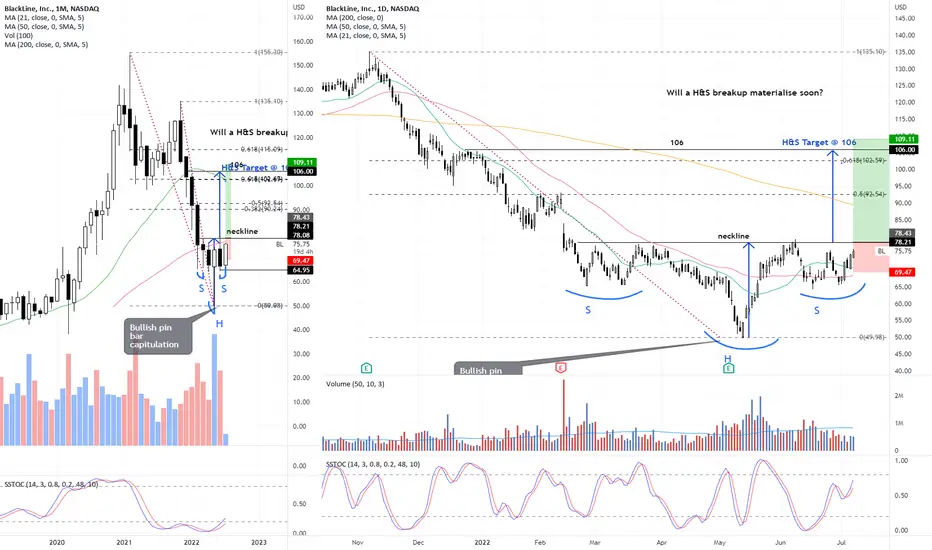
BL - potential bullish H&S PatternIt is likey the low of 49.66 hit on 12 May is "the" low for now as we see a bullish pin bar has formed on the monthly chart on relatively high volume.
Now appears to be forming the right shoulder of a Head and Shoulders pattern with neckline around 78. A breakup of this neckline (preferably on rela
BlackLine-Time to buyBlackLine holds its RSI support. Also, you can easily see that it has broken its RSI descending channel.
From the MACD point of view, it has a hidden divergence, as shown in the chart.
From an overall perspective, it is a golden time to buy BL!!
The target points are indicated in the charts.


See all ideas
Summarizing what the indicators are suggesting.
Neutral
SellBuy
Strong sellStrong buy
Strong sellSellNeutralBuyStrong buy
Neutral
SellBuy
Strong sellStrong buy
Strong sellSellNeutralBuyStrong buy
Neutral
SellBuy
Strong sellStrong buy
Strong sellSellNeutralBuyStrong buy
An aggregate view of professional's ratings.
Neutral
SellBuy
Strong sellStrong buy
Strong sellSellNeutralBuyStrong buy
Neutral
SellBuy
Strong sellStrong buy
Strong sellSellNeutralBuyStrong buy
Neutral
SellBuy
Strong sellStrong buy
Strong sellSellNeutralBuyStrong buy
Displays a symbol's price movements over previous years to identify recurring trends.
BL5389229
BlackLine, Inc. 0.0% 15-MAR-2026Yield to maturity
4.21%
Maturity date
Mar 15, 2026
US9239BAE9
BLACKLINE 24/29 CVYield to maturity
2.02%
Maturity date
Jun 1, 2029
See all BL bonds
Curated watchlists where BL is featured.

Frequently Asked Questions
The current price of BL is 44.10 USD — it has decreased by −4.30% in the past 24 hours. Watch BlackLine, Inc. stock price performance more closely on the chart.
Depending on the exchange, the stock ticker may vary. For instance, on NASDAQ exchange BlackLine, Inc. stocks are traded under the ticker BL.
BL stock has fallen by −12.01% compared to the previous week, the month change is a −8.07% fall, over the last year BlackLine, Inc. has showed a −32.10% decrease.
We've gathered analysts' opinions on BlackLine, Inc. future price: according to them, BL price has a max estimate of 80.00 USD and a min estimate of 51.00 USD. Watch BL chart and read a more detailed BlackLine, Inc. stock forecast: see what analysts think of BlackLine, Inc. and suggest that you do with its stocks.
BL stock is 7.11% volatile and has beta coefficient of 0.95. Track BlackLine, Inc. stock price on the chart and check out the list of the most volatile stocks — is BlackLine, Inc. there?
Today BlackLine, Inc. has the market capitalization of 2.77 B, it has decreased by −4.42% over the last week.
Yes, you can track BlackLine, Inc. financials in yearly and quarterly reports right on TradingView.
BlackLine, Inc. is going to release the next earnings report on May 1, 2025. Keep track of upcoming events with our Earnings Calendar.
BL earnings for the last quarter are 0.47 USD per share, whereas the estimation was 0.50 USD resulting in a −6.40% surprise. The estimated earnings for the next quarter are 0.38 USD per share. See more details about BlackLine, Inc. earnings.
BlackLine, Inc. revenue for the last quarter amounts to 169.46 M USD, despite the estimated figure of 168.37 M USD. In the next quarter, revenue is expected to reach 167.33 M USD.
BL net income for the last quarter is 56.42 M USD, while the quarter before that showed 17.24 M USD of net income which accounts for 227.28% change. Track more BlackLine, Inc. financial stats to get the full picture.
No, BL doesn't pay any dividends to its shareholders. But don't worry, we've prepared a list of high-dividend stocks for you.
As of Apr 6, 2025, the company has 1.83 K employees. See our rating of the largest employees — is BlackLine, Inc. on this list?
EBITDA measures a company's operating performance, its growth signifies an improvement in the efficiency of a company. BlackLine, Inc. EBITDA is 70.58 M USD, and current EBITDA margin is 10.81%. See more stats in BlackLine, Inc. financial statements.
Like other stocks, BL shares are traded on stock exchanges, e.g. Nasdaq, Nyse, Euronext, and the easiest way to buy them is through an online stock broker. To do this, you need to open an account and follow a broker's procedures, then start trading. You can trade BlackLine, Inc. stock right from TradingView charts — choose your broker and connect to your account.
Investing in stocks requires a comprehensive research: you should carefully study all the available data, e.g. company's financials, related news, and its technical analysis. So BlackLine, Inc. technincal analysis shows the strong sell today, and its 1 week rating is strong sell. Since market conditions are prone to changes, it's worth looking a bit further into the future — according to the 1 month rating BlackLine, Inc. stock shows the sell signal. See more of BlackLine, Inc. technicals for a more comprehensive analysis.
If you're still not sure, try looking for inspiration in our curated watchlists.
If you're still not sure, try looking for inspiration in our curated watchlists.