GBPUSD - Bullish BatA Bullish Bat pattern form with a nice long shadow candle(some call it a pin-bar), pose a great buying opportunity for Trend Traders who are looking to long from the 1-hourly time frame.
Pin Bar

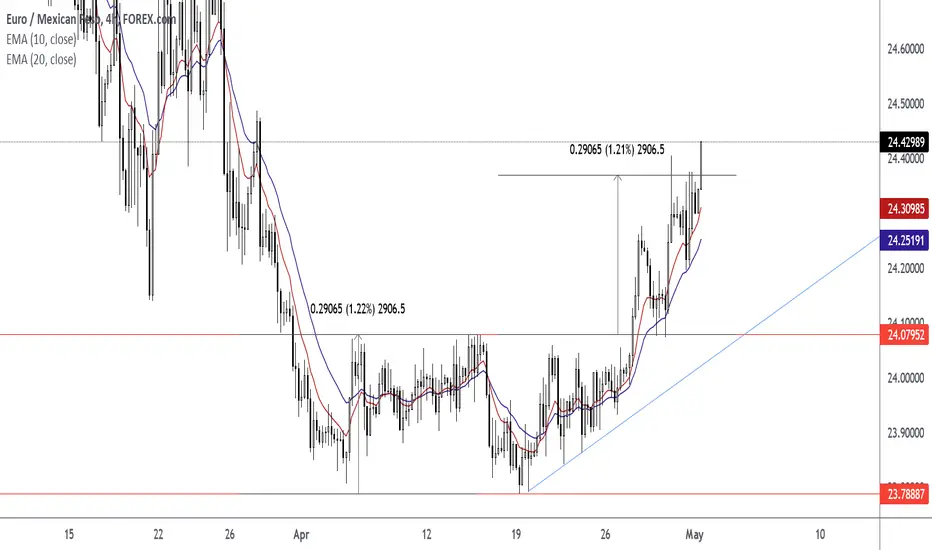
How To Trade The Ascending Triangle + Double Bottom ComboWait For The Close Above the Neckline at Horizontal Level 24.07952. After the close above level; resistance level turned support.
Wait For The Retest Of The Neckline At 24.07952. Watch For A Pin Bar or Rejection Candlestick to form at the horizontal neckline.
Enter Trade At The Closing Price Of Pin Bar or Rejection Candlestick.
Set Target Price Using Measured Objective Of Pattern. Measured Objective Is 24.37017. Measured Move Is 2906.5. Height Is 2906.5.
Exit Trade At Target Price.
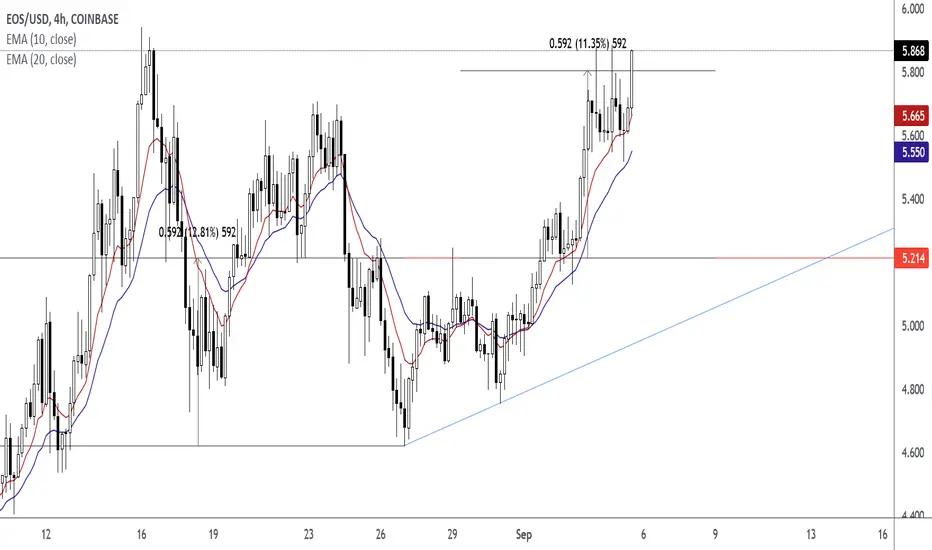
How To Trade The Ascending Triangle Trading The Ascending Triangle
Wait For The Close Above The Horizontal Level
Wait For The Retest in the form of a pin bar or rejection candlestick.
Enter At The Close Price of Pin Bar or Rejection Candlestick
Exit At The Measured Objective of Pattern. The Height of Pattern is 592.

EURJPY - Bearish SharkShark Pattern, this is what shark pattern really is. If you got stung out on the same shark pattern and once it has grown into the next entry price, the textbook case suggest that you should still engage the trade should the candlestick confirmation come by.
Compare to its peers, USDJPY, this is the more well-liked set-up as it was a trend trading setup, unlike the USDJPY, counter-trend setup.
I will have to wait for the candle to close at 9 pm (+8GMT) which is 16:00(UTC +3). If a pin bar, or long shadow I will be looking for a shorting opportunity.

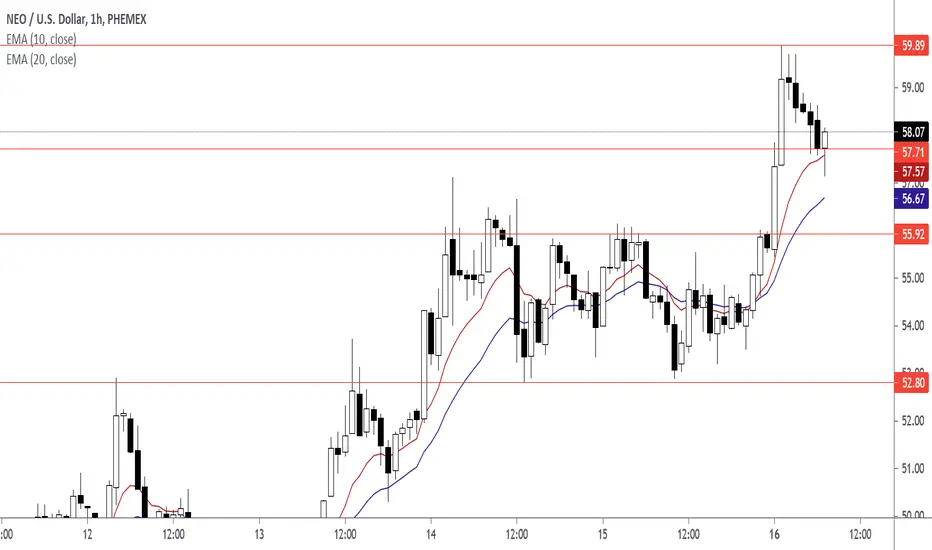
NEOUSD Target Price 60.37NEOUSD Entry Price 51.66. Pin Bar Close Price is 51.66.
50% Fibonacci Retracement Level Price is 50.48.

GOLD before the FOMC MinutesToday we're expecting the FOMC Minutes, which are very likely to cause some moves in price.
In the last few days we've been talking about a possible reversal on GOLD.
This will be a good moment for such an event. We could see price fluctuating and then maybe a downfall in price.
The ideal scenario is still seeing price above 1800, then to wait for a reversal candle and then a drop from there.
We will be looking for a move down and below 1700, and if this will happen then market shouldn't break above 1830.
Follow us to see what happens next.

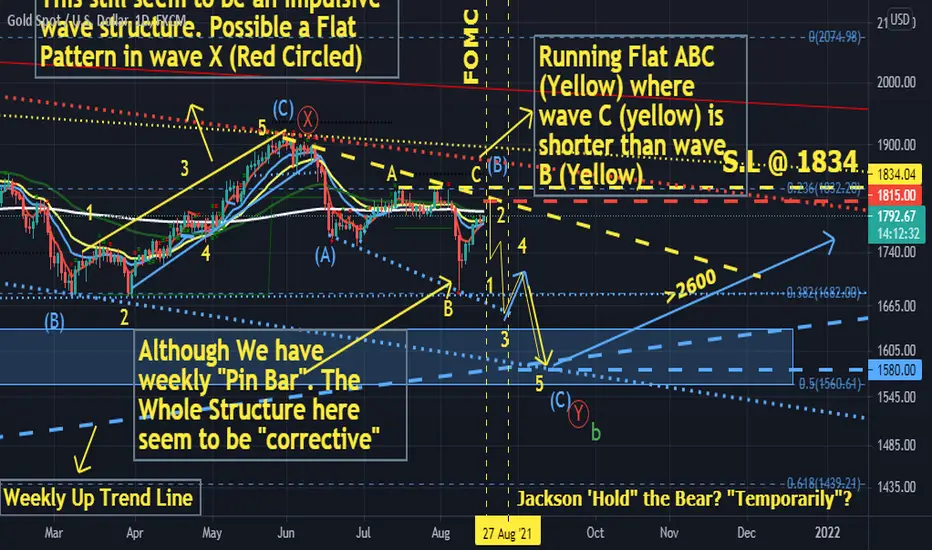
GOLD maybe @ wave C(Yellow) of flat pattern. 18/8/21GOLD possible now at wave C (yellow) of running flat pattern . Where wave C (yellow) is shorter than wave B (yellow) . Meant Theoretically.... Price Should be "capped" below 1834 for the validation of the wave structure.. Although we've "seen" a "Long Tail" "Pin Bar" on weekly chart. But Current Price Movement "Ranging " between 1834 -1680 still look "Corrective"....
How To Trade Quality Pin BarsAfter the Pin Bar Formed At The EMA 10 EMA 20, Do The Following Actions
Draw Your Fibonacci Retracement Levels
Draw Horizontal Support Levels
Enter At Pin Bar Close Price
Exit At The Previous Swing Low Level
The attributes that made this a quality Pin Bar:
Pin Bar Close Price is in the Fibonacci Retracement 50% and 38.2% Range Area
Pin Bar Close Price is in the EMA 10 EMA 20 Range Area
Pin Bar at Lower High
Downtrend
Technical Chart Of How To Trade The Pin Bar. Before and After Charts. Click on Charts.

EURCAD Entry Price 1.47792 Target Price 1.46609EURCAD (Pin Bar, EMA 10 EMA 20, Trend Line, 50% Fibonacci Retracement Level, Horizontal Support Resistance Level)
Horizontal Support and Resistance Level 1.47674
Fibonacci 50% Retracement 1.47932

NEOUSD Target Price 60.05NEOUSD Pin Bar EMA 10 EMA 20 Horizontal Support Level and 50% Fibonacci Retracement Level

Rise to 1,1840 and then a drop below 1,1700Here we have very similar situation like the one on GOLD that we looked at yesterday.
Even the levels are pretty much the same.
Right now EURUSD is doing exactly what we said in our analysis from Monday.
We're still expecting a rise up to 1,1840-50. That's the level at which we will be looking for possible reversal and selling opportunities.
Should you buy right now? Well, that depends on what type of trades you're looking for.
There are potential profits when it comes to long positions, but make sure to watch out for price exhaustion and use less risk.
We will let you know once a reversal is happening in our daily analysis.

EURNOK Target Price 10.35900EURNOK
TREND DIRECTION: Down
LEVEL: Support Resistance 10.41230; EMA 10 10.39341; EMA 20 10.39977; Fibonacci Retracement 50% 10.41493
SIGNAL: Pin Bar
DATE and TIME: 16-AUG-2021 16:00

GBPSEK Target Price 11.96054GBPSEK Entry Price 12.00221
Entry after pin bar closes on the H4 Time Frame
Daily Time Frame
H2 Time Frame

How To Trade The Pin Bar With Support Resistance Levels 08-16-21This pin bar is in a pull back. The horizontal level was broken and the horizontal level was retested with a pin bar candlestick. In this case, the pin bar tail intersects the EMA 10 and horizontal support level. Price closed above the horizontal level. Entry for this strategy is at the pin bar close. The Target is the previous swing high.

TRXUSD (TRON) Target Price 0.1120TRXUSD (TRON) closed above 0.0909 and retested 0.0909. Entry at close of pin bar.


ETHUSD Target Price 3324.51ETHUSD Ethereum Entry Price 3236.86 (Pin Bar | EMA 10 | EMA 20 | Support Resistant)

BTCUSD Target Price 48149.54BTCUSD Bitcoin Pin Bar EMA 10 EMA 20 Horizontal Support Level Trend Line Level

USDSGD Target Price 1.36933USDSGD. Waiting For Price To Reach 1.36933.
Weekly Time Chart
Daily Time Frame Chart For Pin Bar On August-4-2021 (Replay Chart)

USDNOK Target Price 8.84255USDNOK Entry Price 8.71538
Pin Bar Date Time and Price (x,y)
(12-Aug-2021 at 16:00, 8.71538)

CHFJPY Target Price 119.019CHFJPY. I have this pair on my watchlist as a sell. If there are better trade opportunities, then I will remove this CHFJPY Trade Idea from my watch list.
