The Beginner's Blueprint to Custom Trading Indicators
Your First AI‑Assisted Indicator Doesn't Need to Be Perfect - It Just Needs to Be Yours
In the AI era, you don't have to be "a coder" to build tools that actually match how you see the market.
You just need:
A clear idea
Basic Pine Script concepts
AI to help with the heavy lifting, while you fine tune/debug it.
This post is about turning that first idea into a real indicator on your chart.
---
Step 1: Start With One Sharp Idea, Not Ten Vague Ones
Instead of:
"I want an indicator that tells me when to buy and sell."
try:
"I want a trend filter that only shows long signals when price is above a 200‑MA and volatility is not extreme."
The sharper your idea, the easier it is for both you and AI to build something useful.
---
Step 2: Break the Idea Into Building Blocks
Most indicators combine a few simple components:
Trend (moving averages, higher highs/lows)
Momentum (RSI, rate of change)
Volatility (ATR, bands)
Volume (OBV, volume filters)
Your job is to decide:
Which components matter for your idea
How they should interact (AND, OR, weights)
Then you can tell AI exactly what to code instead of saying "make me something cool".
---
Step 3: Talk to AI Like a Developer, Not a Customer
When you ask AI for Pine code, be specific:
"Overlay indicator on price chart"
"Inputs for fastMA, slowMA, ATR length, ATR multiplier"
"Plot trend filter as a colored background"
"Create longCondition and shortCondition booleans"
You can even sketch the structure:
indicator("My Trend Filter", overlay = true)
// 1. Inputs
// 2. Calculations
// 3. Conditions
// 4. Plots
AI will happily fill in the gaps.
---
Step 4: Understand Before You Trust
AI can write the code, but you are still responsible for:
Reading each block and asking, "What does this do?"
Checking signals on different timeframes and markets
Confirming the indicator behaves like your original idea
Think of AI as an ultra‑fast junior dev. You’re still the lead.
Pinescript

Still Long for $UPRO, Short Trendline to BreakAMEX:UPRO has been heavily shortened recently but still has had a significant bull run. Right now, both with the MACD and the Multi-Factor Long Bias tool, a setup for continued bullish correlation is supported. As always, none of this is investment or financial advice. Please do your own due diligence and research.

Apple - $265 Target, Shorts Catching Up, Losing the AI WarThe shorts seem to be catching up on the indicators with the bullish trendline breaking in support. Apple is also losing the AI wars, at least figuratively speaking (to some), and at the same time people are uncertain about earnings in 43 days. As always, none of this is investment or financial advice. Please do your own due diligence and research.

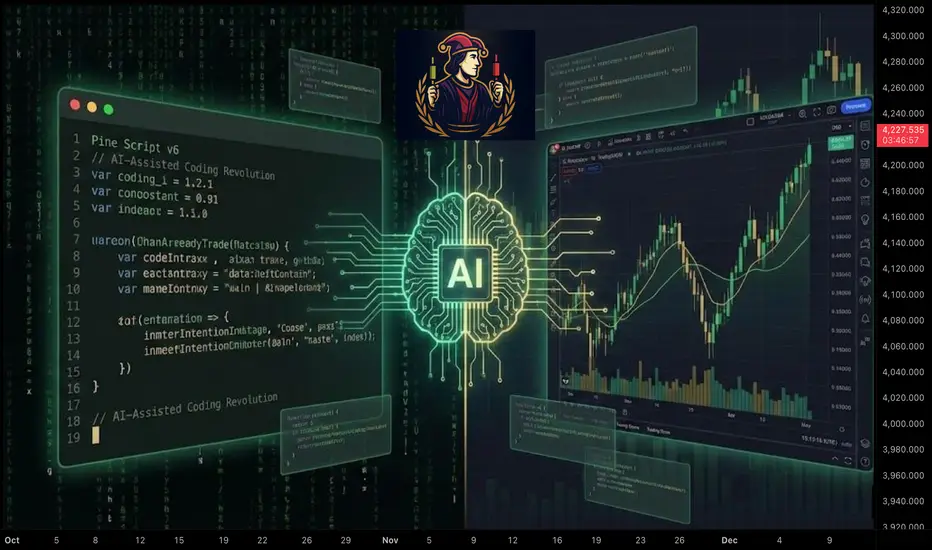
Pine Script v6: The AI-Assisted Coding RevolutionAI Isn't Replacing Pine Script Developers, It's Creating More of Them
For years, if you wanted custom tools on $TRADINGVIEW, you had two options:
Spend months learning to code, or
Settle for whatever public indicators were available
The era of AI assisted Pine Script changes that. You don't have to choose between "coder" and "trader" anymore, you can be both, with AI as your quiet co‑pilot.
Why Pine Script + AI Is a Big Deal
In the new AI trading era, edge comes from:
Being able to test ideas quickly
Turning those ideas into rules
Automating those rules in a language the platform understands
AI can't give you edge by itself. But it can remove almost all of the friction between the idea in your head and a working NYSE:PINE script on your chart.
Instead of:
Googling syntax
Copy‑pasting random snippets
Debugging mysterious errors at 2am
you can describe your logic in plain language and let AI handle the boilerplate, while you stay in control of the trading logic.
The Modern Pine Script Workflow (AI Edition)
Old workflow:
Learn programming basics from scratch
Read documentation line‑by‑line
Write every line of code yourself
Fix every typo and bug manually
New workflow:
Define the strategy in plain English
Ask AI to draft the first version in Pine Script v6
Review and understand what it wrote
Refine, test, and harden it on your charts
The difference isn't "AI does everything" it's AI accelerates everything . You move from "How do I code this?" to "Is this idea actually good?" much faster.
What AI Is Great At in Pine Script
Syntax and Structure - Getting the small details right:
`indicator()` declarations
`strategy()` settings
Inputs, colors, line styles
Common functions like `ta.sma`, `ta.rsi`, `ta.crossover`
Boilerplate Code - The parts that repeat across almost every script:
Input sections
Plotting logic
Alert conditions
Explaining Code Back to You - You can paste a snippet and ask:
"What does this variable do?"
"Why is this `if` statement here?"
"Can you rewrite this more clearly?"
This is how you learn Pine Script by doing , instead of from a dry textbook.
What AI Is NOT Good At (If You Rely on It Blindly)
Designing Your Edge - AI doesn't know your risk tolerance, timeframe, or style. You still have to define the actual trading idea.
Protecting You From Over‑Optimization Ask it to "improve" a strategy and it may add 20 inputs that look perfect on past data and fail live.
Understanding Market Context - It can code the rules, but it doesn't "feel" what a trend, rotation, or macro regime shift means to you.
Use AI as a smart assistant, not an oracle.
Core Pine Script Concepts You Still Need
Even in the AI era, a few fundamentals are non‑negotiable. Think of them as the alphabet you must know, even if AI writes the sentences:
1. Data Types
float // prices, indicator values
int // bar counts, lengths
bool // conditions (true/false)
string // labels, messages
color // styling
2. Series Logic
Every variable in Pine is a time series . You don't just have `close`, you have `close `, `close `, etc.
close // current bar close
close // previous bar close
high // high from 5 bars ago
3. Built‑In Indicator Functions
You don't need to reinvent moving averages and RSI:
ma = ta.sma(close, 20)
rsi = ta.rsi(close, 14)
longCondition = ta.crossover(close, ma)
If you understand what these do, AI can handle how to wire them together.
A Clean AI‑Assisted Workflow to Build Your Next Indicator
Write the idea in plain language
"I want a trend filter that only shows long signals when price is above a 200‑period MA and volatility is not extreme."
Ask AI for a first draft in Pine Script v6
Specify: overlay or separate pane, inputs you want, and what should be plotted.
Read every line
Use AI as a teacher: "Explain this variable", "Explain this block".
Test on multiple markets and timeframes
Does it behave the way you expect on CRYPTOCAP:FOREX , $CRYPTO, and stocks?
Does it break on higher timeframes or very illiquid symbols?
Iterate, don't chase perfection
Tweak one idea at a time.
Avoid adding endless inputs just to fix old trades.
The Bigger Picture: Coders, Traders, and the AI Era
The old split was:
"Coders" who could build things but didn't trade
"Traders" who had ideas but couldn't code them
In the AI era, that wall disappears. The trader who can:
Describe ideas clearly
Use AI to generate Pine code
Understand enough to test and refine
…gets a massive edge over both pure coders and pure discretionary traders.
You don't need to be perfect. You just need to be dangerous, one well‑tested script at a time.
Your Turn
If you could build one custom tool this month with AI's help, what would it be?
An entry signal? A dashboard? A risk overlay?
Drop your idea below and consider this your sign to finally turn it into code.
AI Trading: The Revolution You Can't IgnoreThe Era of AI Trading Has Arrived And It's Only Getting Started
Forget the movie version of AI glowing red eyes flawlessly predicting every tick. The real story is colder, quieter, and way more powerful:
We are moving from a world where humans look at charts to a world where machines digest every tick, every candle, every flow of data… and feed you the edge you couldn't see on your own.
Right now, as you read this, AI is already sitting inside:
Execution algorithms routing institutional orders across venues
Risk engines stress testing portfolios in milliseconds
News and sentiment scanners parsing thousands of headlines a minute
Retail tools that turn a paragraph of English into working NYSE:PINE Script
This isn't science fiction. This is the baseline. And the baseline is rising.
The traders who survive this decade won't be the ones fighting AI. They'll be the ones partnering with it.
So What Exactly Is "AI Trading"?
At its core, AI trading is simply using algorithms that can learn from data to make parts of the trading process smarter.
That can mean anything from a small script that filters charts for you, all the way up to full stack systems managing billions. The spectrum looks like this:
AI Assisted Analysis You still click the buttons, but AI does the heavy lifting.
Pattern recognition on charts (trend, ranges, breakouts)
Scanning hundreds of symbols for your exact conditions
Sentiment analysis on news and earnings headlines
Idea generation: "Show me all large‑cap stocks breaking out with above‑average volume"
AI‑Generated Signals The machine tells you what it would do; you decide whether to listen.
Multi‑indicator models that output clear long/short/flat signals
Quant models that score each asset from 0-100 based on your rules
Bots that push alerts when high‑probability setups appear
Fully Automated Trading The system trades end‑to‑end while you supervise.
Execution from signal → order → risk control with no manual clicks
Self adjusting position sizing and risk controls
Strategies that re‑train on fresh data as regimes shift
Wherever you are on that spectrum, you're already in the AI game. The question isn't "Will I use AI?" it's "How deeply will I let it into my process?"
How AI Actually "Sees" the Market
Humans see a chart. AI sees a dataset.
Human view:
One instrument at a time
A couple of timeframes
A handful of indicators you like
Heavily filtered through emotion and bias
AI view:
Thousands of symbols at once
Dozens of timeframes and derived features
Years of historical data compressed into patterns
Zero fear, zero FOMO, zero boredom
Feed a model clean data and it can uncover:
Regimes you feel but can't quantify (trend, chop, grind, panic)
Relationships between assets that hold statistically
Behavioral patterns like "late‑day reversals after gap‑up opens"
Execution patterns in the order book around key levels
But here's the crazy part: AI is completely unforgiving about your assumptions.
If the data is noisy, biased, or poorly structured, the model will happily learn the wrong thing and apply it with perfect discipline. "Garbage in, garbage out" gets amplified at machine speed.
The Era We're Entering: Human + AI, Not Human vs AI
Over the next decade, expect three shifts to accelerate:
From Intuition First → Data‑First
Traders will still have hunches, but they'll validate them against hard data.
Instead of "this looks extended", you'll ask the system: "How often do moves like this actually continue?" and get an answer in seconds.
From Single‑Indicator Thinking → Multi‑Signal Models
No more worshiping one magic oscillator.
AI will blend technicals, fundamentals, flows, and sentiment into a unified view.
From Static Systems → Adaptive Systems
Instead of one set of parameters forever, models will adapt as volatility, liquidity, and structure change.
Think of it as a trading playbook that rewrites itself when the game changes.
Technologies like larger language models, specialized chips, and eventually quantum‑accelerated optimization won't magically "solve" markets, but they will make it cheaper and faster to test ideas, build systems, and manage risk.
The edge shifts from "Can I code this?" to "Can I ask the right questions, define the right constraints, and manage the risk around what the models tell me?"
Where You Fit In As a Trader
In the era of AI, your job becomes less about staring at every tick, and more about designing the rules of the game your tools play.
You define what "good" trades look like.
You choose which markets, timeframes, and risks matter.
You decide when a model is behaving, and when it's time to shut it off.
AI gives you:
Speed: scanning what you could never cover alone
Consistency: executing the plan without emotional drift
Feedback: showing you what really works in your own data
You bring:
Context: macro, narrative, and common sense
Values: what risks you refuse to take
Adaptability: knowing when to step back or switch regimes
Put together, that's where the edge lives.
Getting Started in the AI Era (Without Getting Overwhelmed)
You don't need a PhD, a server rack, or a lab full of quants. You can start small and intelligent:
Audit Your Current Process
Where are you slow? (Scanning, journaling, testing?)
Where are you emotional? (Entries, exits, sizing?)
Those are prime targets for AI assistance.
Add One AI Tool at a Time
Maybe it's an AI screener.
Maybe it's an NYSE:PINE Script assistant that helps you code and backtest.
Maybe it's a journaling tool that tags your trades automatically.
Learn to Read the Data Behind the Magic
Look at win rate, drawdown, expectancy.
Compare AI filtered setups to your old ones.
Keep what clearly improves your edge; drop the rest.
Respect the Risks
Over‑fitted models that look perfect on the past.
Black‑box systems you can't explain.
Over‑reliance on automation with no kill switch.
Is AI Going to Take Over Trading Completely?
In some corners of the market, AI and automation already dominate . High‑frequency execution, index rebalancing, options market‑making, these domains are machine territory.
But markets are more than math. They are human fear, greed, regulation, politics, liquidity constraints, structural changes and unexpected shocks. That messy mix is exactly where human oversight still matters.
The most realistic future isn't "AI replaces traders" it's AI replaces undisciplined, unstructured traders who bring nothing but guesses to the table.
Traders who can think in systems, understand risk, and collaborate with machines? They don't get replaced. They get leverage.
Your Turn
Where are you right now in this evolution?
Still fully manual, doing everything by hand?
Using a few AI assisted tools but not trusting them yet?
Already running bots and systematic strategies?
What part of AI trading are you most curious or skeptical about?
And the big question: Do you think the future of trading belongs to AI, or to traders who know how to use it?
Drop your thoughts in the comments this era is just beginning.

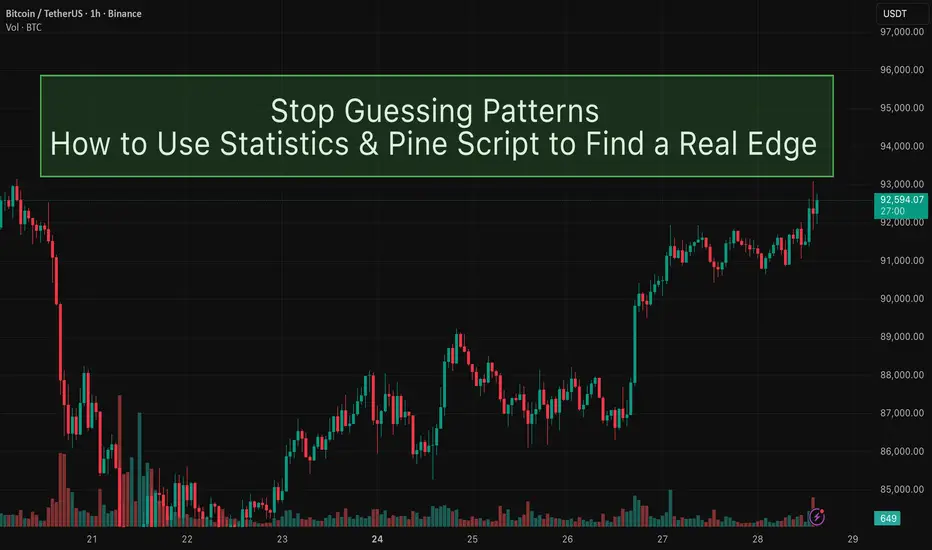
How to use statistics and Pine Script to find a real edge.Are patterns really profitable, or are we just connecting random candles with a story?
Most of us started trading by seeing patterns on the chart: double bottoms, pin bars, three green candles, “smart money” footprints… but do we have any evidence they actually works ?
In this idea, I want to talk about the statistical significance of chart patterns, and how you can use simple statistics + Pine Script to move from “I think this works” to “I measured this edge.”
◼ Patterns are opinions until you define them
“Strong bullish candle”, “nice rejection”, “liquidity grab” – these are subjective words.
Statistics don’t work with feelings, they work with clear rules. Before testing anything, a pattern must be converted into something like:
Candle 1: bullish, body size > X% of price
Candle 2: low does not break previous low
Close of Candle 3 > high of Candle 1
Once you can write your pattern as strict conditions (true/false), you can: Count how many times it appeared, measure what happens after it appears, and decide if it’s worth trading or not. That’s where Pine Script becomes a powerful research tool.
◼ What does “statistical edge” actually mean?
A pattern is interesting if, when you look at many occurrences, you see a consistent tendency. For example, choose a simple question like: “When this pattern appears, where is the price on average after 10 bars?”
If you track that over hundreds or thousands of samples, you’ll get:
How often price is higher vs lower (win rate).
The average move (for example, +0.8% after 10 bars).
How volatile or noisy the results are.
This doesn’t magically make a holy grail, but it tells you: Is this pattern better than random? Is it worth building a full strategy around it? Without this step, you’re basically trading based on screenshots and memories.
◼ Using Pine Script as your statistics magic tool.
Even without going deep into code, the logic in Pine Script is simple, here is a simple example that you can do.
A. Detect the pattern Whenever your conditions are true on a bar, mark that bar as a “pattern bar”.
B. Look forward in time For each pattern bar, check the price after N bars (for example 5, 10, or 20 bars later). Calculate the % change between the pattern close and the future close.
C. Aggregate the results Keep a running count: How many patterns triggered (sample size), How many ended positive (wins), The average % move after N bars.
D. Interpret the numbers If you find that your pattern appeared 800 times, and after 10 bars: 62% of the time price was higher, Average move was +0.6%... then you have something much more concrete than “this looks good on the chart.” You don’t need to turn this into a full strategy immediately. Even a simple statistical study like this already filters out a lot of illusions.
◼ Common mistakes when testing patterns
When you start doing this, it’s easy to fool yourself. A few traps to avoid:
Tiny sample size : If your pattern only occurred 15 times and 11 of them were winners, that 73% win rate is probably not reliable. Statistics start to mean something with large samples (hundreds or thousands of events).
Obsession with win rate : A 70% win rate means nothing if your winners are tiny and your losers are huge. You must look at: Average move, Distribution of outcomes (are there huge negative outliers?), How a realistic stop-loss / take-profit would behave. Sometimes a pattern with 52–55% win rate can be excellent if the average reward is larger than the average risk.
Overfitting the past : If you keep changing rules until the backtest looks perfect, you are no longer discovering a pattern – you’re forcing the past to agree with you. A healthier flow is: Start with a simple, logical idea. Define it clearly in rules. Test it on one market / timeframe. Check it on other symbols and timeframes without changing the rules.
If the edge survives in different environments, that’s much more interesting.
Using this approach will save you a lot of time and money in losses, do your research before taking a trade, make sure you have the statistical evidence if you want to trade a pattern.
i will be sharing more ideas on the use of Pinescript to improve your trading in the next days. make sure you follow me.
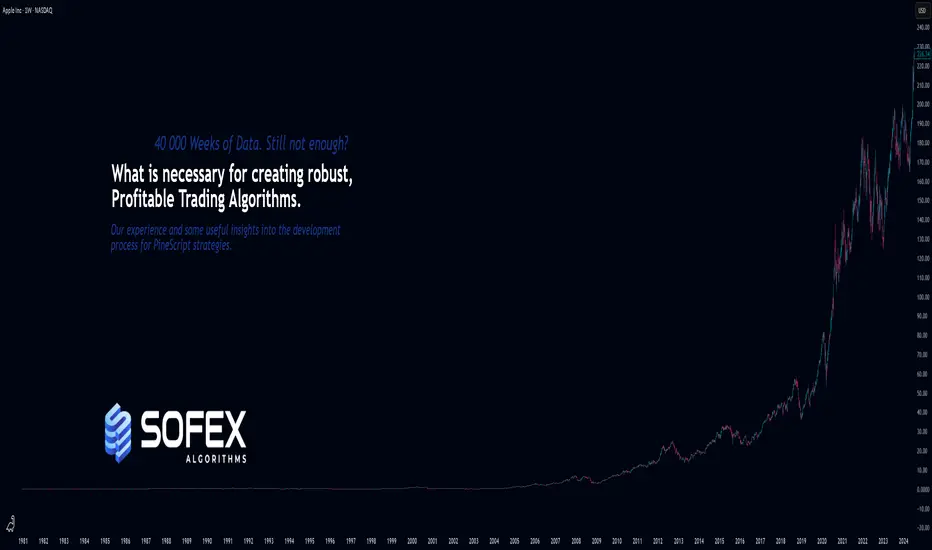
A few important steps for creating robust and winning StrategiesAs the title says, I want to share knowledge & important insights into the best practices for creating robust, trustworthy and profitable trading Strategies here on TradingView.
These bits of information that my team I have gathered throughout the years and have managed to learn through mostly trial and error. Costly errors too .
Many of these points more professional traders know, however, there are some that are quite innovative for all levels of experience in my opinion. Please, feel free to correct me or add more in the comments.
There are a few strategic and tactical changes to our process that made a noticeable difference in the quality of Strategies and Indicators immediately.
Firstly and most importantly, we have all heard about it, but it is having the most data available. A good algorithm, when being built NEEDS to have as many market situations in its training data as possible. Choppy markets, uptrends, downtrends, fakeouts, manipulations - all of these are necessary for the strategy to learn the possible market conditions as much as possible and be prepared for trading on unknown data.
Many may have heard the phrase "History doesn't repeat itself but rhymes well" - you need to have the whole dictionary of price movements to be able to spot when it rhymes and act accordingly.
The TradingView Ultimate plan offers the most data in terms of historical candles and is best suited for creating robust strategies.
___
Secondly, of course, robustness tests. Your algorithm can perform amazingly on training data, but start losing immediately in real time, even if you have trained it on decades of data.
These include Monte-carlo simulations to see best and worst scenarios during the training period. Tests also include the fundamentally important out-of-sample checks . For those who aren’t familiar - this means that you should separate data into training sets and testing sets. You should train your algorithm on some data, then perform a test on unknown to the optimization process data. It's common practice to separate data as 20% training / 20% unknown / 20% training etc. to build a data set that will show how your algorithm performs on unknown to it market movements. Out of sample tests are crucial and you can never trust a strategy that has not been through them.
Walk-forward simulations are similar - you train your algorithm on X amount of data and simulate real-time price feeds and monitor how it performs. You can use the Replay function of TradingView to do walk-forward tests!
When you are doing robustness tests, we have found that a stable strategy performs around 90% similarly in terms of win rate and Sortino ratio compared to training data. The higher the correlation between training performance and out of sample performance, the more risk you can allocate to this algorithm.
___
Now lets move onto some more niche details. Markets don’t behave the same when they are trending downward and when they are trending upwards. We have found that separating parameters for optimization into two - for long and for short - independent of each other, has greatly improved performance and also stability.
Logically it is obvious when you look at market movements. In our case, with cryptocurrencies, there is a clear difference between the duration and intensity of “dumps” and “pumps”. This is normal, since the psychology of traders is different during bearish and bullish periods. Yes, introducing double the amount of parameters into an algorithm, once for long, once for short, can carry the risk of overfitting since the better the optimizer (manual or not), the better the values will be adjusted to fit training data. But if you apply the robustness tests mentioned above, you will find that performance is greatly increased by simply splitting trade logic between long and short. Same goes for indicators.
Some indicators are great for uptrends but not for downtrends. Why have conditions for short positions that include indicators that are great for longs but suck at shorting, when you can use ones that perform better in the given context?
___
Moving on - while overfitting is the main worry when making an algorithm, underoptimization as a result of fear of overfitting is a big threat too . You need to find the right balance by using robustness tests. In the beginning, we had limited access to software to test our strategies out of sample and we found out that we were underoptimizing because we were scared of overfitting, while in reality we were just holding back the performance out of fear. Whats worse is we attributed the losses in live trading to what we thought was overfitting, while in reality we were handicapping the algorithm out of fear.
___
Finally, and this relates to trading in general too, we put in place very strict rules and guidelines on what indicators to use in combination with others and what their parameter range is. We went right to theory and capped the values for each indicator to be within the predefined limits.
A simple example is MACD . Your optimizer might make a condition that includes MACD with a fast length of 200, slow length of 160 and signal length of 100. This may look amazing on backtesting and may work for a bit on live testing, but these values are FUNDAMENTALLY wrong (Investopedia, MACD). You must know what each indicator does and how it calculates its values. Having a fast length bigger than the slow one is completely backwards, but the results may show otherwise.
When you optimize any strategy, manually or with the help of a software, be mindful of the theory. Mathematical formulas don’t care about the indicator’s logic, only about the best combination of numbers to reach the goal you are optimizing for - be it % Return, Profit Factor or other.
Parabolic SAR is another one - you can optimize values like 0.267; 0.001; 0.7899 or the sort and have great performance on backtesting. This, however, is completely wrong when you look into the indicator and it’s default values (Investopedia, Parabolic SAR).
To prevent overfitting and ensure a stable profitability over time, make sure that all parameters are within their theoretical limits and constraints, ideally very close to their default values.
Thank you for reading this long essay and I hope that at least some of our experience will help you in the future. We have suffered greatly due to things like not following trading theory and leaving it all up to pure mathematical optimization, which is ignorant of the principles of the indicators. The separation between Long / Short logic was also an amazing instant improvement.
View the linked idea where we explain the psychology of risk management and suggest a few great ways to calculate and manage your risk when trading - just as important as the strategy itself!
What do you think? Do you use any of these methods; Or better ones?
Let us know in the comments.
How Many Indicators Are Too Many?
I have been trading for around 5 years and in that time, I lost money and hope more often than I can count. A common coping strategy I use when in a time of loss is to strip all the "completely useless" indicators from my charts. And 6 months later, I have more than I had before.
Recently, I have actually started to earn small amounts of money from the markets consistently but my indicator problem persists. The picture above is an example of just some of the indicators I use. So now I ask the question,
-How many indicators are too many?
There really is not an answer despite what those on reddit might tell you. I seem to always have this fantasy that I will find the perfect chart set-up with all my indicators telling me just what I want to know. And of course TradingView has Pinscript which only makes my habit worse by allowing me to create exactly what I want.
As I was thinking about chart layouts this morning I came to a conclusion that my trading will always be evolving and the way in which I view the visual output of markets will change as well. There will most likely never be a chart set-up that I will use for the next 20 years. Even when I find my edge, the process of trading will still evolve. My "edge" will never be an indicator or a set of indicators .
So I wrote this to try and help those that are experiencing the same dilemma. Just know that you are not alone in your obsession with finding that perfect layout. Add 100 indicators to your chart and then delete them all when you feel they don't belong. You will never find that perfect indicator but but neither will you stop looking. It may seems like it is all a waste of time but I assure you that everything you experience in trading is worth it and progress does happen .
Safe Trading, Frank
Debugging Pine Script with log.info()log.info() is one of the most powerful tools in Pine Script that no one knows about. Whenever you code, you want to be able to debug, or find out why something isn’t working. The log.info() command will help you do that. Without it, creating more complex Pine Scripts becomes exponentially more difficult.
The first thing to note is that log.info() only displays strings. So, if you have a variable that is not a string, you must turn it into a string in order for log.info() to work. The way you do that is with the str.tostring() command. And remember, it's all lower case! You can throw in any numeric value (float, int, timestamp) into str.string() and it should work.
Next, in order to make your output intelligible, you may want to identify whatever value you are logging. For example, if an RSI value is 50, you don’t want a bunch of lines that just say “50”. You may want it to say “RSI = 50”.
To do that, you’ll have to use the concatenation operator. For example, if you have a variable called “rsi”, and its value is 50, then you would use the “+” concatenation symbol.
EXAMPLE 1
━━━━━━━━━━━━━━━━━━━━━━━━━━━━━━━━━
//@version=6
indicator("log.info()")
rsi = ta.rsi(close,14)
log.info(“RSI= ” + str.tostring(rsi))
Example Output =>
RSI= 50
Here, we use double quotes to create a string that contains the name of the variable, in this case “RSI = “, then we concatenate it with a stringified version of the variable, rsi.
Now that you know how to write a log, where do you view them? There isn’t a lot of documentation on it, and the link is not conveniently located.
Open up the “Pine Editor” tab at the bottom of any chart view, and you’ll see a “3 dot” button at the top right of the pane. Click that, and right above the “Help” menu item you’ll see “Pine logs”. Clicking that will open that to open a pane on the right of your browser - replacing whatever was in the right pane area before. This is where your log output will show up.
But, because you’re dealing with time series data, using the log.info() command without some type of condition will give you a fast moving stream of numbers that will be difficult to interpret. So, you may only want the output to show up once per bar, or only under specific conditions.
To have the output show up only after all computations have completed, you’ll need to use the barState.islast command. Remember, barState is camelCase, but islast is not!
EXAMPLE 2
━━━━━━━━━━━━━━━━━━━━━━━━━━━━━━━━━
//@version=6
indicator("log.info()")
rsi = ta.rsi(close,14)
if barState.islast
log.info("RSI=" + str.tostring(rsi))
plot(rsi)
However, this can be less than ideal, because you may want the value of the rsi variable on a particular bar, at a particular time, or under a specific chart condition. Let’s hit these one at a time.
In each of these cases, the built-in bar_index variable will come in handy. When debugging, I typically like to assign a variable “bix” to represent bar_index, and include it in the output.
So, if I want to see the rsi value when RSI crosses above 0.5, then I would have something like:
EXAMPLE 3
━━━━━━━━━━━━━━━━━━━━━━━━━━━━━━━━━
//@version=6
indicator("log.info()")
rsi = ta.rsi(close,14)
bix = bar_index
rsiCrossedOver = ta.crossover(rsi,0.5)
if rsiCrossedOver
log.info("bix=" + str.tostring(bix) + " - RSI=" + str.tostring(rsi))
plot(rsi)
Example Output =>
bix=19964 - RSI=51.8449459867
bix=19972 - RSI=50.0975830828
bix=19983 - RSI=53.3529808079
bix=19985 - RSI=53.1595745146
bix=19999 - RSI=66.6466337654
bix=20001 - RSI=52.2191767466
Here, we see that the output only appears when the condition is met.
A useful thing to know is that if you want to limit the number of decimal places, then you would use the command str.tostring(rsi,”#.##”), which tells the interpreter that the format of the number should only be 2 decimal places. Or you could round the rsi variable with a command like rsi2 = math.round(rsi*100)/100 . In either case you’re output would look like:
bix=19964 - RSI=51.84
bix=19972 - RSI=50.1
bix=19983 - RSI=53.35
bix=19985 - RSI=53.16
bix=19999 - RSI=66.65
bix=20001 - RSI=52.22
This would decrease the amount of memory that’s being used to display your variable’s values, which can become a limitation for the log.info() command. It only allows 4096 characters per line, so when you get to trying to output arrays (which is another cool feature), you’ll have to keep that in mind.
Another thing to note is that log output is always preceded by a timestamp, but for the sake of brevity, I’m not including those in the output examples.
If you wanted to only output a value after the chart was fully loaded, that’s when barState.islast command comes in. Under this condition, only one line of output is created per tick update — AFTER the chart has finished loading. For example, if you only want to see what the the current bar_index and rsi values are, without filling up your log window with everything that happens before, then you could use the following code:
EXAMPLE 4
━━━━━━━━━━━━━━━━━━━━━━━━━━━━━━━━━
//@version=6
indicator("log.info()")
rsi = ta.rsi(close,14)
bix = bar_index
if barstate.islast
log.info("bix=" + str.tostring(bix) + " - RSI=" + str.tostring(rsi))
Example Output =>
bix=20203 - RSI=53.1103309071
This value would keep updating after every new bar tick.
The log.info() command is a huge help in creating new scripts, however, it does have its limitations. As mentioned earlier, only 4096 characters are allowed per line. So, although you can use log.info() to output arrays, you have to be aware of how many characters that array will use.
The following code DOES NOT WORK! And, the only way you can find out why will be the red exclamation point next to the name of the indicator. That, and nothing will show up on the chart, or in the logs.
// CODE DOESN’T WORK
//@version=6
indicator("MW - log.info()")
var array rsi_arr = array.new()
rsi = ta.rsi(close,14)
bix = bar_index
rsiCrossedOver = ta.crossover(rsi,50)
if rsiCrossedOver
array.push(rsi_arr, rsi)
if barstate.islast
log.info("rsi_arr:" + str.tostring(rsi_arr))
log.info("bix=" + str.tostring(bix) + " - RSI=" + str.tostring(rsi))
plot(rsi)
// No code errors, but will not compile because too much is being written to the logs.
However, after putting some time restrictions in with the i_startTime and i_endTime user input variables, and creating a dateFilter variable to use in the conditions, I can limit the size of the final array. So, the following code does work.
EXAMPLE 5
━━━━━━━━━━━━━━━━━━━━━━━━━━━━━━━━━
// CODE DOES WORK
//@version=6
indicator("MW - log.info()")
i_startTime = input.time(title="Start", defval=timestamp("01 Jan 2025 13:30 +0000"))
i_endTime = input.time(title="End", defval=timestamp("1 Jan 2099 19:30 +0000"))
var array rsi_arr = array.new()
dateFilter = time >= i_startTime and time <= i_endTime
rsi = ta.rsi(close,14)
bix = bar_index
rsiCrossedOver = ta.crossover(rsi,50) and dateFilter // <== The dateFilter condition keeps the array from getting too big
if rsiCrossedOver
array.push(rsi_arr, rsi)
if barstate.islast
log.info("rsi_arr:" + str.tostring(rsi_arr))
log.info("bix=" + str.tostring(bix) + " - RSI=" + str.tostring(rsi))
plot(rsi)
Example Output =>
rsi_arr:
bix=20210 - RSI=56.9030578034
Of course, if you restrict the decimal places by using the rounding the rsi value with something like rsiRounded = math.round(rsi * 100) / 100 , then you can further reduce the size of your array. In this case the output may look something like:
Example Output =>
rsi_arr:
bix=20210 - RSI=55.6947486019
This will give your code a little breathing room.
In a nutshell, I was coding for over a year trying to debug by pushing output to labels, tables, and using libraries that cluttered up my code. Once I was able to debug with log.info() it was a game changer. I was able to start building much more advanced scripts. Hopefully, this will help you on your journey as well.

Intro to my python-tradingview strategyAfter three years working on multiple trading strategies, I decided to share my experience and my trades. But before going live, I think I need to explain the roadmap I’ve followed so far.
I initially started coding my strategy in PineScript, which is a powerful tool. It allowed me to simply code my ideas and turn them into trading signals using alerts and conditions. I’m sure you’ve already watched dozens of YouTube videos on how to use webhooks and TradingView to send signals to your trading platform. Anyway, I began developing my strategy in Pine and used webhooks to connect to Tradovate. I went live after a few months of testing—which, of course, was my first mistake. In January 2022, my algo went live. I traded on a strategy that was just tuned on seen data, manually flipping parameters to maximize PnL—a purely overfit model—and I went live with real money. Anyway, the first month was positive and I thought I was the best trader in the world. I even told my wife we were going to be rich, like nothing could stop us. But after three months of trading, I lost—obviously. It was a bummer, but I knew where the problem was: lack of proper backtesting.
So that was the moment I moved my code to Python. It took me a couple of weeks to build an end-to-end backtesting framework in Python. I used Backtrader as a backtesting tool, which is awesome. I’ll have some videos soon to explain more about that. Anyway, moving my code to Python gave me the luxury of backtesting and creating rolling walk-forward optimizations, allowing me not only to refine my strategies but also to test them on 5–6 years of historical data.
Long story short, working with Python enabled me to come up with five different strategies for NQ and ES. I plan to share those trades, but before that, I thought I should share my journey first.
Please leave comments and follow my channel. More to come.

Transform Your Trading with WiseOwl - Free Edition! Take a look at Hedera's chart—and YES, this was spotted with WiseOwl Free Edition ! 🎯
🔍 What makes it powerful?
🔥 **Entry signals** that help time the market for you
🟢 **Bullish/Bearish backgrounds** for instant clarity
📊 **EMAs** to analyze trends like a pro
👉 Check out the WiseOwl Free Edition now and start spotting opportunities like this!

Algorithmic vs. Quantitative Trading: Which Path Should You TakeI’ve always wondered why anyone would stick to traditional trading methods when algorithms and mathematical models could do all the heavy lifting.
I started questioning everything:
• Why do so many mentors still swear by discretionary trading when algorithms could handle all the heavy lifting?
• Do they really have solid proof of their “own” success, or is it just talk?
• Or are they keeping things complex and discretionary on purpose, to confuse people and keep them as members longer?
• Why deal with the stress of emotions and decisions when an algorithm can take care of it all?
• Imagine how much further ahead you could be if you stopped wasting time on manual trades and instead focused on market research and developing your own models.
When I first got into trading, I thought Algorithmic Trading and Quantitative Trading were basically the same thing. But as I dug deeper, I realized they’re two completely different worlds.
Algorithmic Trading: It’s simple – you set the rules and the algorithm executes the trades. No more sitting in front of the screen “controlling your emotions” and trying to manage every little detail. Instead, you let the algorithm handle it, based on the rules you’ve set. It frees up your time to focus on other things rather than staring at price charts all day.
But here’s the thing – it’s not perfect. You’ll still need to test the rules to make sure the data and results you’re getting aren’t overfitted or just random.
Quantitative Trading: A whole different level. It’s not just about executing trades; it’s about understanding the data and math behind market movements. You analyze historical price, economic, and political data, using math and machine learning to predict the future. But it can be complex – techniques like Deep Learning can turn it into a serious challenge.
The upside? This is the most reliable way to trade, and it’s exactly what over 80% of hedge funds do. They rely on quant models to minimize risk and to outperform the market.
So, which path should you choose?
Quantitative Trading can feel overwhelming at first, I recommend starting with the basics. Begin with Pine Script coding in TradingView—start building a foundation with simple strategies and indicators. As you grow more confident, start coding your own ideas into rules and refining your approach to eventually automated your trading strategy.
TradingView is a great tool for this, and I’d highly suggest grabbing the Premium plan. This will give you access to more data and features to make your learning journey smoother.
Dive into the Pine Script documentation , and begin bringing your ideas to life.
I promise, the more you focus on this, the better and more independent you’ll become in trading.
Every day, aim to get just 1% better.
To Your success,
Moein

Big Runner - Running'Big Runner' - This pine script strategy is available in my scripts section and is fully open source, here it is performing algorithmic trades on SPX 4hour timeframe.
This strategy works seamlessly with any instrument, showing visuals on the chart for moving averages and ribbons to execute Long and Short trades.
I'm working to update it's script to further improve its use case.

Use modern tools to automate your trading.My partner @Mayfair_Ventures and I like innovation, but we have been sceptical of bot-driven trading. This if for one simple reason. If it was available and consistently profitable, then someone would be doing it, then others would find out, then everyone would be doing it. No one would need a job.
If you know about chaos theory, then you'll recognise trading as one example of where it fits. Chaotic things are inherently extremely hard to predict, as a rule. The best we can do is predict small amounts, like what the weather may do this afternoon. What it's going to do in 5 days' time is exponentially harder.
Let's stick to the "we can predict this afternoon" model. At this level I think bots can be useful, and recently we've been looking at short-term trading on the 1 minute time-frame (Even though we don't recommend it) because people always ask us about it.
There are a couple of streams here..
www.tradingview.com
www.tradingview.com
Now to automation. We started to mess around with @TradingView indicators and web hooks first. Web hooks allow you to propagate alerts from TradingView to an outside platform, like your phone, or email, whatever. Best of all, you can do it from your custom indicators as well.
Then we thought: "how about just letting our indicator do the trade, so we can carry on with our round of golf"? As long as the timing is right, in other words, if we were at the screen we would take the trade, this makes sense. We can make our indicator only send signals at certain times of day, or whatever other thing we can think of.
There are a few programs that will do this. I had a look at one from 3Commas. Others exist but I haven't looked at them yet. It takes the signal just like your phone does.
You need to add your exchange (I use Binance) to it.
I write 2 bots using simple templates they supply. One to go long, one to exit the long. You don't need an stop loss because it knows your max risk and does it for you.
I set alerts based on my indicator (yes you have to get ChatGPT to make an indicator for you or write one!), not a price, so when my indicator is hit, the alerts fire and whichever bot is connected to the alert bot does a trade.
That's it. I am playing about with it on a demo account first, because I am not an idiot.
Yes it's true, ChatGPT can write Pinescript. It gets it wrong sometimes, but just tell it and it tries to fix it.

Thinking in Pine - Functions Containing Var VariablesHello everyone, welcome back to "Thinking in Pine" short video tutorials. In this video, we have discussed special cases of using var variables inside function definitions.
If you are not familiar with var variables, please take a step back and watch our earlier video - "Thinking in Pine - var, varip and regular variables"
🎲 Summary
Using var within a function scope and how it behaves with multiple invocations.
Using the functions containing var variable definitions within a loop.
🎯 Example Program Used
increment()=>
var i = 0
i+=1
var1 = increment()
var2 = increment()
var3 = increment()
// The code above is equivalent to
// var i1 = 0
// i1+=1
// var1 = i1
// var i2 = 0
// i2+=1
// var2 = i2
// var i3 = 0
// i3+=1
// var3 = i3
plot(var1, "Counter 1", color=color.blue)
plot(var2, "Counter 2", color=color.red)
plot(var3, "Counter 3", color=color.purple)
arr = array.from(var1, var2, var3)
for i=1 to 3
arr.push(increment())
// The code above is equivalent to
// var i4 = 0
// i4+=1
// arr.push(i4)
if(bar_index == 4)
log.info('Value of array containing incremental values : {0}', arr)
🎲 References
Pine Script® User Manual - Variable declarations
Pine Script® Reference Manual - var

Thinking in Pine - Time Series Special CasesHello Everyone,
Welcome back to "Thinking in Pine" short video series. In this session, we have discussed few special cases of time series variables and using historical operator within local scope.
If you have not watched our previous video - "Thinking in Pine - Time Series" , request you to do that before continuing this video.
🎲 Summary of our today's discussion
How historical operator works for variables defined inside an conditional block
How historical operator works for variables defined in a loop.
🎯 Example Program Used
// Time series for variables within a condition
varip showLogInLoop = true
if(bar_index%3 == 0)
specialBarIndex = bar_index
if(bar_index > last_bar_index-3 and showLogInLoop)
log.info('Current and Previous special bar index are : {0} and {1}', specialBarIndex, specialBarIndex )
showLogInLoop := false
// Time series of variables within a loop
arrayOfX = array.new()
arrayOfLastX = array.new()
for i = 1 to 5
x = i*10
arrayOfX.push(x)
arrayOfLastX.push(x )
if(barstate.islastconfirmedhistory)
log.info('Array of X : {0}', arrayOfX)
log.info('Array of last X : {0}', arrayOfLastX)
🎲 References:
Pine Script® User Manual - Execution Model
Pine Script® User Manual - Time Series
Pine Script® User Manual - History Referencing Operator
Pine Script® Reference Manual - History Referencing Operator

Thinking in Pine - Time SeriesHello everyone,
Welcome back to "Thinking in Pine" short video series. In this video, we discuss the concept of time series variables in Pinescript.
If you are not familiar with var and varip type of variables - please step back and watch this video before continuing - "Thinking in Pine - var, varip and regular variables"
🎲 Summary of our discussion is as follows
What are time series variables, and how are they used in Pinescript?
How do we access historical values of time series?
Limitations of accessing historical values
🎯 Example Program Used
currentBar = bar_index
var currentBarUsingVar = 0
currentBarUsingVar := bar_index
varip showLog = true
valueAt200thBar = ta.valuewhen(bar_index == 500, currentBar, 0)
if(barstate.islast and showLog)
log.info("Current Bar Values using regular and var variables : {0}, {1}", currentBar, currentBarUsingVar)
log.info("Last Bar Values using regular and var variables : {0}, {1}", currentBar , currentBarUsingVar )
log.info("Values 500 bars ago using regular and var variables : {0}, {1}", currentBar , currentBarUsingVar )
offset = bar_index-25000
log.info("Values at 25000th bar using regular and var variables : {0}, {1}", currentBar , currentBarUsingVar )
showLog := false
plot(bar_index, "Bar Index", color = color.blue, display = display.data_window)
There are pitfalls of using historical operators within loop or under if condition. We will discuss that in our next video.
🎲 References:
Pine Script® User Manual - Execution Model
Pine Script® User Manual - Time Series
Pine Script® User Manual - History Referencing Operator
]Pine Script® Reference Manual - History Referencing Operator

Thinking in Pine - var, varip and regular variablesThis is our first video session on "Thinking in Pine" series. Before we start, we want to explain a bit about our new initiative.
🎲 What is "Thinking in Pine"?
In our journey to empower the trading community, we're excited to introduce "Thinking in Pine," a series of concise, 5-10 minute videos dedicated to unraveling the complexities of Pine Script®. We have our own list of topics to be covered, and we will start releasing the videos one by one. However, if you're grappling with any aspect of Pine Script® or stuck on an implementation, we encourage you to reach out to us or drop a comment here. We aim to address your queries by breaking down challenging concepts or implementations into easily digestible content.
What kind of videos are covered in "Thinking in Pine"?
Pine Script® Focus: We try to keep our focus on Pine Script® concepts and implementations.
General Utility: We prioritize topics that offer broader learning value. Though it's challenging to quantify this, we'll use our judgment to select topics that benefit the wider audience.
Time-Efficient Demonstrations: Ideally, we want to keep our demonstrations to 5–10 mins of time.
We're here to demystify Pine Script®, one topic at a time, making it accessible for everyone from beginners to advanced users. Stay tuned for insightful sessions with "Thinking in Pine"!
🎲 Demonstrating var, varip and regular variables in Pine Script®
In this video, we have demonstrated the difference between var, varip and regular variables by using an example implementation of OBV indicator.
🎯 Logic of OBV Calculation
Start with the value 0
On each bar, add volume to the indicator if close price is higher than previous bar close price.
On each bar, remove volume from the indicator is close price is lesser than previous bar close price
🎯 Highlights
Regular variables are initialized separately on each bar and does not propagate value to next bar unless coded to do it.
var variables are initialized once and then can be reassigned any number of times using := operator . The variables declared as var will propagate the current values to the next bar.
varip variables are initialized once and then can be reassigned any number of times using := operator . varip will behave similar to var on historical bars. However, on real time bars, they are recalculated on every tick, and they remember the state of each tick.
🎯 Example Program Used
Here is the example program used in the demonstration.
//Plot built-in OBV value for reference
plot(ta.obv, "OBV Built In", color=color.yellow)
//Volume multiplied by +-1 based on change in close price compared to previous bar.
volumeBySign = math.sign(nz(ta.change(close), 0))*volume
//Obv calculation by using regular variable. Code need to access and add last bar value using obvByRegular
obvByRegular = 0.0
obvByRegular += nz(obvByRegular , 0) + volumeBySign
plot(obvByRegular, "OBV By Regular Variable", color=color.blue)
//Obv calculation using var variable. Since var variables propagate values to next bar,
// we do not need to use historical operator to get the last bar value
var obvByVar = 0.0
obvByVar += volumeBySign
plot(obvByVar, "OBV by var Variable", color = color.maroon)
//Obv implementation using varip. The OBV is calculated based on every tick. Histoical values will match the same as that of other implementation.
//However, in real time, the calculations are done based on the tick values
varip obvByVarip = 0.0
varip lastPrice = close
varip lastVolume = volume
if(barstate.isnew)
lastVolume := 0
obvByVarip += math.sign(close-lastPrice)*(volume-lastVolume)
lastPrice := close
lastVolume := volume
plot(obvByVarip, "OBV by varip Variable", color = color.purple)
🎲 References:
Pine Script® User Manual - Variable declarations
Pine Script® Reference Manual - var
Pine Script® Reference Manual - varip
Pine Script® User Manual - Operators

3 Must-haves for Top TradersStats published by exchanges clearly show that 80% of traders lose money. So the inquiry is not “how to get into the top 20%?” Who wants to settle for mere profitability? The inquiry becomes “how do I get into the upper 3% of traders?” - The “fly around in private jets” and “build whole schools in Africa” traders?
The answer is simple. Stop being human. It’s our human emotions that trip us up every time. We close winning trades too early (take the money and run) and hang onto losing trades too long (pray for a miracle).
Top traders (the ones with private jets) have one thing in common. They all know how to code. And they automate their trading to take the human element out of it. So here’s your quick list of must-haves skills and tools to invest in. Your best investments to get you into the upper 3%. The journey from staring at your computer doing live Technical Analysis to sitting on the beach while your bot trades for you.
Get Tradingview Premium. If you’re serious about making money, you need the ability to back-test. The deep-backtester that comes with a premium level account is going to give you the accurate results you need. Trading code that hasn’t been properly back-tested and optimized is a game of russian roulette. The money you make from trading well tested strategies will pay for this investment ten-fold. Which brings me to my third and final point, optimization.
Master Pine Script. Shout-out here to Matt Slabosz who developed Pine Script Mastery - an excellent overview course for beginners. Matt is not only a solid trader and exceptional coder, his true brilliance is being able to explain complex coding concepts in simple terms. Given that the last time I’d coded was punching fortran cards in University, taking his course was a pleasant surprise in how easy and addictive learning to code Pine Script can be.
Optimize your strategy. There are solid strategies published on tradingview that look unprofitable at first glance. That’s simply a matter of knowing the correct settings for the derivative and market conditions you’re trading. So you have two choices.
Sit at your computer all night and run scenarios on the deep back-tester, or
Buy an optimization tool that will run scenarios while you sleep.
Being way past the age where I’m willing to give up my sleep, the answer, for me, is a no-brainer. TradingTools.software is my top pick for optimizing your TradingView strategy. It allows you to pinpoint the weak areas of your strategy down to the window of where the biggest losses are occuring. This information is pure gold to creating strategies to filter against market conditions where your automated strategy would otherwise fail.
Learning the skills and buying the tools you need is critical to mastering any profession. Trading is no different.

Manage Input variables with Pine Script v5Welcome to this new tutorial that helps traders and investors better understand the powerful Pine Script programming language v5.
In this tutorial, we will program together three Input variables:
Color type Input: a color input is a parameter that allows specifying a custom color for the indicator or script. It can be used to set the color of lines, areas, texts, or other graphical components in the indicator.
Float type Input: a float input is a parameter that allows specifying a floating-point numerical value for the indicator or script. It can be used to set parameters such as threshold levels, indicator sizes, or any other numerical value that requires decimal precision.
Integer type Input: an integer input is a parameter that allows specifying an integer numerical value for the indicator or script. It can be used to set parameters such as moving average periods, length of a time interval, or any other integer numerical value.
IMPORTANT: The code used in this tutorial has been created purely for educational purposes.
Our indicator is a simple indicator that plots the close data of the underlying asset on the chart in a weighted manner. The displayed data is the sum of the close price plus 20%. The goal of the indicator is to provide a fully dynamic tool that can vary its parameters from the user interface and update automatically.
Here is the complete code for this tutorial:
//@version=5
indicator("Input Tutorial", overlay = false)
pond = input.float(defval = 0.20, title = "Float", minval = 0.10, maxval = 1, step = 0.10)
color_indicator = input.color(defval = color.red, title = "Color")
data = close + (close * pond)
linewidth_feature = input.int(defval = 1, title = "Integer", minval = 1, maxval = 10, step = 1)
plot(close, color = color_indicator, linewidth = linewidth_feature)
//@version=5
Indicates the version of the Pine Script language used in the code.
indicator("Input Tutorial", overlay = false)
Set the name of the indicator as "Input Tutorial", and overlay=false indicates that the indicator should not overlap the main chart.
pond = input.float(defval = 0.20, title = "Float", minval = 0.10, maxval = 1, step = 0.10)
Create a float input called "pond" with a default value of 0.20. The input title is "Float", and the minimum value is 0.10, the maximum value is 1, and the step is 0.10.
color_indicator = input.color(defval = color.red, title = "Color")
Create a color input called "color_indicator" with a default value of red color. The input title is "Color".
data = close + (close * pond)
Calculate a new value "data" by adding the closing price value with the closing price multiplied by the "pond" input.
linewidth_feature = input.int(defval = 1, title = "Integer", minval = 1, maxval = 10, step = 1)
Create an integer input called "linewidth_feature" with a default value of 1. The input title is "Integer", and the minimum value is 1, the maximum value is 10, and the step is 1.
plot(close, color = color_indicator, linewidth = linewidth_feature)
Plot the chart of the closing value with the color specified by the "color_indicator" input and the line width specified by the "linewidth_feature" input.

Next Steps: Introduction to Pine ScriptWelcome back, traders! In our previous video, we took our first steps into Pine Script™ and learned about creating indicators. Today, we're going to dive deeper into the Pine Script™ landscape and provide some valuable pointers to guide you on your journey of mastering Pine Script™. So let's get started!
The first important distinction we need to make is between "indicators" and "strategies" in Pine Script™. Indicators are primarily used for calculations and displaying information on charts. They are lightweight and don't require the broker emulator, making them faster to execute. You can use indicators to analyze market data and generate visual representations of technical analysis tools, such as moving averages, oscillators, and custom calculations. Indicators are a great choice when you don't need to backtest your strategies.
On the other hand, strategies are used for backtesting and forward testing. They include trade order functionality and can simulate trade executions. With strategies, you can define entry and exit conditions, apply risk management rules, and evaluate the performance of your trading ideas. Strategies provide detailed backtest results in the "Strategy Tester" tab, located next to the "Pine Script™ Editor" tab. They allow you to assess the historical performance of your trading strategy before deploying it in live markets.
Now, let's talk about how scripts are executed in Pine Script™. Unlike traditional programming languages, Pine Script™ runs in a loop-like fashion, executing once on each bar of the chart from left to right. Historical bars refer to those that have already closed when the script executes on them, while the last bar, known as the realtime bar, remains open. The script then executes whenever a price or volume change is detected and once again when the realtime bar closes. This execution model enables real-time monitoring of market conditions and the opportunity to react to price and volume movements.
It's important to note that the script doesn't recalculate on historical bars during realtime execution. This optimization improves efficiency by avoiding unnecessary calculations on past data that have already been processed. Pine Script™ provides this performance enhancement by storing the calculated values of historical bars, allowing the script to focus on updating the current and future bars efficiently.
In Pine Script™, a fundamental concept is the time series. Time series are data structures that hold values for each bar the script executes on. They continuously expand as the script progresses through more bars. By using the history-referencing operator, which is denoted by square brackets , you can access past values of a time series. For example, close refers to the close value on the preceding bar, close refers to the close value two bars ago, and so on. This powerful feature allows you to incorporate historical data into your calculations and create complex trading algorithms.
It's crucial to understand the time series and how they differ from traditional arrays. While the indexing mechanism may resemble arrays, thinking in terms of arrays can be detrimental to understanding this key Pine Script™ concept. Time series in Pine Script™ expand dynamically with each bar, and their values are automatically updated as new data becomes available. This dynamic nature enables you to create adaptive and responsive trading strategies that take into account changing market conditions.
Moving on, let's discuss script publishing. TradingView is a vibrant community of Pine Script™ programmers and traders from around the world. Once you become proficient in Pine Script™, you have the option to share your scripts with others. Before publishing, ensure your scripts are original and well-documented. All publicly published scripts undergo analysis by TradingView's moderators and must comply with Script Publishing Rules. These rules maintain the quality and integrity of the scripts available on the platform.
If you prefer to use your Pine scripts for personal use, you can simply write them in the Pine Script™ Editor and add them to your charts without publishing them. However, if you want to share your scripts with a select group of individuals, you can publish them privately and provide your friends with the browser link to your private publication. This way, you can collaborate with others and receive valuable feedback on your scripts.
To navigate the Pine Script™ documentation effectively, it's essential to spend time exploring the available resources. Our main documentation sources are the Pine Script™ v5 User Manual and the Pine Script™ v5 Reference Manual. The User Manual provides comprehensive explanations and examples to help you grasp the fundamentals of Pine Script™. The Reference Manual serves as a detailed reference guide, documenting the functions, variables, and keywords available in Pine Script™. It's a valuable tool for every Pine Script™ programmer and is essential for writing scripts of reasonable complexity.
Remember to consult the documentation corresponding to the version of Pine Script™ you are working with. It's crucial to stay up to date with the latest advancements and improvements in Pine Script™ by regularly checking the Release Notes.
That wraps up our introduction to Pine Script™ and its landscape. We hope you found these insights helpful in your journey to become a proficient Pine Script™ programmer and trader. Remember to practice, explore, and experiment with the concepts we discussed today. By combining time series with the built-in functions designed to handle them efficiently, you'll be amazed at what you can accomplish with just a few lines of Pine Script™ code.
Thank you for joining us today, and we wish you success in mastering Pine Script™ and achieving your trading goals!

Making Your First Indicator: Introduction to Pine Script Welcome back, traders! In today's video, we'll explore the powerful features of the Pine Script™ Editor, where we'll be working on our scripts. This editor offers a range of advantages that make our coding experience more efficient and enjoyable.
The Pine Script™ Editor is specially designed for writing Pine scripts, and it brings several benefits to the table. First, it highlights your code according to Pine Script™ syntax, making it easier to read and identify any errors. Additionally, it provides syntax reminders for built-in and library functions when you hover over them, helping you navigate the language effectively.
Furthermore, the Pine Script™ Editor offers quick access to the Pine Script™ v5 Reference Manual. Just Ctrl+Click (Cmd+Click on Mac) on a Pine Script™ keyword, and a handy popup with relevant information will appear. This allows you to explore the documentation without leaving the editor.
To speed up your coding process, the editor provides an auto-complete feature. Just press Ctrl+Space (Cmd+Space on Mac), and it will suggest code completions based on what you're typing, saving you time and reducing errors. These features combined make coding in Pine Script™ a breeze!
While not as feature-rich as some top editors out there, the Pine Script™ Editor still offers essential functionalities such as search and replace, multi-cursor support, and versioning. It's a reliable tool for writing and managing your Pine scripts effectively.
Now, let's dive into the practical aspect of using the Pine Script™ Editor. To open it, click on the "Pine Script™ Editor" tab at the bottom of your TradingView chart. This will bring up the editor's pane, ready for you to start coding.
For our demonstration, we'll create our first working Pine script, an implementation of the MACD indicator. Let's walk through the steps together:
Click on the "Open" dropdown menu at the top right of the editor.
Select "New blank indicator" to start from scratch.
Replace the existing code in the editor with the example script you see pasted here on my screen.
Click "Save" and give your script a name. It will be saved in your TradingView cloud account.
Finally, click "Add to Chart" in the editor's menu bar to see the MACD indicator in a separate pane below your chart.
Great job! Your first very own Pine script is running on your chart, and the MACD indicator is now displayed on your screen. Keep an eye on those blue and orange lines representing the MACD and signal values, respectively.
Now, let's level up our script by using built-in Pine Script™ functions. The second version of our script will showcase the ta.macd() function, specifically designed for calculating the MACD indicator.
To create the second version of our script, follow these steps:
Open the "New blank indicator" option from the "Open" dropdown menu.
Replace the existing code in the editor with the example script you see pasted here on my screen.
Save the script with a different name.
Click "Add to Chart" to see the updated "MACD #2" indicator in a separate pane.
Well done! In this version, we introduced inputs to allow us to change the lengths of the moving averages. By using the ta.macd() built-in function, we simplified the code and made it more readable.
With the second version of our script, we have improved our code and made it more flexible. Now, we can easily adjust the lengths of the moving averages, tailoring the indicator to our needs.
That's a wrap for this video, traders! We've explored the Pine Script™ Editor, created our first two versions of the MACD indicator, and learned valuable coding techniques. Stay tuned for the next episode, where we'll continue enhancing our indicators and strategies with Pine Script™. If you have any questions or ideas for future episodes, feel free to reach out to me. Until next time!

First Steps: Introduction to Pine Script Welcome back, fellow traders, to another exciting episode of our Pine Script™ journey! In our previous video, we explored how to use existing scripts and indicators on TradingView. Today, we'll take the next step and dive into the fascinating world of reading and writing Pine Script™.
In this episode, we'll focus on the fundamental aspects of reading Pine Script™ code and understanding its structure. By studying the code written by talented programmers, we can gain valuable insights and improve our own understanding of the language.
Reading code written by proficient programmers is the most effective way to enhance your knowledge of any programming language, and Pine Script™ is no exception. Luckily, there are numerous reliable sources for high-quality code on TradingView.
To start, you can explore the built-in indicators provided by TradingView. These indicators serve as excellent examples of well-written code. Simply load an indicator on your chart and hover over its name to access the "Source code" icon. Clicking on this icon will open the Pine Script™ Editor, where you can view the indicator's code.
The Pine Script™ Editor allows you to explore and modify the code. If you want to experiment with a specific indicator, you can make a copy of the code by selecting "Make a copy" from the "More" menu. This way, you can freely modify and save your changes without affecting the original indicator.
Another fantastic resource for reading code is the vast collection of Community Scripts on TradingView. These scripts, created by talented traders and programmers like yourself, offer a wealth of inspiration and knowledge. When browsing through Community Scripts, look for scripts without a gray or red "lock" icon, indicating that they are open-source.
Opening a script's page allows you to view its source code. By examining different scripts, you can gain insights into various trading strategies and techniques. This exposure to different coding styles will broaden your understanding of Pine Script™ and help you improve your own coding skills.
Now that we've explored reading code, it's time to unleash our creativity and start writing our own Pine Script™ scripts. Whether you're a beginner or an experienced programmer, Pine Script™ provides a user-friendly yet powerful platform for developing indicators, strategies, and even libraries.
Pine Script™ empowers us to write three types of scripts: indicators, strategies, and libraries. Indicators, like RSI and MACD, help us analyze market data. Strategies, on the other hand, include trading logic and can be backtested and forward-tested. Lastly, libraries enable advanced programmers to create reusable functions for other scripts.
I invite you all to embark on this exciting journey of writing your first indicator. With Pine Script™, we have a language that is both approachable for beginners and flexible enough for advanced traders. Let's unlock our creativity and develop trading tools tailored to our unique strategies.
Thank you for joining me today as we explored the art of reading and writing Pine Script™. Stay tuned for the next episode, where we'll dive deeper into writing indicators and unleash the full potential of this remarkable language. Until then, keep trading with passion and continue honing your coding skills!
