Gold SellGold reached another new ATH during Asia session this morning.
Taking a sell considering price ranging around the Asia exhasution zone pre-London and then again during London, after a rejection at the R3 level.
This will be a short based on price possibly pushing down towards the daily open, but targeting the Asia mid-range exhastion level only.
Overall bias is bullish and will look to take long position during NY if it presents itself.
Pivot Points

XAUUSD At a Critical Decision Zone | Expansion or Deep Pullback?📌 MARKET STRUCTURE
• Overall structure remains BULLISH
• Price is moving inside an ascending channel
• Current move is a healthy pullback , not a trend reversal
🟩 CURRENT MARKET PHASE
• Trend Phase: Bullish Continuation
• Current Phase: Corrective Pullback into Demand
• Market is approaching a key decision zone (Order Block)
🟢 KEY SUPPORT ZONES
• 4890 – 4880 → Major Order Block / Channel Support
• 4824 → Intraday Support
• 4748 → Trend Failure Level
🔴 KEY RESISTANCE ZONES
• 4940 – 4960 → Intermediate Resistance
• 5000 → Psychological Level
• 5038 → Expansion Target
✅ BULLISH SCENARIO (ACTIVE ABOVE SUPPORT)
• Price holds above 4880
• Bullish structure remains intact
• Expected continuation toward:
→ 4940
→ 5000
→ 5038
Bias: Buy the dip, avoid chasing highs
❌ BEARISH SCENARIO (ACTIVE BELOW SUPPORT)
• Strong break and close below 4880
• Bullish structure weakens
• Possible retracement toward:
→ 4824
→ 4748
Bias Shift: Bullish → Corrective Phase
📊 FINAL THOUGHT
The trend is bullish, but confirmation comes from the order block .
Patience at decision zones pays more than prediction.
⚠️ CAUTION
This analysis is for educational purposes only.
Not financial advice. Trade with proper risk management.

USDCHF- BearishFrom my perspective, higher-timeframe structure has flipped, with sellers taking control. Price has shown a clear shift in market character, breaking the prior major higher low and establishing downside intent.
From here, I’m watching for a strong HTF lower high to form, which would keep price aligned toward continuation to the lows. Until that develops, I’m simply reading the tape and tracking behavior.
Nothing forced.
Patience is key. Tracking is the edge. Let’s go.

EURUSD - BullishPrice may pause into distribution, or momentum may continue pressing toward higher highs. Either way, I let the market lead and show its hand — my job is alignment, not prediction.
At the moment, I’m monitoring key sweep areas that could provide fuel for continuation toward midterm and higher-timeframe objectives. Until that behavior confirms, it’s patience and tracking only.
Patience is key. Tracking is the edge. Let’s go.

EURGBP - BullishI’m flowing with price as it continues higher, reading behavior and tracking its footsteps. As price approaches higher highs, we’re seeing higher lows form, signaling a structure shift within the broader HTF bullish framework.
Momentum remains aligned with trend, so for now I’m simply waiting and tracking delivery.
Patience is key. Tracking is the edge.

CADJPY - BullishPrice is currently in a calm speculation zone as I observe the tape. We’re operating within a strong accumulation demand area, and from here I’m simply tracking price behavior and its footprints.
If price chooses to move forward, I’ll continue to monitor how it delivers. Until then, nothing is forced.
Patience is key. Tracking is the edge. Let’s go.

HAL Short setup.
Spotted a high-probability short setup on Hindustan Aeronautics Ltd based on multi-timeframe confluence:
- 🔴 Supply Zone aligned with Daily EMA 50 and Weekly EMA 50 – strong resistance cluster.
- 🔄 Entry on retracement into the zone, post breakdown of prior pivot low.
- 🟠 Stop Loss placed at 15% DATR above the zone for volatility buffer.
- 🎯 Target set at 1:3 RR, respecting structure and momentum.
- 📉 EMA 21 < EMA 50 confirms short bias
The zone is placed with high probability.
The trade is valid till the time price retraces to to level and moves down.
The trade remains invalid if price moves down first to form lower high and lower low and then retraces back in sessions to come.

GBPJPY - BullishPrice will do what it wants — I don’t control it, I track it. That’s the edge. As long as structure remains intact, I flow with price behavior.
Current momentum is aggressive, but the blue order block below represents a stronger accumulation area if price seeks deeper liquidity to fuel continuation. For now, I’m observing how price reacts around the current IDM and engineered liquidity. If we hold, that gives information. If we dip, that also gives information.
Nothing forced. Just tracking.
Patience is key. Tracking is the edge.

AUDJPY - BullishPrice has delivered a clean distribution back into accumulation. This is where tracking becomes the edge — once you understand where price is operating, reading behavior becomes second nature.
If a full midterm liquidity sweep occurs within accumulation, I’ll then look for a structure shift during the corrective phase to align with the next delivery. Until that condition is met, it’s strictly observation and tracking.
Nothing rushed.
Patience is key. Tracking is the edge. Let’s go.

USDJPY - BullishPrice is aggressively expanding out of the prior distribution phase, clearing fast hands along the way. Internal liquidity, IDM, and external liquidity have been systematically taken, signaling strong intent and alignment with the higher-timeframe draw.
This expansion appears to be fueled by liquidity clearance, with price pressing toward the higher-timeframe liquidity pool. Once price fully mitigates the HTF point of interest within the accumulation territory, I’ll shift focus to how we correct and re-deliver from that area.
Until then, I’m simply tracking behavior and allowing price to complete its delivery.
Nothing forced.
Patience is key. Tracking is the edge. Let’s go.

GBPUSD - BullishAs price continues to press toward mid-term and higher-timeframe highs, I’m simply observing how momentum is being delivered into those objectives. As long as bullish structure and displacement remain intact, the draw on liquidity is still higher.
If price pauses or looks for a breather, I’d expect any pullback to be corrective in nature — potentially distributing back into prior accumulation zones rather than signaling a full shift in bias. Until price shows otherwise, the expectation remains continuation.
My focus is on how price reacts once it mitigates key areas of interest. From there, I’ll look for confirmation to participate in alignment with the higher-timeframe direction, targeting the highs as the primary objective.
Nothing forced, nothing rushed.
Patience is key. Tracking is the edge.

CEG pivot long CEG has had a strong correction as natural gas prices remain low and the market overreacts to earnings per usual. Now that they own calpine they are the largest private energy producer in America. I’ve had an alarm set for 285$ for months and am heavily eyeing this one. Cash secured puts are 1700$ one month out as well. 457 is the golden fib extension macro target.

Trade The Structure On PEPE, Not The Green Candles (8H)Considering the strong breakout of price above the long-term bearish trendline and the successful reclaim of key structural levels, the overall market structure of PEPE has shifted to bullish. This move was impulsive and backed by strong momentum, which usually signals a change in market sentiment rather than a simple short-term reaction.
At this stage, we are not chasing price. Instead, the focus is on finding buy or long opportunities from the origin of the move and well-defined support zones. These areas are where smart money and market makers typically defend price after a breakout. Market makers often manipulate price by creating pullbacks or short-term sell pressure to shake out late buyers, absorb liquidity, and build long positions at better prices.
For this reason, we have identified two potential entry zones that can be executed using a DCA approach. This allows traders to manage risk more effectively and avoid emotional entries during temporary volatility. A pullback into these zones does not invalidate the bullish structure; on the contrary, it can be part of a healthy retracement engineered to trap impatient traders before continuation.
The targets have been clearly marked on the chart based on structure projections and previous resistance levels. As long as price holds above the key support and respects the reclaimed structure, the bullish scenario remains valid.
However, it is important to stay disciplined. A daily candle close below the invalidation level would signal that market makers have shifted behavior, the structure has failed, and this setup is no longer valid. Until then, patience is key and reacting to manipulation instead of chasing candles will provide the best trading opportunities.
If you have a coin or altcoin you want analyzed, first hit the like button and then comment its name so I can review it for you.
This is not a trade setup, as it has no precise stop loss, stop, or target. I do not publish my trade setups here.

CAD return to par with USD - Wyckoff AccumulationBelow is a fractal of the 2009 great recession paired with wyckoff accumulation, the last time CAD was on par with USD. The trend has accumulated for many years and is finally breaking out due to geopolitical risks and money managers looking for a safe haven with a stable banking system
This may be the end of USD as the world's premier reserve currency, instead becoming one of many forms of reserve due to their weakened financial system and largely, tariffs. The target of this structure is 1.19 CAD: 1 USD, in time the USD may recover if they can address their structural deficits and keep the FED protected, it remains to be seen. For now, international investors continue to dump US dollars for gold and other commodities to bolster the new BRICS exchange currency and more largely, gold.
The next leg up is assumed to be Japan selling USD to buy back Yen in an attempt to strengthen their own weakening economy which is currently freefalling. Treasuries sales come next

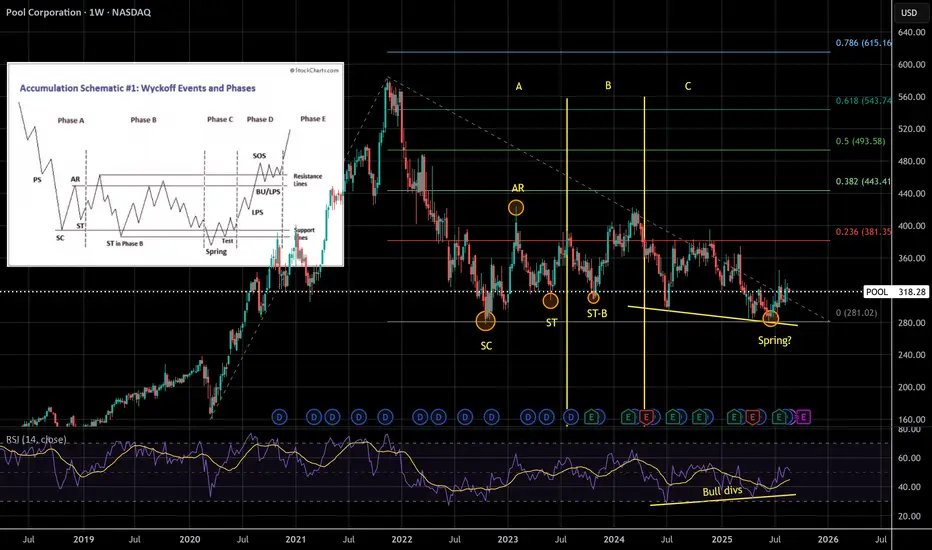
Wyckoff Accumulation Spring + Bullish DivsBullish divs and Wyckoff Accumulation, could this be the spring we're looking for?
Next to watch for is an SOS, sign of strength. A higher high is likely to take this stock to Phase E: The moon
POOL is the largest distributor of pool equipment in the world, essentially a monopoly. They are owned by Berkshire Hathaway.
QNT Main Trend. Triangle. Distribution. January 2026Time frame: 1 week. After a 147,000% pump, a large symmetrical triangle forms in the distribution zone (this is possible due to the limited supply of only 14.88 million coins, and the concentration of the bulk of the volume among the creators). Reversal zones and percentages to key support/resistance levels are shown.

QNT Secondary. Pump 147,000% Distribution. Triangle 01 2026Logarithm. Large triangle in the distribution zone. Price is pinched into a corner. Percentages to key support/resistance levels are shown.
Main trend.

Taking a short position on KAVA (4H)📉 KAVA – Bearish Market Structure & Short Setup Based on Liquidity Concepts
Liquidity pools above the price have been fully swept, indicating a classic liquidity grab on the buy side. Following this move, the market printed a bearish Change of Character (CHoCH), which clearly signals a shift in market structure from bullish to bearish.
After the CHoCH formation, price dropped aggressively with strong momentum and displacement, confirming the presence of smart money and validating the bearish bias. This impulsive move suggests that the market maker has already collected opposite-side (buy-side) orders and is now positioning price lower.
At the moment, sell-side liquidity pools below the chart remain untouched, which increases the probability of further downside continuation. As long as these liquidity levels are not swept, the bearish scenario remains valid and technically sound.
Based on this structure, we can look for sell/short opportunities within the identified order zone / supply area. This zone aligns with smart money concepts and offers a favorable risk-to-reward (R:R) setup.
📍 Entry Strategy (DCA):
We have two potential entry points, and it is recommended to enter the position using a DCA (Dollar Cost Averaging) approach to optimize entry price and manage risk more effectively.
🎯 Targets:
All take-profit targets are clearly marked on the chart, focusing on sell-side liquidity levels and key structure lows.
❌ Invalidation:
This bearish setup will be invalidated if a daily candle closes above the invalidation level. A confirmed daily close above this level would indicate a failure of bearish structure and negate this analysis.
⚠️ Disclaimer:
This analysis is based on Smart Money Concepts (SMC), liquidity theory, and market structure. Always apply proper risk management and wait for confirmation before entering a trade.
If you would like us to analyze a coin or altcoin for you, first like this post, then comment the name of your altcoin below.

FET global trend. Ascending channel. Wedge. AI hype. 01 2026Logarithm. 1-month time frame. Linear chart without market noise. The idea is to visually understand the long-term trend direction of this cryptocurrency. The AI monopolists—giants of the non-cryptocurrency world—are using it.
Medium-term and local.
FET secondary trend. Wedge. Fractals. AI hype. January 2026

FET secondary trend. Wedge. Fractals. AI hype. January 2026Logarithm. 1-week time frame. Classic trading based on reversal zones and the resulting wedge formation.
This zone is in the main trend (entire trading history). 1-month time frame. Suitable for long-term investment for those for whom trading is not their occupation.
FET global trend. Ascending channel. Wedge. AI hype. 01 2026
Markets move according to their market phases:
1) accumulation + sometimes part of it capitulation;
2) participation, that is, a price rise towards distribution;
3) distribution + sometimes part of it super hype;
4) decline, that is, a price drop towards accumulation zones and a repetition of the "golden ring of Baal's calf (Baal)"...
That is, markets move according to the seasonality of the action of large capital “without personal” (supply/demand).

XAUUSD(GOLD): Price is likely to be heading towards $4950! Gold corrected after reaching a record high of $4880. We anticipated further drops but recent geopolitical tensions have disrupted the natural price trend. Consequently, there’s a strong chance the price will move towards the $5000 area.
We’ve set up two entries – one riskier and one safer – so choose the one that suits you best. If you have any questions, feel free to ask in the comments. Your support means a lot.
Thanks,
Team SetupsFX_

ETH (JPMorgan) Global Trend. Channels. Reversal Zones 01 2026Logarithm. 1-month time frame. Linear chart without market noise. This chart is intended to visualize the long-term trend direction of this blockchain for cross-border capital banking structures.
Medium-term and local, from the perspective of the main trend, from this reversal zone, percentages to key support/resistance zones (buyer/seller interest).

BTCUSDT: Bullish Push to 91900?BINANCE:BTCUSDT is eyeing a bullish rebound on the 1-hour chart , with price bouncing from a support zone near cumulative long liquidation, converging with a potential entry area that could trigger upside momentum if buyers defend against further dips. This setup suggests a recovery opportunity after recent pullback, targeting higher resistance levels with more than 1:2.5 risk-reward .🔥
Entry between 88300–88500 for a long position (entry from current price with proper risk management is recommended). Target at 91900 . Set a stop loss at a 4-hour close below 87200 , yielding a risk-reward ratio of more than 1:2.5 . Monitor for confirmation via a bullish candle close above entry with rising volume, leveraging Bitcoin's resilience post-correction.🌟
📝 Trade Setup
🎯 Entry (Long):
88,300 – 88,500
(Entry from current price is valid with strict risk & position sizing.)
🎯 Target:
• 91,900
❌ Stop Loss:
• 4H close below 87,200
⚖️ Risk-to-Reward:
• > 1:2.5
💡 Your take?
Is this a clean liquidity-sweep rebound toward 91,900, or does BTC need deeper consolidation before any meaningful upside? 👇
