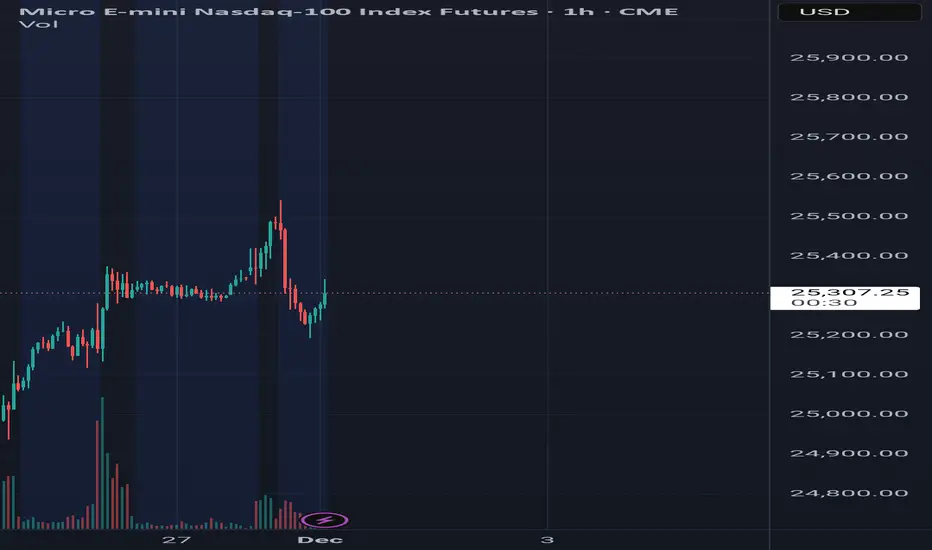
December 1st action Hello,
The market is at 25320 is right now.
The market will either go down to 25200-25000 first or it will go up to 25400-25500 before returning to 25200 on the 1st of December.
This is how the whales are planning to manipulate it today.
Pivot Points
4284.50 Sell Limit XAUUSDSafe Place For Sell on Xauusd is 4284.50 with 30/40 pip Sl And 60/80 pip Tp
Waite For Result/update

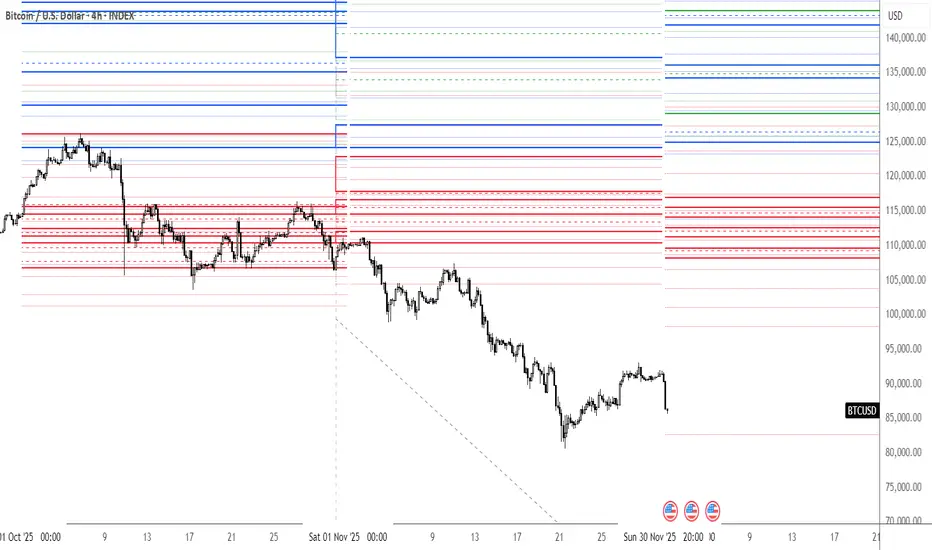
Key Levels the Month 12/2025 ∷BitCoin∷
supply 🐻&🐍&🐂 demand🔳30Day🔲
__________________________
U-Support-Resistance🔀
129068 143963 159397 162853 169545 172352 183459 188149 195060 197966
Mids∷🏛∷
124905 134172 136129 141876 143949 145557 147433 152625
L-Support-Resistance🔀
108239 109608 111230 112567 114054 115545 116924
EUR/JPY Update, New LL formed breaking the 4HR/1HR UptrendEUR/JPY Update – Structure Shift & Early-Week Outlook
Price has now formed a new Lower Low (LL) on the 1H, breaking the previous 4H/1H bullish structure. This confirms that the prior uptrend has been invalidated and that the market is showing early signs of transitioning into a downtrend.
On the chart:
The previous equal-high / supply zone has rejected price multiple times (circled areas).
Price retested the broken structure level (the neckline) and continued lower.
A clean bearish displacement followed, creating a clear LL.
The current pullback is shallow and corrective, showing weak bullish strength.
Key Level to Watch
👉 180.537
A short position becomes more favourable if price breaks and closes below 180.537, which is acting as an intraday support. A break below that level opens the door for continuation towards the next liquidity zone around the 179.5 – 179.8 area.
Early-Week Notes
It’s still early in the trading week, so flows can be choppy, but the market structure is currently favouring bearish continuation. If momentum holds and liquidity is taken below 180.537, a downtrend for the week is very likely.

4097.90 Buy Limit XAUUSDSafe Place For buy with 30/40 pip Sl And 60/80 pip Tp On XAUUSD is 4097.90, For Now...
Waiting For Result/update

4132.40 Buy Limit XAUUSDSafe Place For buy with 30/40 pip Sl And 60/80 pip Tp On XAUUSD is 4132.40, For Now...
Waiting For Result/update

STRK Analysis (4H)STRK is one of the coins that has performed well during the bear market, but after a bearish CH it has entered a downward phase.
Opening a short position at these levels is meaningless. We should wait for a proper liquidity pool to be collected and for the price to retrace upward, then enter a position at optimal levels.
The optimal zone for entering a position is the LP area. If the price reaches this zone, we expect it to be rejected toward the TP levels.
Do not enter the position without capital management and stop setting
Comment if you have any questions
thank you

ETHEREUM Analysis (12H)A large amount of liquidity has been hunted at the top, which corresponds to the all-time high. After this liquidity was taken, the price entered a bearish structure with strong momentum.
For this bearish structure to reverse or slow down, sufficient liquidity needs to be collected from the lower areas of the chart.
There is a possibility of a temporary rebound from the current levels, but the main reversal should come from the lower zone that we have identified.
We still maintain this outlook on Ethereum in the daily and 12-hour timeframes
Do not enter the position without capital management and stop setting
Comment if you have any questions
thank you

DELTA MANUFACTURINGDelta Manufacturing Ltd., incorporated in the year 1982, is a Small Cap company (having a market cap of Rs 85.24 Crore) operating in Electric/Electronics sector.
Delta Manufacturing Ltd. key Products/Revenue Segments include Ferrites (Hard) and Other Operating Revenue for the year ending 31-Mar-2025.
For the quarter ended 30-09-2025, the company has reported a Consolidated Total Income of Rs 14.42 Crore, down 1.33 % from last quarter Total Income of Rs 14.61 Crore and down 27.20 % from last year same quarter Total Income of Rs 19.80 Crore. Company has reported net profit after tax of Rs -1.55 Crore in latest quarter.
The company’s top management includes Mr.Jaydev Mody, Dr.Ram H Shroff, Mr.Abhilash Sunny, Ms.Anjali Mody, Mr.Aurobind Patel, Mr.Darius Khambatta, Mr.Jehangir Aibara, Mr.Kaarshan Awatramani, Ms.Madhuri Pawar. Company has MHS & Associates as its auditors. As on 30-09-2025, the company has a total of 1.09 Crore shares outstanding.

USD/JPY: Seeking a Swing LowThe daily chart of USD/JPY shows an established uptrend, though prices have been retracing lower for the past seven trading days. I am therefore on the lookout for a swing low in anticipation of a move back to at least 157.
The daily RSI (2) has not yet reached oversold and momentum on the lower timeframes is currently bearish. But with the 155 handle, 155.20 weekly VPOC and monthly pivot point at 155.62 nearby for potential support, perhaps a swing low is near.
Bulls could seek dips towards 155 in anticipation of a move top 157.
Matt Simpson, Market Analyst at City Index

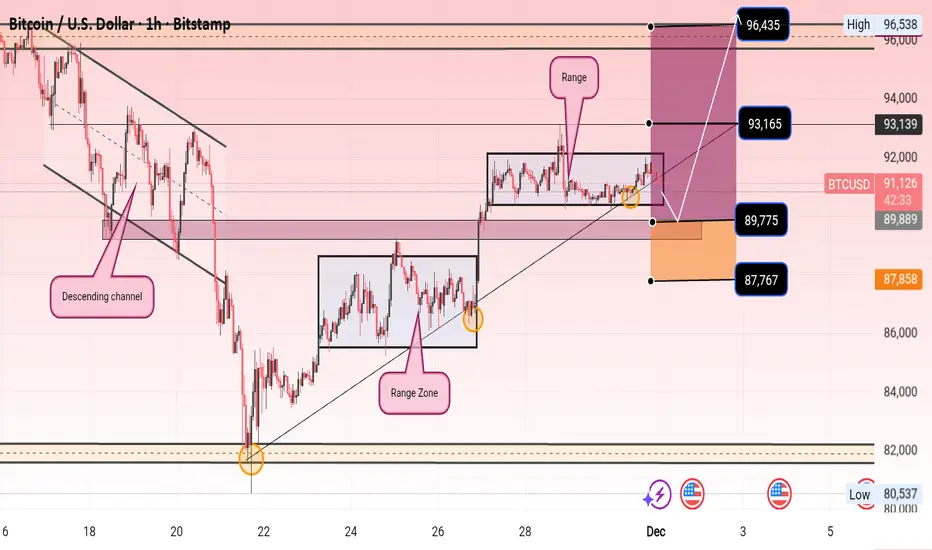
Selena | BTCUSD 1H — Breakout Setup FormingBITSTAMP:BTCUSD
Liquidity has been collected both above and below the current range, suggesting possible buildup before an impulsive expansion. A clean break and retest above the range high may trigger continuation toward the next supply zone, while failure to hold support may lead to deeper retracement.
Key Scenarios
✅ Bullish Case 🚀
Entry 89775
→ 🎯 Target 1: 96,435 (Major supply / imbalance fill)
→ Extended possibilities if momentum continues.
❌ Bearish Case 📉
Break below 87,767
If structure collapses further → deeper discount toward support demand zone below 86K–82K.
Current Levels to Watch
Resistance 🔴: 93,165 | 96,435
Support 🟢: 91,160 (range mid) | 89,775 | 87,767
⚠️ Disclaimer: This analysis is for educational purposes only. Not financial advice.
SPX Analysis (12H)As shown on the chart, the SPX structure is bearish because we have bearish CH (Change of Character) and BOS (Break of Structure).
Based on the fractals indicated with dashed lines and the drawn rectangles, we should expect one more bearish leg in this timeframe.
We are looking for sell/short positions around the swap zone.
The targets have been marked on the chart.
A daily candle closing above the invalidation level will invalidate this analysis.
Do not enter the position without capital management and stop setting
Comment if you have any questions
thank you

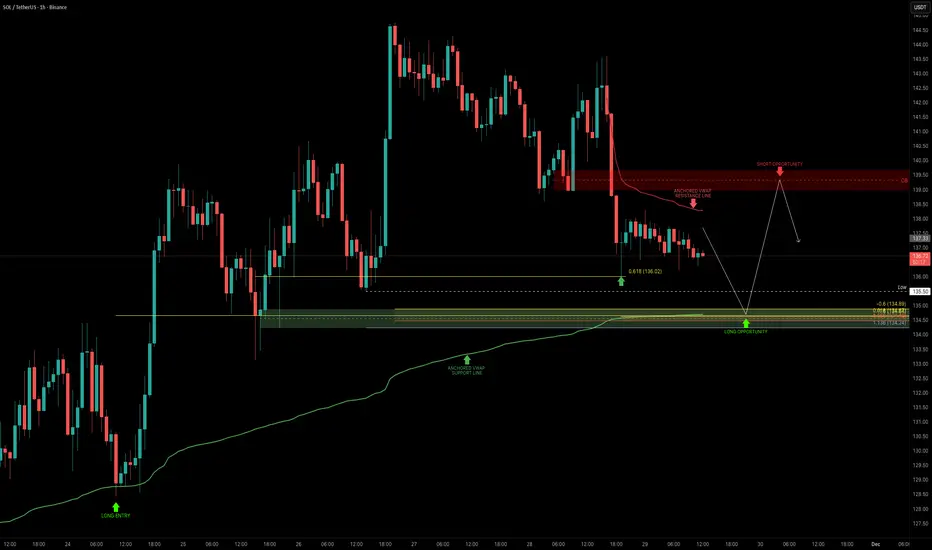
SOL — Fibonacci & Anchored VWAP ConfluenceSOL continues to be one of the most technically reliable assets, consistently respecting Fibonacci levels and key market structures. The zone between $135–$134 stands out as the next high-probability long opportunity, with multiple Fibonacci clusters lining up with the anchored VWAP from the swing low. The $134 level also aligns with the 75B market cap, adding an additional layer of confluence.
I’m looking for a long setup in this zone, targeting the $139–$140 order block for TP. This gives a clean 1:3 R:R, with the stop placed just below $133.
I’m currently developing a dynamic confluence indicator that highlights stacked support and resistance zones with high-probability reversal zones. The $139–$140 zone is currently showing a cluster of resistance, reinforcing it as the ideal TP target.
_________________________________
💬 If you found this helpful, drop a like and comment!
#BankNifty - 3000+ Points Coming?Date: 30-11-2025
BankNifty Current Price: ₹ 59,752.70
Pivot Point: ₹ 59,324.50 Support: ₹ 58,489.09 Resistance: ₹ 60,165.33
Upside Levels:
L1: ₹ 60,827.92 L2: ₹ 61,490.50 L3: ₹ 62,302.75 L4: ₹ 63,115.00
Downside Levels:
L1: ₹ 57,823.79 L2: ₹ 57,158.50 L3: ₹ 56,346.25 L4: ₹ 55,534.00
#Sensex #Markets #Stocks #IndiaMarkets #Trading #Nifty #SensexUpdate #MarketOutlook #in_tradingview

BTC crash? I believe further downside is to be expected on bitcoin, if 91000 continues to hold the a bit of downside is to be expected.

KGEN Buy/Long Setup (2H)Given the liquidity sweep at the bottom, the shift to a bullish market structure, and the formation of three iBOS signals, we can look for buy/long positions in the support zones.
Note that within the entry area, we have two points of interest, which we have marked.
The targets are also indicated on the chart.
If the stop at 0.16915 is touched, this signal will be stopped out.
Do not enter the position without capital management and stop setting
Comment if you have any questions
thank you

EURUSD is in a Downside DirectionHello Traders
In This Chart EURUSD HOURLY Forex Forecast By FOREX PLANET
today EURUSD analysis 👆
🟢This Chart includes_ (EURUSD market update)
🟢What is The Next Opportunity on EURUSD Market
🟢how to Enter to the Valid Entry With Assurance Profit
This CHART is For Trader's that Want to Improve Their Technical Analysis Skills and Their Trading By Understanding How To Analyze The Market Using Multiple Timeframes and Understanding The Bigger Picture on the Charts

EURUSD: Support & Resistance Analysis for Next Week 🇪🇺🇺🇸
Here is my latest structure analysis
and important supports and resistances for EURUSD
for next week.
Consider these structures for pullback/breakout trading.
❤️Please, support my work with like, thank you!❤️
I am part of Trade Nation's Influencer program and receive a monthly fee for using their TradingView charts in my analysis.

BANANA Analysis (4H)Given the liquidity pools forming above the pivots and the price reaching our sensitive zone
within the optimized area, we are looking for sell/short setups.
The targets have been marked on the chart.
A 4-hour candle closing above the invalidation level will invalidate this analysis
Do not enter the position without capital management and stop setting
Comment if you have any questions
thank you

FETUSDTThe overall trend of BINANCE:FETUSDT remains bearish as long as the price stays below the major moving averages. However, a potential bullish correction could start if buyers defend the key demand zone around $0.2100. A break above $0.3400 would strengthen bullish momentum and shift focus toward higher resistance targets.
Supports
$0.2100
$0.1120
Resistances
$0.3400
$0.5500
$0.7800

Internal vs External Liquidity: The Skill Nobody Actually MasterMost traders think they understand liquidity…
They mark equal highs, equal lows, and call it a day.
But let me tell you something real:
Knowing liquidity exists is NOT the skill.
Knowing WHICH liquidity matters right now is the real edge.
That’s the difference between:
✔ catching continuations
✔ catching reversals
✔ avoiding trap entries
✔ timing precision entries
✔ and actually staying in profitable moves
Most traders lose because they don’t understand the hierarchy of liquidity.
Let me break this down the way nobody online does:
⸻
🔥 1. Internal Liquidity = Fuel for Continuation
This is the liquidity inside the active range.
It sits between swing points, inside consolidation, above minor highs, below short-term lows.
Internal liquidity gets taken when:
• Market is in trend
• Price is compressing
• Price is building inducement
• Algorithms are collecting “fuel” before delivery
When internal gets swept, DO NOT expect a reversal.
Expect a continuation into the next external pool.
This is why most traders get faked out:
They see a sweep and scream “reversal!”
But they’re reacting to internal liquidity — not the real turning point.
⸻
🔥🔥 2. External Liquidity = The Real Reversal Zones
External liquidity sits at the RANGE BOUNDARIES:
• The major swing high
• The major swing low
• The extreme points of the structure
These are the levels that actually SHIFT trend, cause deep pullbacks, or start major legs.
This is where smart money:
✔ Clears the crowd
✔ Triggers stops
✔ Closes positions
✔ Repositions
✔ Begins delivery in the opposite direction
External liquidity is the turning point.
Internal liquidity is just the build-up.
If you can’t distinguish the two, every reversal will feel random to you.
⸻
🔥🔥🔥 3. Here’s the Rule Nobody Teaches:
If price sweeps internal → expect continuation.
If price sweeps external → expect correction or reversal.
But here’s where MOST traders fail:
They don’t know which one they’re looking at.
If you think a reversal is starting but you’re still inside the range…
You’re not trading a reversal.
You’re trading hopium.
⸻
🔥🔥🔥🔥 4. How Smart Money Chooses Which Liquidity to Target First
This is where your real edge comes in.
Smart money asks ONE question:
“Which pool unlocks the next delivery path?”
If the next objective is above → they’ll sweep internal lows to build power.
If the next objective is below → they’ll sweep internal highs to induce buyers.
Smart money is always targeting what unlocks:
✨ the cleanest path
✨ the imbalanced leg
✨ the untouched zone
✨ the unmitigated order block
✨ the next HTF objective
You think the sweep is the entry.
They see the sweep as the setup.
⸻
🔥🔥🔥🔥🔥 5. Here’s the TRUTH:
Internal liquidity fuels the move.
External liquidity flips the move.
If you master this one skill, your whole trading shifts.
Your confidence shifts.
Your timing shifts.
Your strike rate shifts.
You stop chasing noise.
You stop guessing bottoms.
You stop guessing tops.
You start reading intention — not reacting to candles.
Most of the trading world knows liquidity.
Almost nobody knows when liquidity actually matters.
That’s the part the textbooks don’t teach.
That’s the part the YouTubers don’t show.
That’s why most traders stay confused for years.
Internal liquidity gets you in —
External liquidity gets you paid.
Master the difference and you’ll trade with precision most people only dream of.

GBPJPY - Bullish Outlook | Tracking the Next DeliveryHigh Timeframe (HTF):
GBPJPY remains bullish, breaking major external highs with strong upside intent.
No HTF sweep, no HTF OB mitigation — just straight continuation, currently sitting in premium territory and pausing.
⸻
Mid-Term View (MTF):
Structure remains bullish as we apply continuation logic.
At this stage, price is seeking liquidity — I want to see SSL taken and a mitigation into the mid-term OB.
Once that happens, I’ll watch for confirmation to engage.
⸻
Lower Timeframe (LTF):
If the LTF gives a clean CHoCH / flip, that’s my cue.
From there, I’ll be taking buy points inside the bullish leg, following the flow of smart money and targeting the next set of highs.

NZDUSD- Bearish Framework with Bullish Reversal PotentialHigh Timeframe (HTF):
HTF is bearish, breaking significant lows and showing clear downside intent.
⸻
Mid-Term Perspective (MTF):
Price took the IDM and failed to hold the internal OB continuation zone.
Instead, it pushed deeper, taking HTF liquidity and tapping the internal imbalance / reaction area beneath it.
At this stage, I’m waiting for a full mid-term CHoCH.
Once that confirms, alignment shifts.
⸻
The Setup I Want:
After the mid-term CHoCH:
• I want a sweep of fresh BSL
• Price must tap into my mid-term OB
• Mitigation must be clean and displacement must be present
Only then do I drop down into the LTF.
⸻
Lower Timeframe (LTF):
Once the LTF prints the bullish flip / micro CHoCH,
I’ll place sell points inside the new bearish leg and target the next liquidity pockets above.
⸻
Mindset / Execution:
• HTF bearish → waiting for mid-term shift
• Liquidity → CHoCH → OB → LTF confirmation
• No rushing the transition
• Tracking > predicting
