Altcoin Investing in 2026: Hype, Risk and Smarter ChoicesBitcoin surges often pull altcoins back into view. New traders arrive chasing memories of huge gains instead of focusing on risk, cycles, and how these markets truly behave.
How BTC and altcoin cycles really work
When Bitcoin runs, the money usually follows a rough sequence:
- Bitcoin comes first. It pulls in traders early because it moves aggressively but still feels like the “safest” crypto asset.
- Then rotation begins. After BTC pumps and starts to consolidate at higher levels, some capital slowly rotates into other coins. Large caps like ETH or SOL usually see interest grow first, then mid‑caps, and finally the smallest and riskiest names.
- The lower you go, the later you are. By the time memecoins and tiny microcaps explode, the cycle is often in its late stages, when 80–90% drawdowns stop being rare and start becoming routine.
Altseason is a short phase within a Bitcoin cycle, not a permanent state. It shows up briefly, burns hot, and then fades.
Why most people lose money on altcoins
Psychology matters more than any pattern you can draw on a small-cap chart.
- Late FOMO entries. Fear of missing out appears when prices move too fast. Buyers jump in late, hoping the rally never ends. It often ends right after they do. Chasing candles rarely ends well.
- Emotional attachment to entry price. Many holders get stuck on “my buy level.” They refuse to cut losers, waiting endlessly to get back to break-even while odds of recovery shrink. Hopes stay high as numbers grind lower, driven more by memory than logic.
- Hype over substance. Only a minority of new projects actually ship something useful. Most survive on bold promises and clever tokenomics. Treating them as serious long‑term investments is usually just short‑term gambling in disguise.
When altcoins can make sense
A healthier approach is to flip the structure of your portfolio:
- Base layer: Bitcoin and Ethereum as the foundation.
- Speculative layer: Altcoins treated as experimental bets stacked on top of that base, not underneath it. Your core stays stable; the risky part is clearly separated.
A few practical guidelines:
- Allocate only a slice of your crypto stack – for example, 10–30% – to altcoins, instead of risking everything at once. This keeps risk in its place and prevents one bad narrative from sinking your whole portfolio.
- Focus on coins with:
- Clear, visible teams.
- Real use cases or products.
- Liquidity good enough to enter and exit without massive slippage.
- A track record across at least one full market swing, not just a few weeks of hype.
- Think in scenarios, not fantasies: “How much am I willing to lose if the trend flips quickly?” is more important than “How much could I make if this does a 10x?”.
Most altcoins work better as swing or position trades held for weeks or months with planned exits, not as indefinite “HODL forever” bags. A written plan almost always beats blind patience.
Simple rules to avoid getting burned
- Plan before you buy. Note:
- Why you are entering.
- Where the idea is invalidated (the price level that proves you wrong).
- First profit targets where you will take something off the table.
- Question every narrative. A popular account talking up a coin does not make it valuable. Ask:
- What real problem does this token solve?
- Who actually uses it day to day?
- Would it matter if the token disappeared tomorrow?
- Compare everything to Bitcoin. If an altcoin underperforms BTC for weeks or months, you are accepting more risk for less reward. In that case, holding it “just because” is hard to justify.
The quiet lesson
Altcoins can boost profits during strong upswings, but they amplify mistakes just as quickly. Emotions swell; discipline fades. The most resilient portfolios usually:
- Build a solid foundation in Bitcoin (and often Ethereum).
- Add smaller experiments only when the base is secure and position sizing is controlled.
Miracle chasing tends to erode patience and capital. Durable results usually come where curiosity meets restraint, not frenzy.
Plan

The Transformation Every Trader Must Make!!!Every trader begins with the same goal: “I want to make money.”
But the traders who last, the ones who grow, evolve, and eventually become consistent, go through a quiet transformation:
They shift from thinking about money...
to thinking about probability, structure, and process.
Here’s the transformation in three stages:
1️⃣From Outcome-Driven → Process-Driven
Beginners measure success by whether a trade wins or loses.
Professionals measure success by whether they followed their plan.
- Because a good trade can lose.
- And a bad trade can win.
- Confusing the two destroys growth.
Your job is not to win every trade!
Your job is to execute with integrity.
2️⃣From Prediction → Preparation
Beginners try to guess where the market will go.
They draw a level… then hope.
Professionals don’t predict, they prepare.
They plan both sides:
- If price does X, I do Y.
- If price breaks Z, I step aside.
- If the structure shifts, I adapt.
Prediction feeds the ego.
Preparation feeds the account.
3️⃣From Emotional → Probabilistic Thinking
Beginners think every trade is “the one.”
Professionals think in sample sizes.
- One trade means nothing.
- Five trades mean nothing.
- Fifty trades reveal the truth.
When you think probabilistically:
- Fear shrinks.
- Confidence grows.
- Discipline becomes natural.
Because now you see the market for what it is:
a place where anything can happen, but certain behaviors win over time.
📚 The Real Lesson
Trading becomes easier when you stop trying to force results and start building a process that produces results over the long run.
The market doesn’t reward intensity.
It rewards consistency, clarity, and adaptability.
Your transformation begins the moment you shift from:
“I need this trade to win”
to
“I need to follow my plan.”
That’s when you stop gambling… and start trading.
⚠️ Disclaimer: This is not financial advice. Always do your own research and manage risk properly.
📚 Stick to your trading plan regarding entries, risk, and management.
Good luck! 🍀
All Strategies Are Good; If Managed Properly!
~Richard Nasr
The Trade You Don’t Take!Most traders focus on entries, strategies, indicators, patterns…
But the truth is: your biggest edge is avoiding low-quality trades.
The market rewards patience far more than prediction.
Here’s the framework professional traders use to filter noise from opportunity, something 90% of traders overlook:
1. The Market Must Be Aligned
Before placing any trade, ask one question:
“Is the market trending, ranging, or correcting?”
Your strategy only works in the right environment.
A breakout strategy fails in a choppy range. A mean-reversion setup dies in a strong trend.
Identify the environment first, then choose the setup.
2. Your Levels Must Be Significant
True opportunity comes from reaction points, not random prices.
Look for:
- Major swing highs and lows
- Weekly or monthly levels
- Clean trendlines with multiple touches
- Areas where price previously paused, reversed, or consolidated
If the market isn’t near one of these levels, you’re trading in the middle, where noise lives.
3. Your Risk Must Make Sense
A good setup with a bad risk-to-reward is a bad trade.
Professionals only act when:
- The stop-loss is logical (protected behind structure)
- The target is realistic
- The reward outweighs the risk
If the math doesn’t work, the trade doesn’t happen.
🧠 The Hidden Lesson
Great traders don’t trade more, they filter more.
Your account grows not by finding better entries,
but by avoiding the trades that drain your capital, energy, and confidence.
Master the art of waiting, and your strategy will finally start working the way it was designed to.
⚠️ Disclaimer: This is not financial advice. Always do your own research and manage risk properly.
📚 Stick to your trading plan regarding entries, risk, and management.
Good luck! 🍀
All Strategies Are Good; If Managed Properly!
~Richard Nasr

The Hidden Skill Every Great Trader Masters; And It’s Not Chart!Most traders spend years perfecting chart patterns, indicators, and entries…
Yet only a handful ever master the real skill that separates professionals from the rest, the art of waiting.
📉 Anyone can draw support and resistance.
📈 But not everyone can wait for price to reach them.
The market rewards patience, not predictions.
It’s not about catching every move, it’s about being ready when your setup aligns perfectly.
That’s when you strike. That’s when probability works for you, not against you.
Think of trading like fishing 🎣:
You don’t chase the fish, you position your line where it’s most likely to bite, then you wait.
So next time you feel the urge to jump in early, remind yourself:
You’re not just a trader. You’re a waiter, paid in precision and patience.
📚 Key takeaway:
Great traders don’t predict, they prepare.
They let the market move first, then respond with clarity.
⚠️ Disclaimer: This is not financial advice. Always do your own research and manage risk properly.
All Strategies Are Good; If Managed Properly!
~Richard Nasr

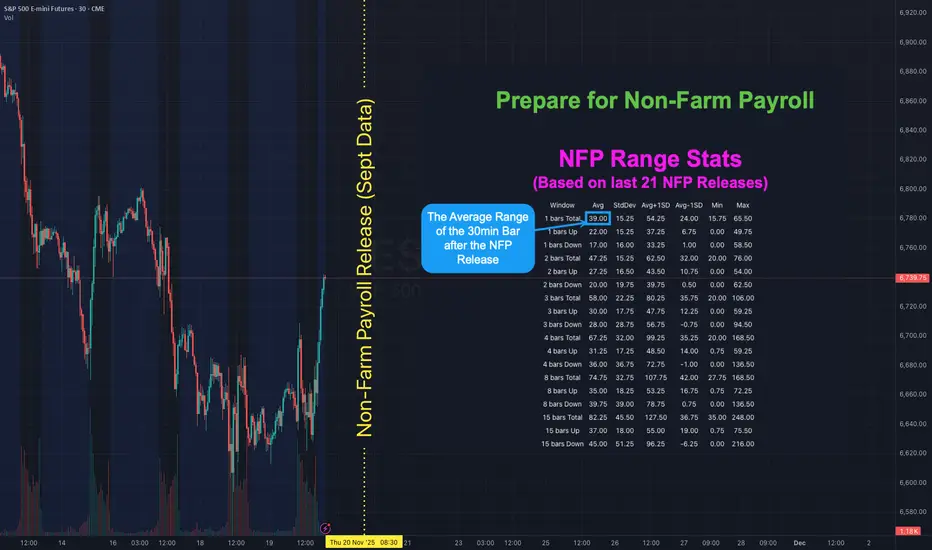
NFP is Back! Here's how to map out your playbook with statsHOW TO USE NFP RANGE STATS TO PREPARE YOUR PLAYBOOK
There has not been a Non-Farm Payroll release since Friday 5 September 2025 . Due to the government shutdown the September report that was originally set for Friday 3 October was postponed. It will finally be released on Thursday 20 November - a 48 day delay. With uncertainty around the labour data higher than usual it helps to know what “normal” looks like for ES S&P Futures. The table shows historical ranges after the 08:30 ET release on a 30-minute chart: 1 bar (30mins), 2 bars (60mins) 3 bars (90mins), 4 bars (2hrs), 8 bars (4hrs) and 15 bars (up to ~16:00 ET). The stats are based on the last 21 NFP releases (approx 2-years).
👉 If you think this would be useful as a script you can run yourself let me know (boost and drop a comment) and if there's enough interest I'll see if I can publish something.
WHAT THE COLUMNS MEAN
Avg - the typical move for that window based on past NFPs
StdDev - the variability around that average
Avg + 1 StdDev and Avg - 1 StdDev - quick upper and lower guardrails for a “normal” day
Min / Max - historical extremes in the sample
WAYS TO USE IT
1) Set guardrails for price discovery
Use Avg + 1 StdDev as a first “stretch” expectation for the window you trade. If price pushes beyond that level early you know we are outside normal and can adapt position size and expectations.
2) Pre-plan targets and emergency exits
Before 08:30 ET map a base scenario. Example for ES: if the 30m Avg post-release is X then a first take-profit can sit near X and a stretch target near Avg + 1 StdDev . Place an emergency stop beyond the Avg - 1 StdDev line if fading the first move.
3) Size positions to volatility
Translate the Avg 30m range into ticks or points and size so that a typical NFP bar does not exceed your defined risk. If your stats say the first 30m averages 9 points on ES do not run a size that cannot survive a 9-12 point swing.
4) Choose a playbook by window
1 bar (30m) - breakout or first-reaction mean-reversion
2-4 bars (60-120m) - continuation or reversal probabilities stabilise around the Avg envelope
8-15 bars - when the full session range is already at or beyond Avg + 1 StdDev be cautious chasing late moves
With the report 48 days late the probability of surprise is elevated. Go into the print with your ranges pre-mapped and your position sizing tied to those Avg and Avg ± StdDev bands. Clarity beats adrenaline.
👉 REMINDER:
If you think this would be useful as a script you can run yourself let me know (boost and drop a comment) and if there's enough interest I'll see if I can publish something.
Halloween Special: The Risk “Treats” That Keep You Alive!🧠 If October has a lesson, it’s this: fear is useful, panic is fatal. Great traders don’t fight the monsters; they contain them.
Here’s my Halloween mindset & risk playbook:
🧪 Keep your “lifeline” small: Risk a fixed 1% per trade until your balance moves ±10%, then recalibrate. This makes loss streaks survivable and hot streaks meaningful.
⏰ Set a nightly curfew: a max daily loss (e.g., 3R or 3%). Hit it? Close the platform. No “one last trade.” Curfews save accounts.
🛑 Define your invalidation before you enter: If that level prints, you’re out, no arguments, no “maybe it comes back.” Plans beat feelings.
🎯 Hunt asymmetry: If you can’t see at least 2R cleanly (preferably 3R), pass. You don’t need more trades; you need better trades.
🧟 Kill the zombie trade: the one you’re babysitting, nudging stops, praying. If you’re managing hope more than risk, exit and reset.
🧘 Protect your mind equity: Two back-to-back losses? Take a 20-minute break. After a big win? Journal before you click again. Calmness compounds.
📜 Make a ritual: pre-trade checklist → position size → entry → stop → targets → log. Rituals turn uncertainty into routine, and routine into consistency.
What’s your #1 rule that keeps the “revenge-trading demon” out of your account❓
⚠️ Disclaimer: This is not financial advice. Always do your own research and manage risk properly.
📚 Stick to your trading plan regarding entries, risk, and management.
Good luck!
All Strategies Are Good; If Managed Properly!
~Richard Nasr

BTCUSD: Failing to recover, short setup near EMABTC analysis – october 14, 2025
At the moment, BITSTAMP:BTCUSD has failed to sustain its recovery and is pulling back toward the 111,192 USD area. The overall trend remains bearish, as price is now trading below the EMA, indicating that sellers still have control over the market.
Trading plan for today:
Priority: look for short (sell) opportunities in line with the main trend.
Wait for a pullback as price retests the EMA zone.
Once price reaches that area, watch for one of the following price action setups:
DD (Double Doji)
SB (Second Break)
→ When either setup appears, consider a market entry.
Trade management:
Stop loss: above the nearest swing high of the pullback.
Take profit: targeting a 2R – 3R reward-to-risk ratio, depending on price behavior.
Summary:
BITSTAMP:BTCUSD remains in a clear downtrend. Any short-term bounce is seen as an opportunity to sell with the trend. Patience is key wait for a clean setup around the EMA zone to secure a good entry and minimize risk.
Daniel Miller @ ZuperView

BTCUSD: Buy signal forming📊 BITSTAMP:BTCUSD Analysis – October 13, 2025
🔁 Last Week Summary
Last week, we successfully completed the BTC Sell plan,
and the trade reached its target as expected.
📈 Market Outlook for the New Week
After a deep correction, BTC is showing signs of recovery.
Currently trading around 115,561, above the EMA,
indicating that a short-term bullish structure is forming.
🧭 Trading Plan for Today
Scenario 1 – Buy with trend:
Wait for a pullback to EMA and look for a DD (Double Doji) setup.
If confirmation appears near EMA → enter long following the bullish momentum.
Profit target for long position is 2R or more.
Scenario 2 – No setup / breakdown below EMA:
If price fails to form DD and closes back below EMA,
it may lead to the formation of a wider consolidation range.
In this case, stay on the sidelines and wait for clear trading signals before entering.
🎯 Summary:
Short-term bias: Slightly bullish, pending confirmation.
Key plan: Buy near EMA if DD forms.
If price breaks below EMA → expect wider accumulation, stay patient.
Please like and comment below to support our traders. Your reactions motivate us to do more analysis in the future 🙏✨
Daniel Miller @ ZuperView

Giving Back Profits - The Trap of 'Just One More'NOTE : This is a post on Mindset and emotion. It is NOT a Trade idea or strategy designed to make you money. If anything, I’m posting this to help you preserve your capital, energy and will so you can execute your own trading system with calm, patience and confidence.
The trouble doesn’t start with the win.
It’s what happens after the win that sets the course for the unwind.
Take this scenario as an example.
You finish the morning well in the green.
You are focused, composed in flow
And then the thought creeps in:
“Just one more”
“I’m on fire.”
“Let's make it count”.
That’s when strong sessions turn into regret.
What’s really happening inside you:
Thoughts: “If I’d sized bigger earlier, I’d have more.” “Stopping now is leaving money on the table.”
Feelings: Euphoria, Invincibility. Subtle disbelief that this winning streak could end.
Behaviours: Taking marginal setups, holding too long, over-sizing.
Body cues: Elevated energy, buzzing restlessness, almost addictive “high.”
Trigger: A profitable trade or session - the buzz of winning.
This isn’t opportunity. It’s the discomfort of stopping.
Your brain has just been flooded with dopamine - the chemical of reward and anticipation.
When you stop, that rush fades fast.
The body doesn’t like the drop, so it urges you to keep going.
It’s not greed - it’s biology.
Your system is craving the stimulation that came with the win.
The mind interprets that craving as “one more setup.”
But what it’s really chasing… is the feeling of being alive in the action.
Learning to sit with that energy, without acting on it is emotional mastery.
Mastery isn’t about cutting winners it’s about knowing the difference between pressing your edge and chasing the feeling.
One comes from clarity and alignment with your plan.
The other comes from chemistry and compulsion.
Both feel powerful in the moment but only one keeps you in the game.
Once you can see that impulse for what it is a chemical pull, not true opportunity the next step is learning how to regain control before it takes you off plan.
How to shift it:
Define the finish line: set a daily stop time or target and honour it. End when you said you would. Winning traders know when to walk away.
Reframe the win: Booked profits aren’t ‘missed opportunity’. They’re proof that you’ve followed your process and protected your edge.
Closure ritual: write: “Today I protected my edge.” Train your body and mind to link stopping with success, balance and composure.
👉 The market always offers “just one more.” The pros know: the real edge is keeping what you’ve earned.
Highlighting once again the post on Non Farm for anyone that missed it. The announcement is currently rescheduled for Friday 10th (due to the US Government Shut Down). Link below:

BTCUSD: Weekly reviewThis week, BITSTAMP:BTCUSD recorded a strong rally, moving from 109,900 → 120,800, equivalent to about +10,900 USD (+9.9%).
After last week’s sharp decline, the market clearly reversed into an uptrend as price broke out and held firmly above the EMA.
Today is Friday, and the market may experience strong volatility due to the Non-Farm Employment Change (NFP) report – an event that often has a major impact on price movement and trading strategies during the day.
Key Setups of the Week
1. BITSTAMP:BTCUSD Review – September 29
After a sharp drop, BTC rebounded, broke out of the range, and held above the EMA.
This was an early signal confirming a trend reversal from bearish to bullish.
2. BTC Review – September 30
After breaking out of the larger range and rallying strongly, the plan was to wait for a pullback toward the EMA.
Price formed a diagonal wave and gave confirmation signals through DD (Double Doji) / FB (First Breakout).
The entry was triggered, and the market rallied nicely, hitting the target as expected.
3. BTC Review – October 1
After the rally, BTC retraced and closed below the EMA.
At this point, the short-term trend was unclear → staying out and waiting for more market data to avoid unnecessary risk.
4. BTC Review – October 2
On the following day, price recovered and consolidated right at the upper boundary of the range.
EMA pressed tightly, creating a momentum compression zone and setting up for the next breakout.
The plan was to wait for RB/ARB confirmation, then Buy following the breakout.
This setup worked out successfully, BTC broke out strongly and continued to hit the target.
5. BTC Review – October 3
The main bullish trend continued, showing no signs of weakness.
The plan: wait for a pullback to the EMA, confirm a FB/SB (Second Breakout) signal, then Buy in line with the uptrend.
The scenario played out accurately, delivering another profitable setup.
Conclusion
Trend of the week: Clearly bullish.
Buy setups around EMA and breakout strategies performed effectively, resulting in a consistent winning streak.
Caution for today: With NFP on the schedule, unusual volatility may occur. Traders should manage risk carefully and patiently wait for clear confirmation signals before entering the market.
You can refer to my previous analysis here:
Please like and comment below to support our traders. Your reactions motivate us to do more analysis in the future 🙏✨
Daniel Miller @ ZuperView

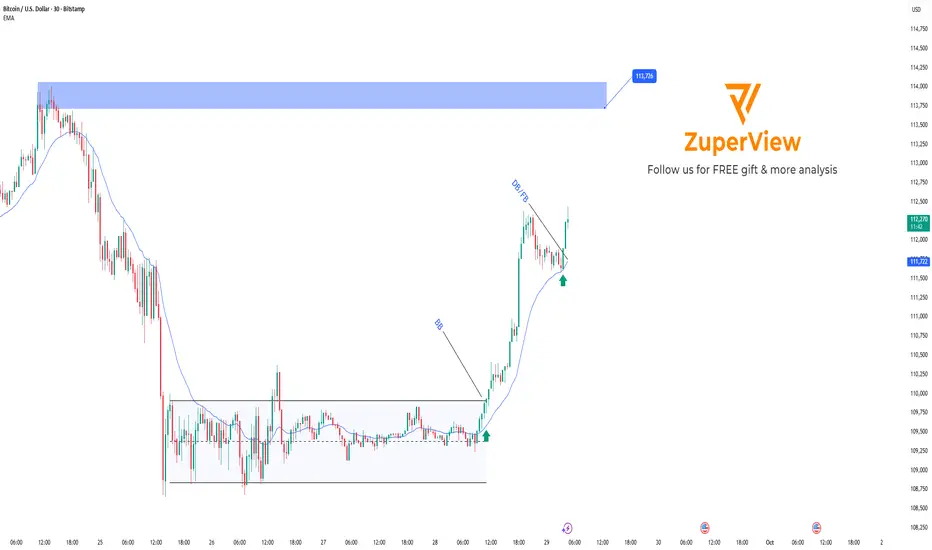
BTC escapes consolidation, shifting into an uptrend
Price has broken out of the sideway range 108,500 – 109,800, shifting from bearish to bullish.
After the BB (Block Breakout), BTC surged to 112,500 – 113,000 before consolidating.
Currently, price is trading far from the EMA (around 111,100), implying a possible pullback.
Strategy:
Wait for price to retrace toward EMA (111,000 – 111,200) or consolidate in this zone.
If patterns such as DD (Double Doji) or FB (First Breakout) form within 111,000 – 111,500, consider long entries.
Please like and comment to support our traders. Your feedback motivates us to produce more analysis in the future 🙏✨
Non-Farm Payrolls: Do You Trade the Print or Let It Pass?NOTE – This is a post on Mindset and emotion. It is NOT a Trade idea or strategy designed to make you money. If anything, I’m posting this to help you preserve your capital, energy and will so you can execute your own trading system with calm, patience and confidence.
Every first Friday, the market braces for NFP.
For some, it’s a chance to catch a big move.
For others, it’s a day to protect capital and energy.
The real question isn’t just what’s the number?
It’s: What’s your process around events like this?
Here’s the work to do before Friday:
1. Define your approach
Are you trading the release, fading the first spike, or waiting until the dust settles? Write it down before the event - don’t decide in the heat of the moment.
2. Check what’s pulling you in
Is it part of your tested edge, or are you driven by FOMO, the rush of adrenaline, or the feeling that you “should” trade it?
3. Notice your body’s signals Faster breathing or shallow breaths
Shoulders tightening
Heart rate climbing
Narrowed focus on the screen
Fingers itching to click
These are not just “nerves” they are signals. Use them as feedback, not fuel.
4. Review the impact afterwards
Did trading the news leave you calm, in control and aligned with your plan?
Or did it drain your energy, push you into overtrading, or spark regret?
The point isn’t whether NFP is an opportunity or a trap . It can be either.
The edge comes from knowing yourself, deciding ahead of time and sticking to a process that matches both your system and your psychology.
So before the number drops, get clear:
- Do you have a defined playbook?
- Or are you letting the market and your body pull you into one?
If you’re contemplating trading at any point around the NFP number you might want to check out @JeffBoccaccio’s posts on ES range expectations around the release for some idea on how he frames the news event. Start here but check out the linked video post for a walk-through explanation:

BTC consolidates after a significant price spikeBITSTAMP:BTCUSD price has had a slight correction after the previous increase.
Yesterday, the price broke the trendline and the EMA approached, creating a momentum accumulation zone before a strong break - as planned to buy.
Currently, BTC is correcting after the increase, just cutting down the EMA, showing that buying power is weakening, the short-term trend may turn down.
There is no clear signal to enter the order. Continue to observe the price reaction around the EMA and wait for a clear setup before taking action.
You can refer to my previous analysis here:
Please like and comment to support our traders. Your feedback motivates us to produce more analysis in the future 🙏✨

SUCCESS OR FAILURE: MINDSET OR SKILLS?Anfibo's here. Today, I wanna share you guys my valuable experience.
For new traders who just want to trade, after learning the basics, your strategy boils down to 4 things:
Fundamental Analysis (FA)
Technical Analysis (TA)
Fund Management (FM)
Risk Management (RM)
Think of it like a battle. The market is the battlefield, and you’re the warrior:
FA and TA are your sword and spear. The more you sharpen these skills, the better your edge in trading.
FM and RM are your shield and armor. Manage them well, and you’ll stay protected and survive longer.
But gear alone isn’t enough to win!
MINDSET—like a warrior’s spirit—is the real key to success or failure. Here are 6 common psychological factors, or keywords that every trader faces:
1. TREND FOLLOWING: The trend is your friend. Don’t fight it!
2. OPPORTUNITY COST: In the end, we only regret the chances we didn’t take
3. ENDOWMENT EFFECT: This is when you overvalue something just because you own it. Don’t fall in love with your trades—overpricing them leads to disaster!
4. ANCHORING EFFECT: This happens when you cling to the first piece of info you get and base decisions on it, even if it’s wrong. Don’t let one bit of news steer your choices.
5. GREED: Wanting too much can backfire. Greed leads to mistakes!
6. DECISIVE: Be bold. Hesitating at key moments can cost you.
I call these six keywords my “SIX-WORD MANTRA.” Why? Because in trading, mindset controls 60% of your success or failure. Skills make up the other 40% —and if you’re not great at them, you can lean on others’ expertise.
That’s why I always tell newbies: at the very least, learn enough to read someone else’s chart, spot the entry and stop-loss points, and make your own decisions. Don’t just blindly follow some influencer or “expert” online shouting to buy something—that’s a recipe for trouble if you lack knowledge or your own judgment!
What’s your take? Drop a comment, and let’s discuss!
If you agree with me, follow me to read more of my good articles.
And I’m An, just sharing what I know about finance ;)

XAU/USD – FED dovish, gold extends momentum; SELL only for scalp⚓️ Captain Vincent – Gold Plan XAU/USD
1. Market Waves 🌍
The probability of a FED rate cut in September has surged to 96.6% (from 90.4% earlier) after the JOLTS report showed weakening job prospects.
Several FED officials, from Kashkari to Bostic, turned dovish. Only Musallim maintained a hawkish stance, with a scenario of just one cut.
As a result, flows rushed back into gold as the #1 safe haven , fueling a strong rally last night.
📌 Key data today (04/09 – US time):
ADP Nonfarm (7:15)
Jobless Claims (7:30)
ISM Services PMI (9:00)
👉 This trio of data could trigger significant volatility for GOLD.
2. Technical Outlook ⚙️
M30/H1 Chart: gold keeps forming bullish BOS , with the main trend still upward.
Golden Harbor 🏝️ (Buy Zone 3,477 – 3,479): old Order Block, strong support if price retraces.
Quick Boarding 🚤 (Sell Scalp 3,561 – 3,563): suitable only for short-term scalps.
Storm Breaker 🌊 (Sell Zone 3,573 – 3,575): aligned with fibo 0.618–0.786 resistance, high chance of strong supply.
Captain’s Shield 🛡️ (Support): 3,526 – 3,515 – 3,508
3. Captain Vincent’s Map – Trade Scenarios 🪙
🔺 Golden Harbor 🏝️ (BUY – Priority)
Entry: 3,477 – 3,479
SL: 3,470
TP: 3,480 → 3,483 → 3,486 → 3,491 → 349x → 35xx
🚤 Quick Boarding (SELL Scalp – short-term only)
Entry: 3,561 – 3,563
SL: 3,569
TP: 3,558 → 3,555 → 3,552 → 354x
🌊 Storm Breaker (SELL Zone – strong resistance)
Entry: 3,573 – 3,575
SL: 3,581
TP: 3,570 → 3,565 → 3,560 → 3,555 → 35xx
4. Captain’s Note ⚓
“The gold sail is filled with dovish winds from the FED. Golden Harbor 🏝️ 3477 remains the safe anchor to ride the trend. SELL setups are just Quick Boarding 🚤 scalps at Storm Breaker 🌊 , not long voyages.”

Weekly Volatility ReadGood Evening --🌗 🌕🌓
I hope everyone is having a relaxing weekend with friends and family alike because soon we will be in the thick of the price action again -- and it may get spicy! Let't us dive in as we review what happened last week and we look towards the next to trade range or observe.
The CBOE:SPX opened the week fairly slow at $6,193.18 and increased throughout the week wicking up to a new ATH of $6,315.61 only to close the week off at $6,267.28 -- This leaves the IM on the week +$83.10. This closest respects the quarterly implied range that was a 'strength of IV' of 129.30%.
Now looking towards this next week we have extremely low HV across the board in the broader markets. CBOE:SPX IV (13.14%) is trending 32% IV percentile on the year -- premium is seemingly cheap. HV10 (6.97%) is coiled within 97.67% of it's sliding yearly lows, showing a need for short-term volatility to consolidate. HV21 (7.78%) is even more coiled to it's yearly low at 98.76% respectively. Both are roughly mid 50% 'strength to IV' as IV predicts twice the potential move next week.
Lastly, HV63 our quarterly trending values is showing a 'strength of IV' at only 108% but, could be supporting the thesis IV is projecting, as we do need a TVC:VIX pop OR time-wise consolidation. 📈📉
I hope everyone has a great week trading ranges and I will see you next weekend!
Cheers! 🍻🍻🍻
Weekly Volatility Snapshot Good Evening --
I hope everyone is having a restful weekend and enjoying your time away from markets. Always appreciate it while you can, and spend that precious time with loved ones. Now, let us review the price action last week as we look towards our expectations for the coming trading sessions.
The CBOE:SPX opened the weekly candle at $6,126.15 and closed $6,252.50 -- this respectively puts the weekly move at +$126.35. This is slightly above what IV was stating entering the week. We are starting to see seasonality set in as the markets top and look for consolidation. The TVC:VIX dropped throughout the week putting a bottom in at $15.70 which shows volatility creeping to it's lowest point year-to-date.
We should all expect a volatility bounce in the near future as the run the broader markets have made out of the steep correction needs to cool off before moving forward. Below is my volatility read for the S&P 500. You will see that HV10 (7.94%) is coiled within 3.30% of its sliding yearly lows. This tells me between the low sentiment in fear and the low volatility in short-term trends, we need to cool off a little.
Now looking towards this week, I see the broader markets consolidating and even selling off in order to reset the overbought 'lagging' indicators and pop the VIX up a little bit. The administration has pushed the trade deal deadline off till AUG 1st providing some relief to the markets but, has also created more uncertainties with tariff letters that went out Friday.
Look for a negative news cycle sparking up Sunday night into Monday, potentially creating momentum downwards. However, I believe we stay in range of what HV10 weighted to IV implies -- $6,207.72 - $6,311.78. This range holds a divergence from IV of 5.29% and and price gap difference of -$17.32. To me, this says that what is short-term trending is 'contractive' to what IV states.
That's all for this week. Stay hedged against your bias always and remember to practice your ABCs -- If you like what you are reading and love volatility range analysis as much as i do -- feel free to drop me a comment and ill get back to you! Till next time, Cheers!

Polish zloty in trouble: Swiss franc is sharpening its teethTechnically, CHFPLN has completed a consolidation phase within a narrowing triangle and broke to the upside. The pair is now testing the 4.60 level (the 0.618 Fibonacci retracement) from below — a decisive zone. A breakout and confirmation above this area opens the path toward 4.705, which coincides with the 0.5 Fibo level and a local resistance. A pullback from that zone back to 4.60 is possible, but this time as a support retest. If the level holds, the targets remain: 4.91 and 5.13 - both marked by Fibonacci extensions and major long-term horizontal resistance. The EMAs are aligned in support of further upside, with price consistently trading above them.
Fundamentally, the Swiss franc remains a safe-haven currency, especially amidst increasing instability in the Eurozone. Weak growth in Germany, looming ECB policy easing, and rising inflationary pressures are all tilting investor interest toward CHF. Meanwhile, Poland faces political uncertainty, budgetary debates, and volatility in the agricultural and energy sectors. All of this strengthens the case for the franc in this pair.
Tactically, the game plan is straightforward: a confirmed breakout above 4.60 signals the start of a bullish impulse. The 4.60–4.705 zone is the key area of interest for buyers. If this zone is reclaimed and held, the next targets - 4.91 and 5.13 - remain valid, where large players may look to take profits.
If this scenario plays out, the zloty may soon be tuning into Polish radio to sing nostalgic songs about the golden days of its strength.

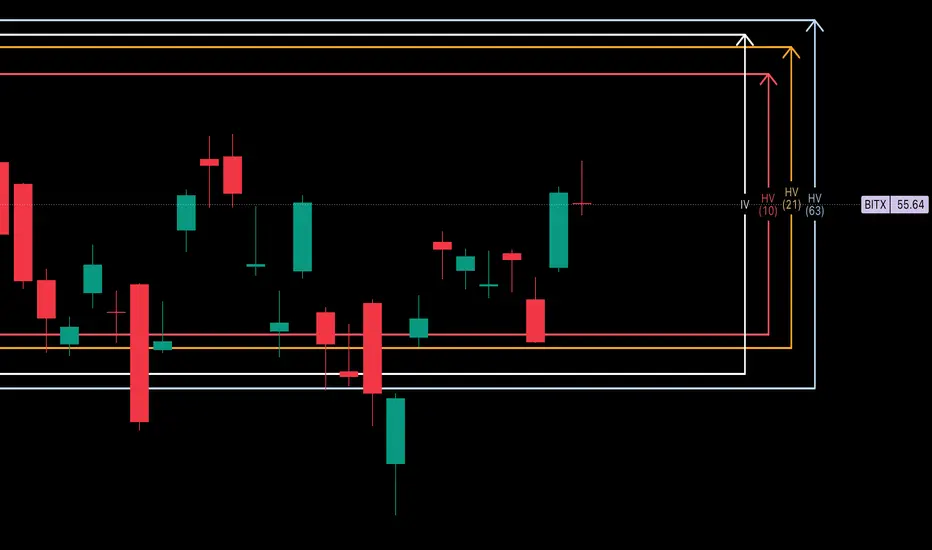
BITx -- Weekly Volatility SnapshotHello Bitcoin community 🤠👾🤑👾🤠
Good morning/Good afternoon, maybe goodnight to you pending where you are in the world!
Nonetheless, I'm glad you found me because here we are going to look over our weekly historical volatility ranges on CBOE:BITX and assess where IV is in perspective to what's trending. Then we will talk targets within my custom adjusted implied weekly ranges.
Entering the week, IV (76.86%) is projecting +17.74% more than what short-term trending markets are showing with HV10 (59.12%) holding a 'strength of IV' of only 76.91%. This is a price differential on the week of -$1.19. Our monthly values with HV21 (71.20%) are hinged slightly below IV, showing a 'strength of IV' slightly more at 92.64%.
In my opinion looking towards this week, IV may be painting the bigger picture of price distribution upwards towards quarterly trends. It is expansive from past weeks and above short-term trending markets with a wider range and with IV percentile slowly creeping up.
If the trend holds that started last week, my price target will be HV63 at $61.07 which draws confluence with the correction impulse wave top of $60.39 -- a price action to implied calculation difference of only +/-$0.69. Fantastic , right?!? This would take BTC approaching new ATHs again. If price action can find quarterly trends we will be seeing a 'strength of IV' of 108.44% -- only slight advantageous over IV premium.
In the end, markets are unpredictably wild and we can only assess and reduce our risk using the tools provided. Always remember your ABCs and to hedge your bias! Come back next week as we recap how the weekly volatility unfolded.
Cheers!
AAPL - Weekly HV/IV PerspectiveGood evening —
I wanted to do one more write up with that being on NASDAQ:AAPL as we enter the week with futures just opening.
HV10 (16.58%) is trending -11.56% below IV (28.14%) showing a weekly price gap differential of -$2.89 on the stated implied move to what trending markets are doing. This current IV value entering the week sits 69% within the sliding year spectrum.
Now, with Apple consolidating in range for almost eight weeks after selling off when it reached its 4T milestone in December of 2024, has now begun advancing back upwards in price. The strength here is obvious and the quality of company is well, Apple.
My price targets on the week is first the upper band of stated IV ($220.58) then moving on towards the upper implied range of HV63 ($225.87). I believe the markets are going to push apple higher while balancing the indices out selling off in other areas. This would start to accelerate HV10, as it is now 91.23% coiled to its yearly lows and needs to unwind. Hopefully with a few short-term trending days increasing we find our regression.
Please come back next week and see how our position and volatility progressed forward.

Weekly Volatility SnapshotGood Evening -- Happy July 4th to everyone
Let us review last week as we look towards the next in anticipation of the trade deal deadline that looms. I had a target on the SP:SPX of $6,253.59 and the weekly high was $6,284.65. The candle on the short week opened at its low of $6,019.21 and closed $6,233.08 making the weekly range +$213.87. This represents closest to HV63 over IV which stated +/-$253.26 and a 'strength of IV' that was 295% . Again the weekly high is above our range target, but my volatility will always be measured close-to-close.
Now as we look towards this week --
IV (13.85%) has shifted upwards slightly with HV10 (7.36%) hinged down and still lowering. In fact, I have bi-weekly volatility as 97.28% 'coiled' to it's sliding yearly low of 4.64% -- HV21 (9.92%) is closer to what IV states with it being 'coiled' 96.61% to it's respective sliding yearly lows.
In my opinion, volatility still has room to consolidate slightly as markets rotate higher. I think we can see upwards $6,327.73, but slowly over the course of the week with the last tariff uncertainty getting out of the way. From there, going into mid July we may need to see a volatility spike. The HV10 range I am watching holds a 'strength of IV' entering this week of only 53% -- this shows the price per move is expensive by almost twice as much.
Till next time, know your ABCs, have a great long weekend, and stay hedge!
CHEERS

Weekly Volatility SnapshotGood Morning -- ☀️☀️☀️
What an amazing last full week of June that was as we pulled out of corrective territory and onto new ATHs with the SP:SPX body of its weekly candle moving +3.41% -- bottom to top. The weekly move open-to-close was +$98.40 as that is how I gauge my volatility metrics. This in comparison is closest in value to IV entering the week as it was stating an implied move of +/-$102.08, which was a volatility read of 16.34% -- As you see in reflection of the weekly chart below and within daily candle structure, price action moved upwards all week surpassing quarterly marks. This in turn is raising short-term volatility and lowering monthly averages as we rotate higher.
Here is the weekly price action of the TVC:VIX from a 5m perspective. This is showing the EOW trend break upwards drilling the indices back down -- A healthy pullback after being seemingly over-extended. This happened during the news cycle release of the U.S. and Canada reciprocal tariff disagreement. Hopefully this settles over the weekend and we rotate higher into the 4th of July week.
Now looking towards this holiday week -- We have the SP:SPX IV (13.29%) after melting during the ATHs move previously -3.09% -- This places IV on the sliding yearly spectrum at the 39% down range showing increasing discount in yearly value. Remember, If you form option positions IV affects VEGA 1% at a time and the algos bid down IV in contracting markets as they rotate higher. HV10 (12.46%) has hinged down and still is contractive per IV prediction but, increasing in comparison with a ' strength of IV ' now showing 94% entering this week.
As the TVC:VIX has closed at $16.32 -- I believe that there is still a little room to extend potentially upwards to the HV10 weekly range of $6253.59. Currently, the SP:SPX YTD return is +4.96% with weekly momentum pointing up and room for volatility to still decrease. If this mark is reached it would put the YTD return at +6.52%. Very feasible and realistic being halfway through the year and going into the 4th of July 🇺🇸🇺🇸🇺🇸🇺🇸 Watch as we climb the wall of worries around us. This would in turn decrease short-term volatility more maybe even to a bottoming point and IV would melt during the rotation upwards with the VIX slowly grinding down.
Come back next week as we review what happened within the implied ranges posted and overlook the volatility potentially bottoming and looking towards a VIX spike in the near future.
Remember to know your ABCs and stay hedged against your bias! CHEERS!

Weekly Volatility SnapshotGood Morning --
I hope everyone had a good week of trading ranges -- although short, we saw some VOLATILITY .
Here we will step back with the year-to-date TVC:VIX in the background as we look towards a fresh week trading within the broader market ranges.
Let us begin --
Last week the S&P500 -- with the SP:SPX gapped up opening into strength of a short week at $6,007.46 and wicking up to $6,050.83 only to sell off during U.S. wartime engagement threats within the news cycle, closing the weeks range at $5,984.57. This provided a move of $96.96 and is most comparative to what IV (16.18%) stated entering last week -- that was predicting a range of +/- $101.24.
Now, looking towards this week -- IV (16.34%) is nearly unchanged as HV10 (9.75%) is showing a 'strength of IV' lowering at only 60% currently. IV within the yearly spectrum sits with an IVp of 74% -- fairly expensive as this can show the majority of money is spending up to protect downside uncertainties.
Understandable of course.
Our long-term trending volatility of HV63 (30.25%) is showing a 'strength of IV' at 185% which is correlating to an implied move of +/- $188.98 for the week. This is an advantage if reached of $86.90 over stated IV. A massive premium capture potential.
With the MACRO news cycle pointing EXTREMELY NEGATIVE, I will be watching for volatility expansion. I believe futures will open up gapping into quarterly marks -- this is just my humble opinion of course.
I see the opposite of last week happening, where we gap down and run up into the week. I don't hold a swing position, just an observation that psychologically retail will flip bearish on wartime news with a massive gap down, only to get trapped as broader markets expand upwards into the week.
That's all for now. Everyone have a good week trading ranges, and I will see you Saturday to review! As always, know you ABCs and stay hedged for whatever your bias may be!
CHEERS
