PLTR CAUTION!PLTR is at a key critical area, which has already given a warning shot to bulls.
We have a complete rising wedge structure with 3 waves up and a hook that has already cracked! Within it, we also have a head and shoulders at the top, which is bearish. (H&S not a top is usually a continuation pattern.) AS is always the case, if the overall market is not ready to head south, it will fail as a full-on reversal pattern.
I urge CAUTION!! to PLTR bulls.
For shorts, you need to see a crack, gap fill, plus follow through for a new lower low in a small time frame. You can't have a reversal without lower lows and lower highs.
Thank you ALL FOR getting me up to 5,000 followers!! ))
Click boost, follow, comment nicely for more authentic, no BS, raw analysis. Let's get to 6,000 followers. ))
PLTR

Salesforce Wins $5.6B Army Deal: AI & Strategic AnalysisAn in-depth analysis of Salesforce’s $5.6B U.S. Army contract and its multi-domain impact on CRM stock.
Geostrategy and Geopolitics: The Defense Pivot
Salesforce effectively entered the hard-power arena with its $5.6 billion U.S. Army contract. This move transcends typical software procurement. It signals a strategic alignment between Silicon Valley innovation and national security imperatives. The Pentagon, now emphasizing an "AI-first" warfighting stance, requires robust commercial partners. Salesforce’s "Missionforce" initiative directly addresses this geopolitical need. By securing this foothold, Salesforce mitigates risks associated with purely commercial market fluctuations. The deal positions the company as a critical infrastructure provider for the Department of Defense. This geopolitical integration offers a long-term hedge against global economic instability.
Business Models and Economics: The IDIQ Structure
Investors must scrutinize the "indefinite-delivery, indefinite-quantity" (IDIQ) nature of this agreement. While the $5.6 billion headline figure grabs attention, it represents a ceiling, not guaranteed revenue. The actual economic value depends entirely on the velocity of task orders. This business model shifts the focus from immediate bookings to long-term consumption utility. Analysts note a transition from buying software to "orchestrating outcomes at scale." Consequently, revenue recognition will likely trickle in rather than surge. This structure demands patience from shareholders expecting immediate quarterly spikes.
Technology and High-Tech Innovation: Agentic AI
The core value proposition lies in "Agentic AI." Salesforce aims to deploy autonomous agents that streamline logistics and decision-making. This technology leapfrogs traditional static dashboards. The Army contract specifically targets the unification of disparate data sources. By creating a "trusted data fabric," Salesforce lays the groundwork for advanced AI deployment. This focus aligns with the Pentagon’s broader GenAI.mil initiative. Success here proves that Salesforce’s AI tools work in high-stakes, chaotic environments.
Industry Trends and Competition
The government IT sector remains a crowded battlefield. Microsoft and Oracle traditionally dominate this space, while Palantir commands the data analytics niche. Salesforce’s entry disrupts this oligopoly. The contract validates Salesforce’s ability to compete for massive federal allocations. It challenges the assumption that CRM tools lack the robustness for defense applications. This trend suggests a blurring line between enterprise customer service tools and military-grade logistics. Salesforce is aggressively carving out market share from established defense contractors.
Management and Leadership: Strategic Alignment
Salesforce leadership executed a precise pivot toward the public sector. Kendall Collins, CEO of Missionforce, effectively operationalized this strategy. This leadership success highlights an adaptive corporate culture capable of navigating complex federal procurement. Furthermore, alignment with Defense Secretary Pete Hegseth’s "AI-first" vision demonstrates high-level strategic synergy. Peter Lington, VP for the Department of War business, emphasizes data as a "strategic asset." This coherent messaging between corporate executives and Pentagon leadership instills market confidence.
Cyber Security and Data Sovereignty
Security remains the linchpin of this deal. The Army requires absolute trust in its data before unleashing autonomous agents. Salesforce’s "Computable Insights" subsidiary addresses these specific security mandates. The emphasis on a "Modular Open-Source Approach" (MOSA) reduces vendor lock-in risks. It also forces Salesforce to prove its cybersecurity resilience constantly. Any breach would jeopardize not just the contract, but the company's entire federal reputation. Therefore, cybersecurity excellence acts as the primary gatekeeper for realizing the contract’s full value.
Macroeconomics and Market Sentiment
Salesforce shares ticked up 0.6% to $229.40 following the news. This muted reaction reflects investor caution regarding the macroeconomic environment. High interest rates continue to pressure tech valuations. Traders currently weigh the "hype" of AI against tangible book orders. The upcoming February 25 earnings report becomes the critical litmus test. The market demands proof that federal wins effectively counter broader economic slowdowns. Until then, the stock likely remains range-bound, waiting for concrete revenue data.
Patent Analysis and Science
The underlying science of this deal rests on data unification and API orchestration. Salesforce must leverage its intellectual property to connect legacy military systems. This requires advanced patent-protected methods for data ingestion and normalization. The "Golden Record" concept, a single source of truth, relies on sophisticated algorithmic reconciliation. Future patent filings will likely focus on "Agentic" behaviors and secure government cloud architectures. This intellectual property moat protects Salesforce from competitors seeking to clone its government-specific solutions.

Palantir - The short signal from the PitchforkPalantir is great for trading with the Alan Andrews Pitchfork.
Palantir follows the Pitchfork rulebook very accurately. This builds confidence, helps me stick to my trading plan, and ultimately leads to solid profits.
This time, Palantir gave me a new signal to the short side. Since I like to play this with LEAP options, I bought two ITM puts and sold one OTM put to harvest some theta if the market goes sideways.
A LEAP with a delta above 70 does not really lose much value if price goes sideways or drifts down.
From a psychological perspective, this structure is excellent for me. I know I have time in this trade, I can execute my plan, and my capital is not exposed to unnecessary risk.
A word about the 2:1 ratio:
The benefit of buying two options while selling only one is that it leaves the door open for larger profits. If price moves deep ITM on the sold put, there is still one long put that can continue to print money.
But what if price trades back into the pitchfork?
In that case, the sold put offsets part of the losses. With this mechanism in place, I can withstand a drawdown even longer.
So it is, in a way, the best of everything:
I get exposure to Palantir
I limit and hedge my risk partially
I have plenty of time with the LEAPs
I keep the door open for substantial profits
All in all, a good trade to pick up with a fork.
Happy weekend to you all and don't forget to check my Profile settings to the right.

Target 40% CAGR: 2026 High-Alpha PortfolioObjective: I’m targeting a 40% CAGR with this allocation. It’s an aggressive goal, but I believe it’s achievable by concentrating capital into "monopoly-moat" tech while using a structural hedge to buy the dips.
The Asset Mix:
Growth Engine (75%):
The AI Backbone: NVDA (20%) / AVGO (15%) / TSM (10%). Pure infrastructure play.
Software Scale: PLTR (10%) / MSFT (5%) / AMZN (5%). High-margin recurring revenue.
Disruptor: TSLA (10%). High-beta kicker for autonomy/robotics.
Capital Preservation (25%):
BRK.B (10%) / GLD (10%) / GS (5%). These are my "shock absorbers." They provide the liquidity and stability needed to survive volatility.
Execution Logic: By pairing high-beta assets with non-correlated hedges, I’m optimizing the Sharpe Ratio to ensure I can stay fully invested even during market corrections.
Management:
Quarterly Rebalancing: I will rebalance weights back to these targets every 90 days. This systematically forces me to sell overvalued winners and rotate into undervalued laggards.
Public Record: Logged on IBKR/OKX. Posting here for real-time transparency and accountability.

$PLTR Looking for Higher ATHNASDAQ:PLTR is forming a triangle and is forming a base off my algo level. Looking for a break above for a move higher.

Palantir - Inverse Head & ShouldersNot the prettiest I seen. But it could do 🧑🏻🚀 Would still have to break the neckline. But I think it could rally with the rest of the stockmarket.

PLTR: potential mid-term top formation Price have reached key mid-term resistance zone outlined in May idea:
As long as price remains below the Nov 3 highs, I’ll be operating under the main assumption that the mid-term top is in, anticipating more downside in the coming weeks and months.
A 1–3 day bounce to potentially close the gap could provide a good delayed-reaction short setup.
Chart:
Macro support ideal for this correction: 120–85.
Macro view:

I am bullish on Palantir (PLTR)I am bullish on Palantir - $PLTR.
This was the chart for my last Palantir publication, with all the key levels I marked out.
I already bought some with dollar cost averaging. I am buying at the CMP, and my target is $200 - $2007 and beyond.
What is your view on PLTR

PLTR |BullishNASDAQ:PLTR
Price is compressing under a descending trendline while holding higher lows — classic bullish compression / falling wedge behavior.
Key observations:
Structure: Market printed a sequence of HL → HH, confirming trend transition from corrective to impulsive.
Moving Averages : Price reclaimed and is holding above the mid-term MA, with short-term MA curling up — bullish momentum rebuilding.
Volatility : Keltner compression suggests energy storage, not distribution.
Volume Profile : Acceptance above the high-volume node confirms buyers defending value.
Context : Prior rejection was corrective, not impulsive — sellers failed to follow through.
Invalidation : Clean loss and acceptance below ~182–184 zone.
As long as this holds, bias remains long.
Upside targets:
First expansion toward 193–195
Breakout continuation opens path to 207+ (range high / prior ATH zone)
This is pressure building, not topping.
Resolution favors the upside.

Palantir Teases Bers at Resistance, Nasdaq Looks WeakDespite the fact that Santa's rally could see at least a temporary rise for the stock market, I still think the Nasdaq could be breaking to new cycle lows as we head into the new year. Palantir has also caught my eye for a potential short setup, given its bearish clues around resistance.
Matt Simpson, Market Analyst at City Index

$PLTR ShortInitially shorted
PLTR from 175s on 17th
Nov. Closed my position around 153 and bought back for a bounce around 155.
Medium term I am bearish on & PLTR, we can clearly see a failed high at around 209. If price wanted to stay bullish it should have consolidated or stayed above the previous high at around 189 but this to me is a trap price pushing above 189 and coming back down.
I have closed my longs here and will be looking for LH now, might even go to 185 around the 0.618 Flb level but nothing changes for me I will be looking for swing shorts.
Put this post earlier but it was restricted for some reason so posting it again now. Now the price has started to halt near the 0.618 level and we might get the down move now. Let’s see

PLTR growth ideaPotential targets market, trends automatically plotted using TrenVantage LITE indicator. Longer term PLTR has the geopolitical and socioeceonomic factors to succeed. IF AI is indeed a bubble only a few companies will survive and this with all of its government contracts surely will be one of those survivors. Upside target plotted with a retrace this target changes.

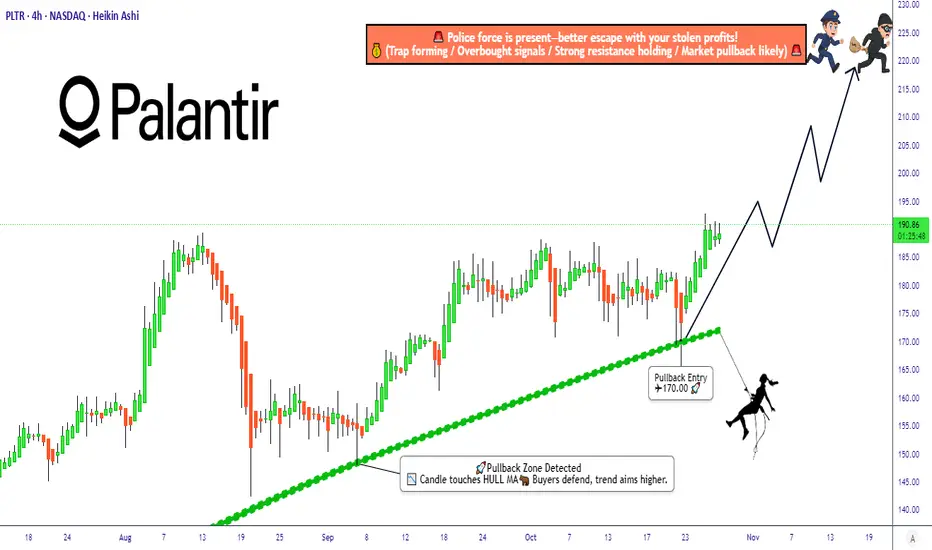
Palantir (PLTR) Bulls Preparing for Takeoff — Setup Explained💎 PALANTIR TECHNOLOGIES INC. (PLTR) — Swing Trade Profit Playbook 💎
Exchange: NASDAQ
Style: Swing Trade | Thief Layering Strategy | Bullish Pullback Setup
🧭 PLAN
We’re plotting a bullish pullback setup confirmed by the Hull Moving Average and a Heikin Ashi reversal doji — signaling that buyers are regaining strength and getting ready to dominate again. 💪📊
This setup thrives when the crowd is sleeping — that’s when the thief plans the perfect entry on discount zones! 🕶️💸
🎯 ENTRY STRATEGY — “THIEF LAYERING SYSTEM”
Instead of chasing green candles, this strategy stacks multiple buy limit layers to build position quietly and efficiently. Each layer grabs value from dip zones — just like a thief collecting gold coins on the way down! 🏴☠️💰
Layered Entry Plan:
🔹 1st Layer: $175 — early scout entry, feel the market reaction.
🔹 2nd Layer: $180 — main position loading zone near Hull MA support.
🔹 3rd Layer: $185 — continuation confirmation layer if trend holds.
🔹 4th Layer: $190 — momentum add-on for breakout confirmation.
👉 You can add more layers if volatility gives deeper discounts. Adjust according to your risk profile — precision is key, greed is optional! 🎯
🛑 STOP LOSS
This is the Thief SL at $165 — clean, disciplined, and below the recent structural support.
⚠️ Note to all Thief OG’s: This isn’t a fixed stop for everyone. Manage your own risk — move smart, stay stealthy. Every thief has their own escape route! 🏃♂️💨
💰 TARGET / TAKE PROFIT
Our main target is $220, where the “police force” (strong resistance) is waiting to trap late buyers. That’s our signal to escape with profits while the market gets noisy. 🚨💵
⚠️ Note: Don’t copy-paste my TP — adjust it based on your risk-reward ratio. The thief gets in, takes the bag, and disappears like smoke! 😎💨
🌐 CORRELATIONS & RELATED PAIRS TO WATCH
While executing this PLTR play, keep an eye on related movers:
💡 NYSE:AI (C3.ai): another AI data stock — often mirrors PLTR’s momentum.
⚙️ NASDAQ:NVDA (NVIDIA): strong leader in AI space; when NVDA rallies, PLTR usually follows.
📊 NASDAQ:QQQ (NASDAQ ETF): overall tech sentiment indicator — if QQQ pulls back, expect PLTR sympathy moves.
🧠 NASDAQ:META , NASDAQ:GOOG : big-data and AI-driven plays that set tone for broader sector trends.
Key Insight: When NASDAQ:QQQ or NASDAQ:NVDA show continuation strength, PLTR tends to respond aggressively due to its higher volatility factor. A synchronized move could amplify this setup’s reward potential! 💥📈
⚙️ MARKET CONTEXT
Palantir continues to benefit from the AI and defense analytics boom, showing stronger fundamentals and recurring government contracts. The chart recently cooled off, forming a healthy reaccumulation base, ideal for swing traders planning layered re-entries before the next push to $220+. ⚔️📊
🕶️ DISCLAIMER (READ BEFORE HEISTING)
This is a Thief-Style Trading Strategy — meant for fun and education.
Trade smart, manage your capital, and always protect your loot! 🧠💼
✨ “If you find value in my analysis, a 👍 and 🚀 boost is much appreciated — it helps me share more setups with the community!”
#PLTR #Palantir #SwingTrade #ThiefStrategy #StockMarket #AI #BullishSetup #TechnicalAnalysis #HullMA #HeikinAshi #RiskManagement #NASDAQ #ProfitPlaybook
I don't own enough!I don't own enough of NYSE:ZETA even with my massive 15-20% holding across my investment portfolios and leaps galore.
The fundamentals scream buy anything under $25-$30, while the stock sits at sub-$20.
P/S less than 3, DCF model spitting out massive Margin of Safety based on conservative projections, and they are about to report their first GAAP profitable quarter.
Never mind the chart that looks ready to have a blow-off top moment, friends absolutely.
Cup and Handle is ready to send us to new ATHs in 2026, from the looks of it.
This is a top-2 position for me, and I've personally met and interviewed the CEO, but I have no ties to the business beyond being a retail shareholder.
So take what I say as you may, and always DYOR, friends.
Not Financial Advice.
God bless!

$PLTR | COVERAGE INITIATED — Personal Position Update [W49]COVERAGE INITIATED — Bullish Classification (Trend Shift Identified)
PLTR — WEEK 49 TREND REPORT | 12/05/2025
Ticker: NASDAQ:PLTR
Timeframe: W
This is a reactive structural classification based on the weekly chart as of this timestamp. Price conditions are evaluated as they stand — nothing here is predictive or forward-assumptive.
⸻
Author’s Note — Personal Position Update
I initiated my own position on [ NASDAQ:PLTR ] during Week [ 49 ], entering at $ [ 181.76 ].
This decision follows my personal criteria: I only participate when my system identifies a verified structural trend shift supported by both a confirmed weekly flag and a qualifying candle state. This note reflects my activity only and is not a suggestion for anyone else.
As of this update, my position is currently up ~ [ 0% ] from my entry.
My structural exit level is $ [ 177.54 ] on a weekly-close basis. This level will continue to adjust upward automatically as the structure strengthens. If price closes below that threshold, my system classifies the trend as structurally compromised, and that is where I personally exit.
This update exists solely to document my own participation and the structural levels I monitor. It is not predictive and does not imply any future outcome.
⸻
Structural Integrity
• 1) Current Trend Condition [ Numbers to Watch ]
• Current Price @ $
• Trend Duration @ +0 Weeks
( Bullish )
• Trend Reversal Level ( Bearish ) @ $
• Trend Reversal Level ( Bearish Confirmation ) @ $
• Pullback Retracement @ $
• Correction Support @ $
⸻
2) Structure Health
• Retracement Phase:
Uptrend (operating above 78.6%)
• Position Status:
Healthy (price above both structural layers)
⸻
3) Temperature :
Neutral Phase
⸻
4) Momentum :
Bullish
⸻
Structural Alignment
NEUTRAL STRUCTURAL CONDITION
This mark represents a period where directional behavior was unclear. Market movement here reflected compression, chop, or indecision — neither trend direction was dominant. It does not signal continuation or reversal, only that price action was not showing strong alignment in either direction.
⸻
Methodology Overview
This classification framework evaluates directional conditions using internal trend-interpretation logic that references price behavior relative to its structural layers. These relationships are used to identify when price movement aligns with the framework’s criteria for directional phases, transition points, or regime shifts. Visual elements or structural labels reflect these internal interpretations, rather than explicit trading signals or preset indicator crossovers. This framework is observational only and does not imply future outcomes.

PLTR — [2D] WEEK 49 TREND REPORT | 12/04/2025PLTR — WEEK 49 TREND REPORT | 12/04/2025
Ticker: NASDAQ:PLTR
Timeframe: 2D
This is a reactive structural classification of PLTR based on the weekly chart as of this timestamp. Price conditions are evaluated as they stand — nothing here is predictive or forward-assumptive.
⸻
1) Current Trend Condition [ Numbers to Watch ]
Current Price @ 178$
• Trend Duration @ +546 Days ( Bullish )
• Trend Reversal Level ( Bullish ) @ 177.54
• Trend Reversal Level ( Bearish Confirmation ) @ 166.16
• Pullback Support @ 133.47
⸻
2) Structure Health
• Retracement Phase:
Uptrend (operating above 78.6%)
• Position Status:
Healthy (price above both structural layers)
⸻
3) Temperature :
Neutral Phase
⸻
4) Momentum :
Bullish
⸻
Author’s Note
NEUTRAL STRUCTURAL CONDITION
This mark represents a period where directional behavior was unclear. Market movement here reflected compression, chop, or indecision — neither trend direction was dominant. It does not signal continuation or reversal, only that price action was not showing strong alignment in either direction.
⸻
Methodology Overview
This classification framework evaluates directional conditions using internal trend-interpretation logic that references price behavior relative to its structural layers. These relationships are used to identify when price movement aligns with the framework’s criteria for directional phases, transition points, or regime shifts. Visual elements or structural labels reflect these internal interpretations, rather than explicit trading signals or preset indicator crossovers. This framework is observational only and does not imply future outcomes.

$PLTRPalantir Technologies Inc. (NYSE: PLTR) presents a compelling case for a cautiously bullish outlook following its rebound from November lows. For traders seeking to capitalize on potential stability or upside while managing defined risk, a bull put spread strategy offers a structured approach.
Market Context and Trade Rationale
Palantir stock has demonstrated resilience, bouncing off its lows from November and establishing a more constructive technical posture. This stabilization makes it a candidate for strategies that benefit from sideways or upward price movement. The bull put spread is particularly suited for this environment, as it allows traders to generate income from option premium while capping maximum risk—a prudent setup in a market that, while showing strength, may still face volatility.
The Bull Put Spread: Structure and Mechanics
A bull put spread is a defined-risk options strategy implemented by simultaneously:
Selling a put option with a higher strike price (the short put).
Buying a put option with a lower strike price (the long put).
Both options share the same expiration date. The goal is for the stock price to remain above the higher strike at expiration, allowing both puts to expire worthless. The trader keeps the net premium received upfront as profit.
Proposed Trade Setup for Palantir (PLTR)
For traders with a view that Palantir will maintain its footing above the $155 level over the coming weeks, the following trade presents an opportunity:
Action: Sell the January 16 expiration 155-150 bull put spread.
Credit Received: Approximately $1.10 per share, or $110 per contract spread.
Maximum Potential Profit: The full $110 premium received. This represents a return of roughly 28% on the capital at risk over the six-week period, contingent on PLTR closing above $155 at expiration.
Maximum Risk: Limited and predefined. It is calculated as the difference between the strike prices ($155 - $150 = $5), minus the premium received ($1.10). Therefore, the maximum loss per spread is $3.90, or $390 per contract. This worst-case scenario would only occur if PLTR stock closes below $150 on the January 16 expiration.
Break-Even Point: $153.90. This is calculated by subtracting the premium received from the short put's strike price ($155 - $1.10). The trade remains profitable at expiration as long as PLTR closes above this level.
Risk Management - Stop Loss: To protect against a sudden downturn, it is prudent to implement a stop-loss order. An effective rule is to exit the spread position if its market value doubles from the initial credit received—for example, if the spread's price increases from $1.10 to $2.20. Alternatively, a technical stop based on the underlying stock breaking below a key support level, such as $160, can serve as an early warning to manage risk and prevent larger losses.
Broader Technical Framework for PLTR Stock
Beyond this specific options trade, the broader technical landscape for Palantir highlights key levels for swing traders and long-term investors:
Critical Support: A major support zone is established near $120. This level is viewed as a foundational floor for the stock's longer-term bullish structure.
Strategic Buy Zone: For those looking to establish or add to equity positions, the area around $200 is considered a compelling buy zone, potentially offering a favorable risk/reward entry on pullbacks.
Primary Take-Profit Target: The next significant resistance and profit-taking target for a bullish move is projected at the $240 level.
Conclusion
In summary, Palantir's recovery from its November lows opens the door for strategic bullish plays. The proposed 155-150 bull put spread for January 16 expiration provides a method to potentially earn a 28% return with controlled, predefined risk, based on the thesis that PLTR will remain above $155. This tactical trade exists within a wider technical framework that identifies $120 as solid support, $200 as a strategic accumulation area, and $240 as a primary upside objective. As with all options strategies, position sizing and adherence to stop-loss disciplines are essential for managing capital effectively.

Short PalantirTrading Fam,
This will be only the second short I have taken since implementing my new indicator. We are up 250%+ pending exits in just over a year; however, during that time, I have taken long entries only. Now, it's time to test accuracy on the short side.
On my NASDAQ:TSLA short (my first ever short entry), we are already comfortably in profits. More to come on that.
As far as NASDAQ:PLTR goes, my signal gave me a SELL at $195. As I have been in the habit of waiting for confirmation, I did not enter immediately. Yesterday and today, I believe I have been given the chance for a decent entry. I've entered short at a price of $190 and will shoot for that 200-day SMA at somewhere around $145 for a 2.37 rrr.
Let's see how this goes.
✌️Stew

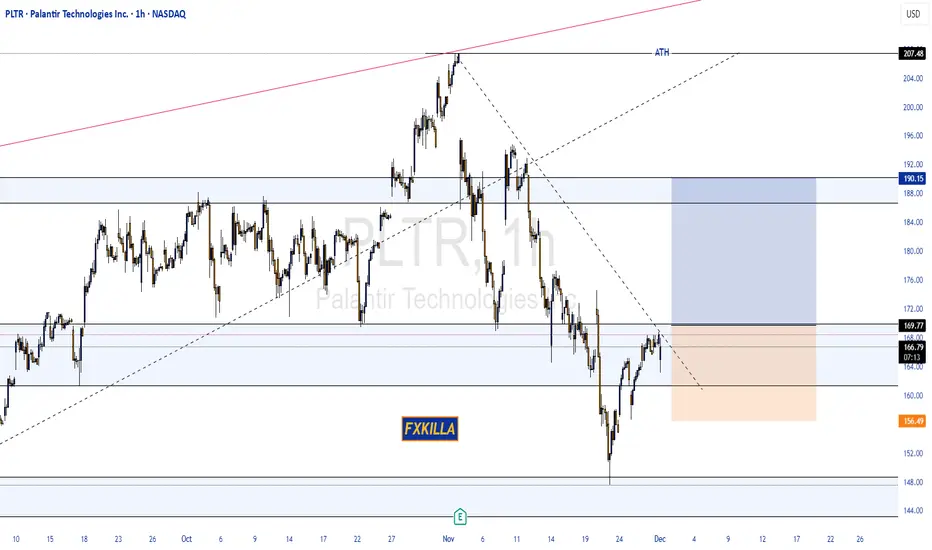
PALANTIR HIGH PROBABILITY BUY SETUP SOON!!!🚨 PALANTIR HIGH PROBABILITY BUY SETUP 🚨
* Here We Can See Clearly The Next Potential Moves For PLTR Coming Hours/Days.
* Keep Your Eyes Close On Your Trading Positions.
* Happy PIP Hunting Traders.
FXKILLA.
PLTR to $150: Overvaluation, AI Hype, Slowing Government Growth If you haven`t bought PLTR at $16:
Palantir has become one of the most crowded trades of the AI boom. While the company is strong fundamentally, the stock price has detached from reality. A move toward $150 (post-split) is not only reasonable — it is structurally likely.
1. Extreme Valuation — PLTR Trades Like a Hyper-Growth AI Leader, But Growth Is Slowing
Palantir’s current valuation assumes:
accelerating revenue growth
massive enterprise AI adoption
long-term dominance in the AI/defense space
But real numbers tell a different story:
government revenue growth has slowed
commercial AI revenue is not scaling as fast as expected
current valuation implies “perfection”
PLTR is priced like Nvidia, but grows closer to a legacy enterprise software company.
That gap must eventually close.
2. Government Contracts Are Growing Much Slower Than Expected
Historically, the Gov segment was Palantir’s growth engine. Now:
U.S. federal agencies face budget constraints
large DoD and DHS contracts are delayed or split among competitors
players like Anduril, C3.ai, and smaller defense tech shops are taking share
geopolitical spending doesn’t translate directly into PLTR revenue
Slowing government growth is a major red flag, because it removes the company’s most stable source of revenue.
3. AI Hype in the Commercial Segment Is Not Converting Into Real Revenue (Yet)
Most of the excitement around PLTR in 2024–2025 comes from:
AIP (Artificial Intelligence Platform)
enterprise copilots
generative AI tools
predictive modeling engines
But the commercial AI pipeline suffers from:
too many POCs (proof-of-concepts)
long implementation timelines (6–24 months)
high customer acquisition costs
conservative corporate spending
The hype is real.
The revenue, not so much.
4. Heavy Insider Selling — A Consistent Bearish Signal
Top insiders have repeatedly sold shares into every major rally:
Alex Karp (CEO)
Shyam Sankar (COO)
multiple VPs and directors
Notice what’s missing:
large insider buying.
Insiders consistently cash out when retail enthusiasm peaks, which historically precedes corrections.
Macro Risk: If AI Capex Slows, PLTR Gets Hit Harder Than NVDA
PLTR is far more sensitive to an AI spending slowdown than hardware leaders like Nvidia, which still enjoy massive chip demand.

Palantir - A devastating -40% drop!🤬Palantir ( NASDAQ:PLTR ) will create a major correction:
🔎Analysis summary:
After a textbook bullish break and retest in mid 2024, we witnessed a parabolic rally on Palantir. During the entire rally, we only witnessed one red candle, which clearly shows some significant overextension. Therefore, Palantir will create a major correction now.
📝Levels to watch:
$200 and $100
Phil - @SwingTraderPhilTV
SwingTrading.Simplified. | Investing.Simplified. | #LONGTERMVISION

PLTR long-term TAPalantir is a massive beast, this stock has a very strong uptrend on weekly time frame and it's far from done yet, currently there's a countertrend correction in the process and the distribution on mid-term but as for the long-term it has lots of resources left to continue the uptrend rally after the correction. Watch for the blue line and SMA50 to hold the support.

PALANTIR Is there time to reach $250 before Bear Cycle begins?Palantir (PLTR) has been trading within a multi-year Channel Up throughout this Bull Cycle, which despite the recent correction just above the 1W MA200 (orange trend-line), it still stands.
The last time in fact that we had a similar 1W MA200 approach on such a 1D RSI pattern (RSI reaching 34.00) was on January 05 2024. What followed was a 1-month rally to the 1.618 Fibonacci extension.
As a result, if the market delivers a strong 'Santa Rally', we may see Palantir peak at $250.00 before a Bear Cycle begins.
---
** Please LIKE 👍, FOLLOW ✅, SHARE 🙌 and COMMENT ✍ if you enjoy this idea! Also share your ideas and charts in the comments section below! This is best way to keep it relevant, support us, keep the content here free and allow the idea to reach as many people as possible. **
---
💸💸💸💸💸💸
👇 👇 👇 👇 👇 👇
