Global trend continuation on Philip Morris Int. (Ticker PMI)NYSE:PM
Fundamentals:
- recent yearly and quarterly reports of PMI were pretty nice due to the art of bussiness (comsumer staples) as well as specification of the product - tabak-related items, and we all know that whatever happens people will continue smoking. Their business with electronic cigarettes improves, erobers the market and brings revenue and earnings. And this is de-facto one of the main reasons why investors would hold money in the business and even buy more - because of reccuring dividends and more or less stable earnings. Even the current lower than expected earnings for Q4 of 2025 are completely overblown by positive 2026-2028 earnings expectation report. I personally saw new production factories the company builds near the existing company buildings in the country I am living in, and that only means that they have money and they have demand on their product which makes it reasonable to continue expanding
- as the market sentiment remains unstable and is the reason for worries of most of traders, the consumer industry has historically played a role of a safe harbor for the times of instability and as regular cash flow during bullish times
- these factors do speak more for possible existence of further investors interest in the company, which may lead to further growth
- but dont forget that there are financial reports every 3 months, and situation can always change and smart money might decide to take out money from an asset which is definetly on its local or global highs
Technicals:
- the negative factor is the possible upside W-formatted double-top pattern on the global picture which in case of negative news can push the price down
- there are stop-losses directly above recent high in June 2025, so if price reaches that level a lot of short squeezes can be triggered
- in case of positive scenario and move forward I expect the price to retest the closest zone which has not yet acted as support
- but this will only happen if the further upward movement is weak
- if the price continues the upward movement straight from the place it is now (182.00-183.00) it can mean a strong trend continuation
- nevertheless if the "not-really-good-one support zone" does not hold the price at 173.00, a next target on 163.00 can be taken into account
Conclusion:
- due to market sentiment and technical upside W-formation it is recommended to follow the price action on Friday 6 Feb., but enter the trade on Monday 9 Feb.
- if price shows strengh and moves forward the recent high, I will look for medium-term trend continuation
- but in case there are no significant changes today on 6 Feb and bearish news over weakend, the short-term downside correction scenario to 173.00 or 163.00 will be taken under loop, but decission met on spot
- sometimes it is better to wait than to hurry
# - - - - -
WAIT UNTIL 9 February for decission
⚠️ Short-term Signal - Sell ⬇️
✅ Entry Point - Stop-limit on 182.00
🛑 SL - 187.24
🤑 Partial TP 50% - 171.36
🤑 Final TP 100% - 163.79
⚙️ Risk/Reward - 1 : 2 and 1 : 3.5👌
⌛️ Timeframe - 1 week 🗓
# - - - - -
Only if short trade succeeds
⚠️ Long-term Signal - Buy ⬆️
✅ Entry Point - 173.24
🛑 SL - 158.53
🤑 TP - 223.54
⚙️ Risk/Reward - 1 :3.44 👌
⌛️ Timeframe - 1 month 🗓
# - - - - -
Alternative HIGH RISK
⚠️ Long-term Signal - Buy ⬆️
✅ Entry Point - Stop-limit 184.80
🛑 SL - 17.34
🤑 TP - 223.54
⚙️ Risk/Reward - 1 : 2.9 👌
⌛️ Timeframe - 2 weeks 🗓
Good Luck! ☺️
# - - - - -
DISCLAIMER: Not financial advice. Everyone must make trading decisions at their own risk, guided only by their own criteria and strategy for opening or not opening a trade
PMI

EURUSD H4 Bearish CHOCH + BOS, Descending Channel Continuation 📝 Description
EURUSD on H4 has completed a clear CHOCH followed by BOS, confirming a shift into a bearish HTF framework. Price is now respecting a descending channel, with pullbacks failing below prior resistance and acceptance holding under key PD Arrays.
________________________________________
📈 Analysis (Scenario-Based | Non-Signal)
Primary Bias: Bearish within the channel
• Continuation favors a measured sell-off along the channel slope
• Pullbacks into H4 resistance / FVG are corrective, not impulsive
• Downside draw remains toward lower H4 liquidity (LQ/SSL) inside the channel
• Any bounce without acceptance above the channel top is viewed as sell-side opportunity
________________________________________
🎯 ICT & SMC Notes
• Confirmed CHOCH + BOS (H4) validates bearish structure
• H4 FVG overhead acting as dynamic supply
• Liquidity draw favors SSL below recent lows
________________________________________
🧩 Summary
Structure and geometry align for continued downside. As long as EURUSD trades below channel resistance, probability favors gradual bearish expansion toward lower liquidity pools rather than a reversal.
________________________________________
🌍 Fundamental Notes / Sentiment
With USD strength increasing such as ISM and Unemployment Rate, and no clear catalysts for EUR, macro flow supports a bearish continuation. This backdrop reinforces the expectation of downside movement within the drawn channel, barring a sudden shift in USD momentum or euro-specific catalysts.
________________________________________
⚠️ Risk Disclosure
Trading involves substantial risk and may result in capital loss. This analysis is for educational purposes only and does not constitute financial advice. Always apply proper risk management, predefined stop-loss levels, and disciplined position sizing aligned with your trading plan.

How To Make Macroeconomics Work For YouIntroduction
Trading around news releases is a powerful tool in financial markets.
The ability to identify the direction of the economy and understand market behavior is a skill that requires patience and extensive practice. In this post, we break down the theory behind trading macroeconomic releases and systematically explain how to form a structured view of the market.
Actual vs. Consensus
In almost any economic calendar, you will see a consensus / forecast column. To properly understand released macroeconomic data, it is not enough to simply look at the headline number. The key to interpretation lies in comparing the actual result with the consensus forecast.
This deviation — often referred to as a “surprise” — is the primary driver of volatility in financial markets.
The reason is that the market is a forward-discounting machine. By the time a report is released, asset prices already reflect the prevailing consensus expectations. The market has priced in a specific scenario. When the actual data comes in above or below those expectations, an immediate repricing occurs — the market reassesses future growth, inflation, and central bank policy paths, adjusting prices to reflect the new information.
Therefore, at the moment of the release, the market is not reacting to the number itself, but rather correcting a previously held — and potentially incorrect — expectation. It is this collective and instantaneous adjustment that creates the surge in volatility we observe around economic data releases.
Trend
Trend is the alpha and omega of analysis — the foundation upon which most trading systems are built. This principle fully applies to macroeconomics as well: to correctly interpret a single data release, one must clearly understand the trend in which the economy, or a specific sector, currently operates.
Yes, a trend on its own rarely generates the same explosive volatility as an unexpected deviation from consensus. However, its role is far more fundamental: the trend is what shapes the consensus itself. The dynamics of previous months define the baseline for analysts’ forecasts and market expectations.
Without accounting for the trend, an individual macro indicator becomes just a number in a vacuum. It may point to completely opposite scenarios depending on interpretation. Data must be evaluated in context and over time. A sector may be performing below its long-term averages, but consistent improvement over recent quarters can be a clear signal that central bank policy is having a positive effect. Conversely, a peak reading within a broader downtrend is far more likely to be a statistical anomaly than a genuine turning point.
Historical data serves as a compass for central banks. By understanding what is “normal” for a given sector, policymakers can interpret readings that break away from the trend not as noise, but as structural shifts — a “slowdown in growth” or a “fundamental change in trend.” This is the power of trend analysis: it separates signal from noise, transforming raw data into a coherent picture of the economic cycle.
Context
Accurately understanding the macroeconomic landscape and anticipating market reactions is only possible when data is viewed collectively, not in isolation. Financial markets are complex, interconnected systems, where developments in one sector inevitably ripple through others.
Labor market data directly shape inflation expectations. Central bank decisions and forward guidance impose structural constraints, defining not only the current phase of the cycle but also future conditions across the entire spectrum of assets.
Equally important is the global political and geo-economic backdrop. These forces either introduce a risk premium, increasing volatility, or reduce uncertainty, making outcomes more predictable.
Together, all of this forms the context — the interpretive framework in which numbers exist. Without it, even the most significant deviation from forecast is nothing more than a statistical outlier. Context turns fragmented data into a coherent narrative, allowing us to understand what is truly happening in the economy and where capital is flowing.
The ability to identify this context is the core skill that translates the language of macroeconomic statistics into the language of real market movements.
Federal Reserve Policy
We have reached the key element that determines the development of both individual sectors and the financial market as a whole. Central bank policy is the primary force that sets the rhythm of market movements. Most forecasts and trading strategies ultimately boil down to an attempt to anticipate the regulator’s next steps.
When analyzing a new set of data, the first question we ask is:
what does this mean for the Federal Reserve? What actions will the regulator take to stabilize conditions or support positive momentum?
To do this, the central bank has a set of fine-tuning tools at its disposal. By understanding how each of them works, one can form well-reasoned assumptions about the future direction of financial markets. The central bank’s toolkit includes:
• the policy interest rate
• the interest rate on reserves
• forward guidance
• balance sheet operations
• open market operations
• direct lending facilities
All of these are important, but the central role belongs to the policy rate — the Federal Funds Rate (FFR).
The policy rate is the central bank’s main interest rate. It defines the base cost of money in the financial system and serves as the primary benchmark for all other interest rates in the economy. By adjusting it, the central bank directly influences inflation and economic activity.
Accommodative stance (rate cuts):
The central bank lowers borrowing costs for businesses and households. This expands the money supply and stimulates demand, supporting economic growth, but it also creates inflation risks and may put downward pressure on the national currency.
Restrictive stance (rate hikes):
The central bank makes borrowing more expensive. This cools demand, slows economic activity, and restrains inflationary pressure. In such an environment, the cost of money in the economy rises, often leading to a strengthening of the national currency.
Thus, by monitoring the Fed’s rate decisions, we gain insight not only into the current diagnosis of the economy, but also a clear signal of the environment — accommodative or restrictive — in which all markets will operate in the near future.
Which Data Actually Move the Market?
Having mastered the basic principles of macro analysis, we move on to practice. Now, when looking at an economic calendar, we no longer see just a list of events — we understand their meaning and can anticipate market reactions. To do this, indicators must be grouped by the type of information they provide about the state of the economy.
1. Inflation Indicators
CPI (Consumer Price Index) and especially Core CPI are the primary measures of consumer inflation and directly influence central bank decisions.
2. Labor Market Data
• NFP (Nonfarm Payrolls) and the Unemployment Rate (UR) are key indicators of labor market health.
• AHE (Average Hourly Earnings) reflects wage-driven inflationary pressure.
• JOLTS (Job Openings, Quits) are leading indicators of labor demand and worker confidence.
• Jobless Claims provide a weekly “pulse check” of the labor market.
3. Consumer Demand Indicator
Retail Sales are the main barometer of consumers’ willingness to spend and a key component of GDP.
4. Leading Indicators
PMI (Purchasing Managers’ Index) from ISM and S&P Global is the most important monthly leading indicator, capturing sentiment and the pace of change in the real economy (manufacturing and services).
Beyond these indicators, there are many other important metrics (industrial production, consumer confidence, housing data). However, we focus on the primary market movers — the releases that generate the most volatility and most often reshape the market narrative. Understanding these four categories provides the key to decoding the majority of price movements driven by macroeconomic news.
Inflation Indicators (CPI and Core CPI)
These indices track changes in the cost of living. Imagine a basket that contains everything a typical household buys: food, gasoline, housing costs, clothing, and medical services.
The headline Consumer Price Index looks at this entire basket. However, prices for certain items — such as gasoline or vegetables — can swing sharply due to weather conditions or political decisions. These swings create a lot of noise and make it harder to see the underlying trend.
That is why analysts and central banks focus primarily on core inflation. It is the same index, but with the most volatile components — food and energy — removed. What remains are prices that move more slowly but persistently: rent, childcare, repair services, and healthcare.
If core inflation is rising, it means the foundation of everyday life is becoming more expensive. The cause is usually an overheated economy — when consumers have ample money and are willing to pay more, while businesses face rising costs, often driven by higher wages. This type of inflation is sticky and difficult to contain. That is precisely why central banks react to core inflation when deciding whether to raise interest rates.
If, on the other hand, only headline CPI rises due to a temporary spike in gasoline prices while core inflation remains stable, the central bank is unlikely to tighten policy — such moves are usually seen as transitory.
Labor Market Data (NFP, AHE, JOLTS, Jobless Claims)
The labor market is not a collection of isolated numbers, but a living system where some indicators lay the groundwork for others. To understand it, one must see the sequence and the cause-and-effect relationships.
The first warning signal usually comes from weekly jobless claims. When the number of people filing for unemployment benefits begins to rise consistently, it is a direct signal that companies are laying off workers more frequently. This is the earliest indication that, a few weeks later, the main monthly report may deliver unpleasant surprises: weak job growth or even outright job losses, followed by a rise in the unemployment rate.
However, the strength of the labor market is determined not only by the number of jobs, but also by their quality and the balance of power between employers and workers. This is where the JOLTS report on job openings and labor turnover becomes critical. When job openings are abundant and workers are quitting voluntarily in large numbers, it points to a unique situation: employees are confident enough to switch jobs in search of higher pay. This scenario almost inevitably leads to accelerated wage growth, which later shows up in the Average Hourly Earnings (AHE) data.
Wages are where the strongest link to central bank policy lies. Persistent wage growth acts as a powerful engine for inflation in the services sector. Therefore, when the Fed sees low unemployment combined with steadily rising wages, it has little choice but to keep interest rates high in order to cool the economy. Conversely, when job creation slows and wage growth begins to decelerate, it sends the regulator a long-awaited signal that labor-driven inflationary pressure is easing — opening the door to discussions about policy easing.
By closely monitoring weekly jobless claims and vacancy data, one can anticipate the likely outcome of the key monthly labor report and, with a high degree of confidence, predict how the central bank will react.
Consumer Demand Indicator (Retail Sales)
This is the most direct snapshot of household wallets. The index shows how much money consumers spent during the month on goods — in physical stores, online, at car dealerships, and at gas stations.
Its strength lies in its simplicity. It does not attempt to predict the future or measure sentiment — it simply records whether people are actually spending their money. And since household consumption is the main engine of the U.S. economy, this number is closely watched by everyone.
Retail Sales are highly sensitive to two factors: labor market conditions and Federal Reserve policy.
When jobs are plentiful and wages are rising (strong NFP and AHE), consumers spend with confidence — sales increase.
When the Fed raises rates, borrowing costs (including credit cards) rise, large purchases are postponed, and sales slow or decline.
As a result, Retail Sales often serve as the final confirmation — or refutation — of trends suggested by other data. Persistent growth in sales despite high interest rates tells the Fed that the economy remains too hot and that policy is not restrictive enough. A sudden drop, especially against the backdrop of an already weakening labor market, becomes a powerful argument for a pivot toward policy easing.
What to focus on in the data:
• The month-over-month change, with particular attention to the Control Group, which excludes the most volatile components (autos, gasoline, and building materials) and provides a cleaner view of core consumer activity.
Leading Indicator (PMI)
PMI is a leading indicator that captures turning points in the economic cycle.
It does not measure production volumes or revenues. Its purpose is to identify the moment when business activity is accelerating or beginning to contract. The index is based on surveys of executives who make daily decisions about purchasing, hiring, and investment. Their collective assessment of changes is one of the most sensitive barometers of demand dynamics.
The key is not the absolute level of the index, but its direction and internal components. A decline from 55 to 52 still signals expansion, but indicates a loss of momentum. A rise from 48 to 49 still reflects contraction, but points to a slowdown in the pace of decline.
For central banks, two PMI components are particularly critical:
• New Orders — the purest indicator of future demand. A decline here typically precedes reductions in production and investment.
• Prices Paid — a direct signal of inflationary pressure in supply chains and the services sector. Sustained increases in this component can prevent monetary policy easing, even if the headline index is slowing.
PMI functions as an early warning system. A sustained deterioration over several months often precedes slower GDP growth and weakening labor market data. Conversely, resilience at elevated levels — especially when price components are rising — serves as evidence for central banks that the economy is overheating and that a restrictive stance must be maintained.
Conclusion
You now have a solid theoretical foundation for interpreting news releases and the signals they send to the market. To truly understand this framework and apply it effectively in trading, consistent practice is essential. From my own experience, keeping a macro trading journal can be extremely helpful. Record how the market reacts under different conditions and gradually develop your own independent view of each situation.
Be especially cautious of market rumors — more often than not, such opinions are simply attempts to attract attention with sensational headlines rather than provide meaningful insight.
Enjoy!

ES (SPX, SPY) Analysis, PMI, Key Levels, Setups for Wed, Jan 14Overnight-to-NY Session Forecast: Market Consolidation with Bearish Sentiment
In the latest market outlook, a consolidation phase with a bearish tilt is anticipated (60% probability) as prices are expected to remain capped below the resistance levels of 7,000 to 7,014 during the Globex trading hours. This comes amid a risk-off sentiment observed as the market approaches the close. Traders should prepare for a trading range between 6,976 and 7,005 overnight, particularly aware of the potential for false breakouts typical of the thinner trading volumes in the Asian session. Pre-PPI positioning could keep prices compressed around the value area of 6,988 to 6,993 established yesterday.
Should the Producer Price Index (PPI) report come in soft either in-line with expectations or below 0.2% a rally towards the 7,014 to 7,024 range might be seen in the New York morning session. Conversely, if the PPI indicates rising prices, a move below 6,976 could target the equilibrium range of 6,954 to 6,960.
In a bullish scenario (25% probability), a soft PPI reading would bolster the disinflation narrative, potentially triggering a squeeze that pushes through the 7,000 mark, with upward momentum likely aimed at the 7,024 to 7,040 zone. For this to materialize, a sustained bid above the volume-weighted average price (VWAP) of 6,998 and a breach of the overnight high will be crucial. Traders should look for a cumulative volume delta (CVD) divergence as confirmation, where prices make higher lows while the CVD registers higher highs.
On the other hand, the bearish scenario (15% probability) could develop with a hot PPI release or heightened geopolitical tensions, such as a response to Iran’s tariffs. A break below 6,976 would pave the way towards the 6,954 to 6,960 range, with further bearish pressure potentially targeting the 6,911 price level if the equilibrium fails to hold. This scenario may gain traction, especially if the Nasdaq leads the downturn, reflecting the broader tech sector's sensitivities to changing rate expectations.

EURGBP: Possible reaction to the PMI for the next week.Hello Traders,
Reactions to the HTF-Strong resistance is a sign of more bearish moves.
Any touches with the De-valuations line means cancelation of the analysis.
Breaking below the 0.86660 will activate the setup.
Any activation before the red vertical line is invalid.

EURJPY | MarketoutlookThe policy divergence between the US Fed and SNB supports the pair at lower levels.
Jobless claims dropped to 227,000 for the week ending October 19, down from 242,000 the week before, suggesting some stability in the labor market. The four-week moving average rose by 6,750, reaching 231,000, which indicates that jobless claims are still showing fluctuations despite the recent decline.
The S&P Global Flash U.S. Manufacturing PMI increased slightly to 47.8 in October, up from 47.3 in September. However, this still shows that manufacturing activity is contracting for the fourth month in a row. On the other hand, the Flash Services PMI rose to 51.5, indicating modest growth in the services sector, which is important since it makes up a large part of the U.S. economy.

BTC: Bullish range below 114,472, 111,809 remains key__________________________________________________________________________________
Market Overview
__________________________________________________________________________________
BTC is holding a constructive 110k–115k range after rejection below 117k, with buyers defending 111,809 and supply capping under 114,472–116,217. The HTF trend remains intact, but breakouts need volume confirmation.
Momentum: 📈 Bullish-in-range — building above 111,809, but capped until 114,472 breaks.
Key levels:
- Resistances (4H/12H): 114,472; 116,217–117,966; 124,278 (W).
- Supports (4H/1D): 111,809; 110,000; 107,286–107,299 (1D).
Volumes: Very high on 1H/30m (pivot validation), normal on 1D — acts as a breakout catalyst.
Multi-timeframe signals: 1D/12H trend up; 6H/4H “neutral buy” below 114,472; 2H/1H recovering; 30m/15m impulsive but close to resistance.
Risk On / Risk Off Indicator: NEUTRAL BUY (STRONG BUY on 15m) → moderate long bias, consistent with momentum while 111,809 holds.
__________________________________________________________________________________
Trading Playbook
__________________________________________________________________________________
Strategy context: HTF trend is bullish, range in play; favor tactical longs while 111,809 holds and fade clean rejections below 116,217.
Global bias: NEUTRAL BUY above 111,809; invalidation if daily close < 111,809.
Opportunities:
- Range long: re-accumulate 112.05k–112.3k if 111,809 holds cleanly; add on break & hold > 114,472.
- Breakout: buy the close and successful retest > 114,472 targeting 116,217 then 117,966.
- Tactical short: sell a clear rejection at 114,472/116,217 (wick + volume), manage tight and take profits fast.
Risk zones / invalidations: A confirmed loss of 111,809 reopens 110k then 107,286 (bull bias invalid). A 12H/1D close > 116,217 invalidates fade shorts.
Macro catalysts (Twitter, Perplexity, news):
- Powell’s speech: potential trigger for break or fakeout.
- US PMIs: can spark the 114,472 break or a rejection.
- Hard assets strong (gold at records) and oil lower: mixed “inflation/sentiment” that shapes risk appetite.
Action plan:
- Long (range/break): Entry 112.05k–112.3k or > 114,472 / Stop 111,650 / TP1 114,472, TP2 116,217, TP3 117,966 / R:R ~2–3.
- Short (tactical): Entry 114.3k–114.5k (rejection) / Stop 114,800 / TP1 113.1k, TP2 111,809 / R:R ~1.5–2 (reduced size).
__________________________________________________________________________________
Multi-Timeframe Insights
__________________________________________________________________________________
Overall, HTFs (1D/12H) stay bullish, while LTFs rebound but still face nearby resistance.
1D/12H: Uptrend above 111,809 and 107,286 pivots; reclaim of 114,472 would open 116,217 then 117,966 with volume confirmation.
6H/4H: “Neutral buy” below 114,472; active range 111,809–114,472; a close > 114,472 should target 116,217.
2H/1H: Ongoing rebound, strong 1H volumes at the pivot; need a close > 114,472 to convert into impulse.
30m/15m: Intraday impulse (strong risk-on on 15m) but immediate friction at 114,472; beware fake breaks without a successful retest.
__________________________________________________________________________________
Macro & On-Chain Drivers
__________________________________________________________________________________
Macro is mixed: Fed speak and PMIs are in focus, hard assets strong and oil easing — likely to polarize breaks on the key technical levels.
Macro events: Powell can trigger a break/reversion; US PMIs may add volatility; record gold and softer oil adjust the “inflation/sentiment” lens.
Bitcoin analysis: 110k–115k range with 117–117.5k rejection; the 112k–110k support cluster is pivotal to preserve the structural bull bias.
On-chain data: Not provided here — no actionable on-chain extremes mentioned in this set.
Expected impact: If Powell/PMIs validate risk-on, a close > 114,472 should extend to 116,217–117,966; otherwise, expect a return to 111,809 then 110k.
__________________________________________________________________________________
Key Takeaways
__________________________________________________________________________________
BTC trades a bullish range above a key pivot while dense resistance sits overhead.
- Trend: moderately bullish while 111,809 holds; need a close > 114,472 to re-ignite upside.
- Prime setup: buy the defense of 111,809 or the break & hold > 114,472, aiming 116,217 then 117,966.
- Macro: Powell/PMIs can trigger the break or produce intraday traps.
Stay disciplined: wait for close-and-retest confirmations to size up, and de-risk quickly if macro flow contradicts the signal.

THE 4-YEAR CYCLE WILL NEVER ENDTHE 4-YEAR CYCLE WILL NEVER END.
As I’ve said many times before, I now think this cycle will push into late January / February 2026, similar to 2017.
As I’ve written extensively about, the macro setup is nearly identical to 2017.
Read that here.
The funny thing is, when we do push into early Q1 ‘26, all your favorite “influencers” will proclaim “this time is different”, because most weren’t here during the 2017 cycle or before.
There is ZERO EVIDENCE that the 4-year cycle is dead.
Since the GFC in 2008, the Fed was redesigned for these boom and bust cycles to counter inflation and unemployment.
At this point, unless the US completely dismantles the Fed, the 4-year cycle will live on in perpetuity. We see the effect of this on TradFi as well.
See the comparison here.
The Fed is set to cut interest rates for the first time in a year at tomorrow’s FOMC. This is a liquidity positive catalyst for markets.
The next ISM PMI print on October 1st should be ~50, which will be the start of the business cycle.
That would give us ~5 months of a surging business cycle, which will pump risk assets to VALHALLA.

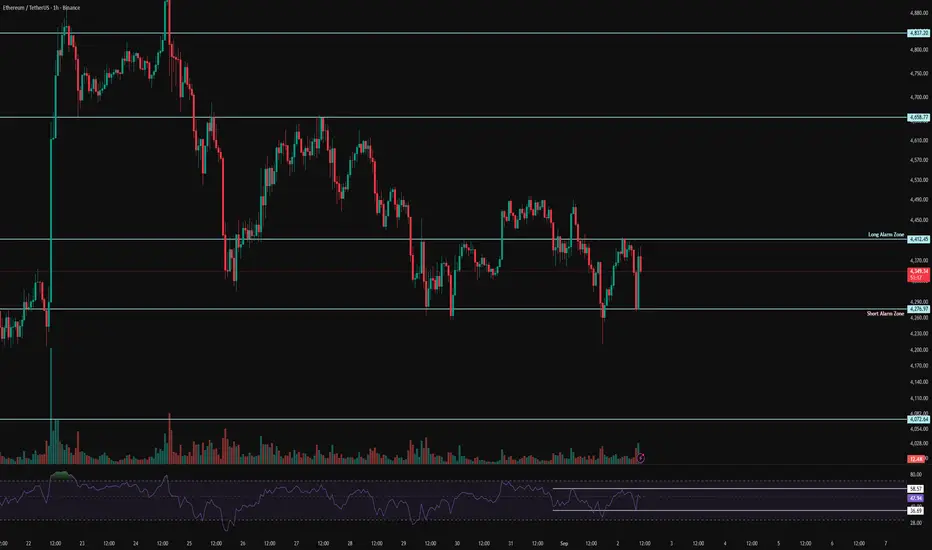
ETH 1H Analysis - Key Triggers Ahead | Day 10💀 Hey , how's it going ? Come over here — Satoshi got something for you !
⏰ We’re analyzing ETH on the 1-hour timeframe timeframe .
🔭 On the 1-hour timeframe for Ethereum, we can see that in the last few candles ETH faced a drop with some selling pressure, reaching the support zone at $4276, and then bouncing back. Now we need to see whether Ethereum manages to break the $4400 resistance or not. If it does, this level could give us a strong long position opportunity.
⛏ Two key RSI zones are being watched: 58 and 37. Once the RSI swings beyond these levels, ETH could start a solid move.
💰 Volume and green candles could continue to increase, and even while I’m writing this, a strong whale green candle with very good volume just closed for Ethereum.
🪙 On the 1-hour timeframe of ETHBTC, if the drawn support zone is lost, ETH might struggle to move upward, since Bitcoin dominance is closing green candles and this adds selling pressure on Ethereum. However, a long alarm zone has been set — and if ETH breaks above this zone, it could pump massively.
🔔 Two alarm zones are considered for Ethereum: $4400 and $4276. Personally, I’m not really thinking about short positions today, and if ETH gives a good setup, I’d rather look for a long entry.
❤️ Disclaimer : This analysis is purely based on my personal opinion and I only trade if the stated triggers are activated .
EURGBP short due to weak Euro area PMI and Strong UK PMI DataThe most recent Euro Area Services PMI data available is for August 2025, showing a value of 50.7, down from 51.2 in July 2025, and slightly below the forecast of 50.8. This indicates a slight slowdown in the services sector's expansion, as a reading above 50 still denotes growth, but the drop suggests a loss of momentum.
The most recent data for the UK Services PMI, specifically the S&P Global/CIPS Services PMI for August 2025, is 53.6, surpassing the forecast of 51.8 and improving from the previous reading of 51.8 in July 2025. This indicates a stronger expansion in the UK services sector, reflecting robust business activity.
Due to the above economic data result, we expect the Euro to weaken against the Pound.
This is a classic example of trading strong data vs weak data.

XAUUSD - Will Gold Continue to Rise?!Gold is trading above the EMA200 and EMA50 on the 4-hour timeframe and is trading in its medium-term ascending channel. A correction towards the demand zone would provide us with a better risk-reward buying position, and if it rises, we could consider selling it in the supply zone.
After a relatively quiet summer, the release of disappointing U.S. employment data brought a sharp shift in the gold market’s momentum, sparking a wave of optimism among Wall Street analysts. Gold ended the trading week near the short-term resistance level of $3,350—an area that, according to Kitco’s weekly survey, reflects a surge in bullish sentiment among market analysts.
This market turnaround happened rapidly. At the start of the week, gold came under selling pressure as economic data revealed that U.S. GDP grew by 3% in the second quarter. However, many economists questioned the reliability of this growth, noting its heavy dependence on volatile trade balance figures, which makes it a poor indicator of sustainable economic strength.
Midweek, another headwind emerged for gold. The Federal Reserve decided to keep interest rates unchanged, and in a press conference, Fed Chair Jerome Powell stated that no decision had been made yet regarding the September meeting. His cautious tone was captured in the statement: “We haven’t made any decisions about September.”
However, these remarks quickly lost weight. Just two days later, U.S. employment data significantly missed expectations, dramatically reshaping the outlook for monetary policy.
According to the Bureau of Labor Statistics, the U.S. economy added only 73,000 jobs in July—a number far below forecasts. Moreover, previous job gains for May and June were sharply revised downward, with a total of 258,000 jobs removed from earlier estimates. The updated figures showed only 14,000 jobs added in June and 19,000 in May. This disappointing data alone was enough to reignite expectations of a rate cut at the September meeting—an outcome that immediately boosted gold demand.
David Morrison, adopting a cautious stance, emphasized that although the jobs data favored gold, the market remains stuck in a narrow trading range, with limited evidence of a sustained short-term rally.
He explained, “Despite the significant gains last week, gold is still consolidating within a defined range. To break above $3,400 again—and more importantly, to hold it during any retracements—we’ll likely need a period of corrective volatility and price consolidation.”
Morrison also pointed out that the recent gold price rally was driven more by a sharp decline in the U.S. dollar than by internal factors within the gold market. “This sudden spike was largely a result of the unexpected downturn in the dollar following the release of the weak non-farm payroll report (NFP),” he said.
He further warned against over-interpreting a single data point: “Yes, the report has increased the odds of a rate cut in September, but we’re dealing with highly volatile data. It’s just one number—alongside a negative revision—and it can’t alone dictate the course of monetary policy.”
Meanwhile, investment bank Citi has raised its three-month gold price forecast from $3,300 to $3,500 per ounce. The expected trading range has also shifted—from $3,100–$3,500 to $3,300–$3,600.
According to Citi, this upward revision is driven by weak U.S. economic growth, heightened concerns about inflation linked to tariffs, and a weakening U.S. dollar. The bank also cited poor labor market data in Q2 and growing doubts about the credibility of the Federal Reserve and the Bureau of Labor Statistics. At the same time, investment demand for gold remains strong, with steady central bank purchases helping to sustain the metal’s favorable market position.

NAS100 - Stock Market Heading Down?!The index is trading in its medium-term ascending channel on the four-hour timeframe between the EMA200 and EMA50. However, if the index corrects upward towards the specified supply zone, it is possible to sell Nasdaq with better risk-reward.
In recent days and weeks, the Nasdaq Composite Index once again approached its historic highs, even setting a new all-time record. However, following the latest jobs data and the Federal Reserve meeting, the index experienced a price correction.
Unlike many previous bullish phases that were driven largely by short-term momentum or emotional reactions, the current upward trend in the Nasdaq reflects structural maturity and market stabilization. Institutional capital inflows and strong corporate earnings have together painted a picture of a more stable and predictable future for this index.
According to recent financial data, U.S. equity funds received over $6.3 billion in net inflows during the final week of July—marking the first positive inflow after three consecutive weeks of outflows.
The key engine behind this growth continues to be the robust performance of tech companies. Firms such as Meta, Microsoft, and AI-oriented companies like Nvidia and Broadcom posted exceptionally strong earnings reports. These results not only exceeded analysts’ expectations but also fueled significant gains in their stock prices, contributing to the Nasdaq’s momentum. Despite some sector-specific concerns—for instance, regarding Qualcomm in the semiconductor space—the broader tech sector has sustained its upward trajectory and even extended that momentum to adjacent industries, especially those involved in cloud and AI supply chains.
Meanwhile, advisors to Donald Trump revealed that he plans sweeping reforms at the U.S. Bureau of Labor Statistics (BLS). This announcement followed the July jobs report, which showed only 73,000 new jobs and sharp downward revisions to prior months’ figures.
On Truth Social, Trump accused the current BLS Commissioner, Erica McEnturfer, of politically manipulating employment data and ordered her immediate removal. Secretary of Labor Lori Chavez-DeRemer subsequently announced that Deputy Commissioner William Witrofsky would serve as acting head. Trump emphasized that economic data must be accurate, impartial, and trustworthy—and not politically skewed.
Following this leadership change, a broader debate has emerged around how employment statistics are collected and reported. While statistical revisions have long been a routine, non-political process since 1979, there are now growing questions about whether a better system for gathering and publishing this critical data could be developed.
As a nonpartisan branch of the Department of Labor, the BLS publishes its monthly employment report at 8:30 AM Eastern on the first Friday of each month. The data is gathered from surveys of around 629,000 business establishments.
Analysts have cited several reasons for the frequent need for revisions:
• Late responses from firms
• Delays from large corporations that distort preliminary figures
• Recalculations due to seasonal adjustments (e.g., holidays or weather)
• Demographic shifts impacted by immigration or deportation
• Annual revisions based on finalized tax records
With a relatively light economic calendar in the U.S. this week, traders have turned their focus to the latest developments in trade negotiations—particularly talks with countries that have yet to finalize trade agreements with Washington.
Although the U.S. has reached deals with key partners including the UK, EU, Japan, and South Korea, no formal agreement has yet been made with China to extend the current trade truce, which is set to expire on August 12.
The new U.S. tariff plan proposes a baseline 10% rate for most countries, but some—like India and Switzerland—face much higher rates of 25% and 39%, respectively. However, since implementation of the tariffs has been postponed until August 7, there’s still time for further negotiations and possible rate reductions. Sources close to the White House suggest the administration is eager to continue talks.
What’s now becoming clear is the sheer magnitude of the proposed tariff shifts—far beyond pre-trade-war averages. These changes could have more severe consequences than previously estimated, potentially pushing up U.S. inflation while simultaneously threatening global growth. As such, markets may be entering a fresh wave of volatility.
Compounding these concerns is the U.S. Treasury’s upcoming bond issuance schedule, which could add to market instability.
Also on the radar is the ISM Services PMI for July, due Tuesday. Its results will be closely watched for signs on the U.S. dollar’s direction and the Fed’s potential actions at its September meeting.
Notably, as of July 18, 2025, the widely-followed Buffett Indicator—measuring the ratio of market capitalization to GDP—was 2.3 standard deviations above its historical average. This level surpasses even the dot-com bubble era of the early 2000s. The indicator is now firmly in the “overvalued” zone, which often precedes market corrections or even crashes. For context, during the 2008 financial crisis, it was roughly 1.5 standard deviations below the historical norm.

XAUUSD - Gold is in for a big week?!Gold is trading below the EMA200 and EMA50 on the 4-hour timeframe and near the bottom of its medium-term ascending channel (breakout or no break is yet fully confirmed). A correction towards demand levels would provide us with a better risk-reward buying position, and if it rises, we could consider shorting it in supply levels.
In the past week, gold experienced two distinct phases in its price movement: a strong upward trend in the first half that stalled at key resistance levels, leading the market into a more cautious mode. The latest surveys reveal a clear division among gold analysts—some foresee a bearish outlook, while others prefer to remain neutral and wait for further signals. Meanwhile, retail traders remain optimistic about gold’s short-term trajectory and emphasize the continuation of its upward trend.
Analysts at Commerzbank believe the gold market is currently directionless and searching for a clear trend. In their view, recent news around potential trade agreements has weakened demand for gold as a safe-haven asset. They have adopted a neutral stance in the short term, stating that gold prices are near their upper limit with limited room for further gains at the moment.
Conversely, some experts are confident in the continuation of gold’s bullish trend. Rich Checkan, President and CEO of Asset Strategies International, declared: “Gold is in an uptrend. Today’s pullback is setting the stage for next week’s rally. If the Federal Open Market Committee (FOMC) meets expectations and holds rates steady, both gold and silver will keep climbing. And if the Fed exceeds expectations by cutting rates, we’ll see an even stronger surge in both metals. Either way, the direction is upward.”
At the same time, other analysts remain cautious about the trend’s sustainability. Mark Leibovit, editor of VR Metals/Resource Letter, warned that the U.S. dollar may be forming a bottom, which could exert downward pressure on gold and calls for increased caution from investors.
Despite continued political pressure from President Trump, the Federal Reserve is not expected to lower interest rates at the upcoming meeting. Central bankers have stated that they want to observe the economic effects of tariffs before making any adjustments. Although some Fed officials are moving away from the “wait and see” approach, analysts still believe the Fed will leave rates unchanged this week—though markets are closely watching for any signals suggesting that rate cuts could begin as early as September.
Meanwhile, China’s gold consumption in the first half of 2025 declined, though the drop was less severe than in previous years. The primary reason was increased demand for gold as a safe-haven investment, which partially offset reduced jewelry purchases due to high prices.
According to data from the China Gold Association, a government-affiliated body, gold consumption fell by 3.54% year-over-year in the first half of the year to 505,205 tons. In comparison, Q1 saw a 5.96% annual decline, and the same period in 2024 recorded a 5.61% drop.
The association stated that growing geopolitical tensions and ongoing economic uncertainty have strengthened gold’s role as a store of value and safe asset, prompting a significant rise in private investment in bars and coins.
Gold bar and coin purchases—a key indicator of safe-haven demand—surged by 23.7% to 264,242 tons, accounting for 52% of total consumption and overtaking jewelry as the largest consumption segment. Meanwhile, gold jewelry demand fell by 26% to 199,826 tons, reflecting weakened consumer interest due to high prices.
Still, the association noted that lighter jewelry products with unique designs and higher value-added features remain popular. Additionally, official data from the People’s Bank of China (PBOC) showed that the central bank increased its gold reserves in June for the eighth consecutive month.
On the supply side, domestic gold production fell by 0.31% year-over-year to 179,083 tons in the first half of the year, while output from imported sources rose by 2.29% to 76,678 tons. Altogether, China’s total gold production grew by 0.44%, reaching 252,761 tons.

EURUSD LIVE TRADE 65PIPS 5K PROFITEUR/USD stays defensive below 1.1800 ahead of ECB decision
EUR/USD remains in a bullish consolidation mode below 1.1800 in European trading on Thursday. Traders refrain from placing fresh bets ahead of the European Central Bank policy announcements and the US preliminary PMI data. Mixed PMI data from Germany and the Eurozone failed to trigger a noticeable reaction.

EUR/GBP: Bullish Stance Above 0.8640This signal outlines a tactical long entry on EUR/GBP, positioning for a bullish resolution from today's major fundamental events.
📰 Fundamental Thesis
This position is taken ahead of the two primary market movers: the ECB rate decision and the UK PMI data. The core thesis is that the ECB policy statement will be the dominant catalyst, providing strength to EUR that will outweigh the impact of the UK data release.
📊 Technical Thesis
The trade is defined by a sound technical structure. The stop loss is anchored beneath the critical support zone at 0.8640. The profit target is set to challenge the resistance area just above 0.8722. This setup offers a favorable and clearly defined risk-to-reward profile.
🧠 Risk Management
Execution is timed before extreme event-driven volatility. Adherence to the stop loss is critical to manage the inherent risk of this pre-news strategy.
Trade Parameters
⬆️ Direction: Long (Buy)
➡️ Entry: 0.86690
⛔️ Stop Loss: 0.86344
🎯 Target: 0.87382
✅ Risk/Reward: 1:2

Banana zone starts when PMI is above 53.Check your charts to verify this fact.
Total 2 with the US Purchasing Managers Index overlain.
The PMI is one of the most reliable leading indicators for assessing the state of the U.S. economy.
Previous Banana zones have coincided with the PMI above 53.
so not just when the economy is growing, but when the economy has entered humming along approaching full acceleration.
This is when most people will feel confidence and WANT to take on more risk as they are most optimistic about the future when the economy is in this state of being.

XAUUSD - Gold is on the verge of a very important week!Gold is trading above the EMA200 and EMA50 on the four-hour timeframe and is trading in its ascending channel. I predict the path ahead for gold to be upward and if the resistance level is broken, we can look for buying opportunities. If gold corrects, we can also buy it with a reward at an appropriate risk.
Gold prices experienced a mild decline over the past week, with market sentiment shaped less by fundamental shifts and more by mixed messages and scattered commentary around tariffs.Despite the noise, many traders chose to rely on data and technical charts rather than reacting emotionally—data that painted a more subdued picture than the headlines suggested.
Rich Checkan, CEO of Asset Strategies International, responded confidently in a recent survey, predicting further gains in gold. “The trajectory for gold is clearly upward. Prices have stabilized around the $3,300 level and appear ready for a new rally, especially if the appellate court’s ruling on tariffs is upheld,” he said.
Checkan also pointed to another macroeconomic factor that could support gold: “A new tax bill, described as large and costly, is set to be voted on in the Senate soon. If passed, it will likely widen the budget deficit, which historically leads to increased liquidity and rising inflation—a favorable environment for gold.”
On Friday, the PCE inflation report showed easing price pressures, though not enough to put the Federal Reserve at ease. Core PCE (excluding food and energy) rose by 0.1% month-over-month and 2.5% year-over-year in April—matching expectations and slightly down from 2.7% the previous month. The headline PCE also increased 2.1% annually, just below the forecast of 2.2%.
The key point: these data reflect the first month in which Trump’s new tariffs were active, yet there’s little evidence so far that they’ve caused inflation to rise. Still, the disinflationary trend remains sluggish and distant from the Fed’s 2% target. In its latest minutes, the Fed warned that inflation may prove more persistent than previously thought.
Nick Timiraos of The Wall Street Journal, despite the seemingly positive PCE numbers, issued a cautionary note with four key insights:
• The inflationary impact of tariffs is expected to begin showing up from May and be fully reflected in June’s data. This could accelerate goods price increases and disrupt the path of disinflation.
• Last year’s monthly PCE figures were particularly weak (May: 0%, June: 0.1%, July: 0.2%). As these drop out of the annual calculation, even if monthly gains remain steady, YoY rates could rise mathematically.
• The three-month average for Core PCE from May to October 2024 was only 0.1%. If upcoming monthly figures hit 0.2%, annual disinflation could stall or even reverse.
• While the latest report is encouraging, the effects of tariffs and the removal of last year’s weak data could complicate the inflation trajectory.
Looking ahead, market attention will focus heavily on a suite of crucial U.S. labor market indicators. The Job Openings and Labor Turnover Survey (JOLTS) is due Tuesday, private sector employment data (ADP) on Wednesday, and jobless claims on Thursday. However, the most anticipated release will be Friday’s Non-Farm Payrolls (NFP) report for May—widely viewed as a key factor influencing rate expectations.
Alongside labor data, markets will also watch other critical economic reports. The ISM Manufacturing PMI on Monday and the ISM Services PMI on Wednesday will offer broader insight into U.S. business activity. In the realm of monetary policy, interest rate decisions from the Bank of Canada (Wednesday) and the European Central Bank (Thursday) are expected to trigger notable movements in the currency and gold markets.

USDCAD RETEST OR FRESH DOWNTREND? PRICE AT A CRUCIAL CROSSROAD!USDCAD 22/05 – KEY RETEST OR FRESH DOWNTREND? PRICE AT A CRUCIAL CROSSROAD!
🌐 MACRO BACKDROP:
Canada’s CPI and Retail Sales have come in weaker than expected, signaling sluggish consumer demand and reducing the probability of near-term rate hikes by the Bank of Canada.
Meanwhile, the USD is stabilizing, supported by steady U.S. Treasury yields after the Fed reaffirmed its “higher for longer” stance.
Oil prices, a major driver of the Canadian Dollar, have shown no significant breakout, further weakening CAD’s bullish momentum.
🔍 TECHNICAL OVERVIEW (H1–H4 Chart):
After hitting a key swing low at 1.3820, USDCAD is now retracing towards the 0.5 Fibonacci zone (1.3889 – 1.3913), which also aligns with:
The 200 EMA resistance (red line)
Previous structure rejection zone
➡️ This area is critical – it could act as a trap zone before price resumes downward or breaks to confirm a short-term bullish reversal.
📈 TRADE SETUPS:
🔻 SELL SETUP (HIGH PROBABILITY IF PRICE FAILS AT RESISTANCE):
Entry: 1.3900 – 1.3913
Stop Loss: 1.3930
Take Profit Targets: 1.3884 → 1.3859 → 1.3847 → 1.3820
🔹 BUY SETUP (IF PRICE HOLDS ABOVE THE BASE ZONE):
Entry: 1.3820 – 1.3823
Stop Loss: 1.3805
Take Profit Targets: 1.3847 → 1.3880 → 1.3913
⚠️ STRATEGY NOTES:
Be cautious during the New York session, as potential comments from Fed officials or crude oil updates could spike volatility.
This is a textbook case of “reaction vs. continuation” at a Fibo cluster – stick to confirmed candlestick signals to avoid false breakouts.
📌 FINAL THOUGHTS:
USDCAD is in a corrective rally after an extended decline. The 1.3913 zone is a key decision point. Sellers should watch for signs of exhaustion, while buyers can target short-term retracements if support holds at 1.3820.

EURUSD 21 Feb 2025 W8 - Intraday Analysis - EU & US PMI Day!This is my Intraday analysis on FX:EURUSD EURUSD for 21 Feb 2025 W8 based on Smart Money Concept (SMC) which includes the following:
Market Sentiment
4H Chart Analysis
15m Chart Analysis
Market Sentiment
It's PMI Day today:
EU: Flash Manufacturing PMI - Flash Services PMI
US: Flash Manufacturing PMI - Flash Services PMI
The market still in the same sentiment detailed in my Weekly Analysis . Below a summary:
Short-Term Bias: Cautiously bullish for EUR/USD, driven by optimism over delayed tariffs, geopolitical progress, and hopes for softer inflation.
Key Risks:
A hot PCE report reviving Fed hawkishness.
Sudden tariff escalations or breakdowns in peace talks.
4H Chart Analysis
1️⃣
🔹Swing Bullish (Reached Swing Extreme Demand)
🔹INT Bearish (Reached Extreme Supply)
🔹INT-INT Bullish (Reached EQ (50%)
🔹Swing Continuation
2️⃣
🔹With the deep pullback to the Bullish Swing extreme discount and mitigating the 4H/Daily demand zones, price turned Bullish forming a Bullish CHoCH.
🔹The current Bullish move from Swing extreme discount to current price level having 2 scenarios (Previously I’d the following 2 scenarios where now I favors the 2nd scenario due to the impulsive nature of the move):
Scenario 1: Pullback for Bearish INT Structure and with the recent Bearish CHoCK and Minor Demand zones are failing, I expect Bearish continuation to target the Weak INT Low which aligns with the Daily/Weekly Bearish Structure/Move. (Counter Swing – Pro Internal)
Scenario 2: Bullish Swing continuation to target the Weak Swing High. Which requires to have Demand holding and Supply failing. The first sign required to confirm this scenario will be the current Demand which price is currently at to hold and we form a Bullish CHoCH. (Pro Swing – Counter Internal)
🔹As expected yesterday, price managed to continue Bullish after reaching the INT-INT structure EQ (50%) in a solid impulsive move aligns with the Swing continuation move.
3️⃣
🔹Still expectation is set to continue Bullish targeting the Weak Swing High as long LTFs holds Bullish structures. Also, In my mind I’m not neglecting the current Bearish 4H INT structure and we already reached that structure extreme where we are getting the current corrective Bearish OF.
15m Chart Analysis
1️⃣
🔹Swing Bullish
🔹INT Bullish
🔹Reached Swing EQ (50%)/Discount
🔹Swing Continuation Phase
2️⃣
🔹The 15m Bullish Swing pullback phase is still intact with continues Bearish INT structures.
🔹Price had reached Swing extreme demand in Swing Discount.
🔹With the recent Bearish iBOS, price had formed Liq. above the 15m Demand which was sept with the break of the Weak INT Low, mitigating the 15m Demand and forming a Bullish CHoCH to initiate the Bearish INT Structure Pullback.
🔹With the Bullish iBOS yesterday, we confirmed that the Swing Pullback phase may have ended and we are in a new Bullish continuation phase.
3️⃣
🔹With the recent iBOS, price is currently in Pullback Phase to HP POIs to then continue Bullish.
🔹As yesterday expectation of continuing Bullish, still on the expectations of price continuing Bullish targeting the 15m Weak Swing High / 4H Weak Swing High.

AUDJPY SHORT: Caixin Services PMI lower than estimatedChina's January Caixin Services PMI was 51.0 vs. 52.2 in December. This shows a slowing service sector in China. As a result of this economic news release, the Australian dollar is expected to potentially weaken against the Japanese yen. We must remember that China is one of Australia's biggest trading partners, so anything that happens in China will almost always affect the Australian dollar.

XAUUSD - Gold Awaits Weekend Data Releases?!Gold is trading above the EMA200 and EMA50 on the 4-hour timeframe and is in its ascending channel. If gold rises towards the channel ceiling and supply zones, we can look for short positions targeting the channel midline.
The gold market has kicked off 2025 with one of its best starts since 2023 and is on track to achieve its strongest monthly performance since September. Prices are currently testing the high range near $2,750 per ounce.
A fund manager noted that this robust start to January could signal another strong year for the precious metal, even after gold recorded a 27% price increase last year.
In his 2025 outlook report, Eric Strand, founder of the precious metals-focused AuAg Funds, projected that gold prices will surpass $3,000 per ounce this year. He stated: “We expect gold to break the $3,000 barrier during the year and possibly reach even higher levels by year-end, with a realistic target of $3,300.” Strand’s bullish target represents a 20% increase from current levels.
Strand suggested that the new Trump administration might usher in a period of more accommodative monetary policies and larger government stimulus programs. In his report, he explained: “Both Donald Trump and Elon Musk have built their empires on extensive borrowing while driving forward at full speed.
This approach will likely persist for the next four years as governments strive to avoid an economic downturn at any cost to create a positive boom. However, the price of this strategy will be monetary inflation. Such an inflationary boom creates a financial environment where commodity prices, including gold, rise significantly.”
As U.S. national debt has reached unprecedented levels, now exceeding $36 trillion, Strand highlighted that the United States is not alone in facing this challenge. He emphasized that governments worldwide continue to increase spending through deficit financing. He noted: “The amount of money circulating in the system is increasing without generating substantial real growth, which naturally means each unit of currency becomes less valuable.”
Meanwhile, gold prices remain near all-time highs against major currencies such as the euro, British pound, Chinese yuan, Canadian dollar, and Australian dollar.
Gold continues to stand out as a safe-haven global asset as the trend of de-globalization accelerates. Countries are moving away from dependence on the U.S. dollar and diversifying their currency reserves. (De-globalization refers to the process of reducing or reversing global integration, including less free trade, restricted capital flows, reduced interdependence, and a rise in nationalist and local policies.)
Strand stated: “We have seen the beginning of de-globalization, and it appears to be gaining momentum, particularly as the U.S. seeks to impose conditions that serve its own interests. Policies such as ‘America First’ and high tariffs may benefit the U.S. economy, but they also undermine trust in the country as a leader in free-market economies.” He added: “This new phenomenon is likely to create inflationary pressures and may lead to waves of currency devaluation in other nations as they attempt to offset the effects of tariffs.”

The Purchasing Managers’ Index (PMI): What Does It Tell Traders?The Purchasing Managers’ Index (PMI): What Does It Tell Traders?
The Purchasing Managers’ Index (PMI) is a widely watched economic indicator that helps traders assess the overall health of the economy via an early snapshot of business activity. Traders often use this data to analyse potential market movements across different asset classes, from equities to forex. In this article, we’ll explore what the PMI is, how it works, and why it matters for traders.
PMI Definition
The Purchasing Managers’ Index (PMI) is a key economic indicator that offers insight into the business conditions of the manufacturing and services sectors. It’s derived from monthly surveys sent to purchasing managers at various companies, who provide data on several aspects of their business activities. The idea is to get a snapshot of how the economy is performing based on the people making the procurement decisions. PMI data is released in various countries, including majors.
PMI is calculated by analysing five main components:
- New Orders: Measures the level of new orders received by businesses, indicating future demand.
- Inventory Levels: Looks at the stock of goods that companies have on hand, reflecting production expectations.
- Production: Assesses the output levels of companies, showing current economic activity.
- Supplier Deliveries: Tracks the time it takes for suppliers to deliver goods, which can signal supply chain conditions.
- Employment: Monitors hiring levels, providing clues about the labour market.
The PMI is reported as a number between 0 and 100. A reading above 50 suggests that the sector is expanding, while a figure below 50 indicates contraction.
There are different types of PMIs to be aware of:
- Manufacturing PMI: Focuses on the manufacturing sector and is often watched closely because manufacturing is a significant part of many economies.
- Services PMI: Covers the services sector, which includes industries like finance, healthcare, and retail.
- Composite PMI: Combines data from both the manufacturing and services sectors to give a broader picture of overall economic health.
How the PMI Is Calculated
The PMI economic indicator is calculated using survey responses from purchasing managers who report whether conditions have improved, remained the same, or worsened. Each response is assigned a score: 1 for improvement, 0.5 for no change, and 0 for deterioration. The PMI is then calculated using the formula:
PMI = (P1 × 1) + (P2 × 0.5) + (P3 × 0)
Where P1, P2, and P3 represent the percentages of each response.
PMI as a Leading Economic Indicator
The PMI is widely regarded as a leading economic indicator, meaning it often signals shifts in the economy before other data figures catch up. This is because it’s based on real-time data from purchasing managers, who have a front-row view of their companies’ supply chains and business activity.
Early Signals
The PMI often catches shifts in the economy before broader indicators like GDP can reflect them. For example, there may be a multi-month decline in the PMI index, meaning that an economic slowdown is coming, giving traders a chance to adjust their positions before the data is widely recognised.
Global Comparisons
PMI isn’t just available for one country; it’s tracked across the world. Comparing PMI data from different regions allows traders to see how various economies are performing relative to each other. For instance, if the Eurozone PMI is climbing while the US PMI is dropping, it might indicate stronger growth prospects in Europe.
Correlation with Broader Economic Trends
PMI trends are often correlated with other major indicators like GDP growth, inflation, and industrial output. For traders, this makes the PMI a useful tool to anticipate how markets might react to upcoming economic reports. If the PMI has been rising, GDP or job growth numbers are likely to follow suit, offering a way for traders to estimate upcoming economic releases.
Why the PMI Report Matters to Traders
The PMI indicator is a valuable tool for traders because it provides early insight into the state of the economy. Here’s why traders pay attention:
- Economic Sentiment: A rising PMI suggests that businesses are seeing higher demand and increasing production, which can boost confidence in economic growth. On the flip side, a falling PMI can hint at slower activity, creating caution among traders.
- Stock Market Reactions: Traders often see PMI data as a way to gauge how different markets might respond. For instance, if the PMI shows strong expansion, stock markets may react positively, especially in sectors sensitive to economic health like manufacturing or retail. Conversely, a weak PMI could lead to declines as concerns about slower growth set in.
- Currency Impact: Currencies tend to strengthen when PMI data indicates economic expansion, particularly for major economies like the US or the Eurozone. This is because higher economic activity usually leads to higher interest rates, which can make a currency more attractive to investors.
- Commodities: In commodities, a strong PMI often means higher demand for raw materials like oil and metals, while a weaker PMI could signal reduced demand.
If you’d like to see how past PMI releases have impacted markets, head over to FXOpen to explore a world of stocks, currency pairs, commodities, and more.
Interpreting the PMI in Trading
When traders look at PMI data, they’re not just interested in whether the number is above or below 50—they’re looking for trends and context. As mentioned, a PMI above 50 generally signals economic expansion, while below 50 suggests contraction, but the details matter.
Key Thresholds
While 50 is the main dividing line, traders often watch for more specific levels. For instance, if the PMI climbs above 55, it usually points to strong growth. If it dips below 45, it could indicate a deeper economic slowdown. Traders pay attention to these shifts because they can signal changes in market sentiment.
Month-to-Month Changes
It’s not just about the latest PMI reading but how it compares to previous months. For example, a PMI of 52 might still suggest growth, but if it’s down from 57 the month before, traders may see it as a warning sign of slowing momentum. Conversely, an increase over several months can signal improving conditions.
Market Reactions to Surprises
Market expectations play a huge role in how PMI data is received. If the PMI reading is significantly higher or lower than expected, markets can react swiftly. A higher-than-expected PMI might push stock prices up as traders anticipate stronger economic growth. Conversely, a lower-than-expected PMI could spark sell-offs in risky assets.
Sector-Specific Insight
Traders don’t just look at the headline PMI—they break down the numbers by sector. For example, if the manufacturing PMI is rising but the services PMI is stagnant or falling, it could mean that only certain parts of the economy are doing well. This helps traders understand which sectors might perform better in the short term.
Global Context
PMI data from major economies like the US, China, and the Eurozone can influence global markets. For example, strong US PMI data could push equities higher around the world, while weak data from China might affect commodity prices like copper or currencies like the Australian dollar.
The Limitations of Using PMI
While the PMI is a useful tool for understanding economic trends, it’s not without its limitations. Traders need to be aware of potential pitfalls when using this data in isolation.
- Sector-Specific Focus: PMI primarily covers manufacturing and services, which means it might not fully represent the broader economy, especially in economies where other sectors, like technology or agriculture, play a significant role.
- Short-Term Volatility: PMI data can be sensitive to short-term factors, such as seasonal demand fluctuations or temporary supply chain disruptions. These one-off events can distort the numbers, making it tricky to draw long-term conclusions based on a single month’s report.
- External Factors: Sometimes, external factors like geopolitical tensions or sudden policy changes can have a bigger impact on markets than the underlying economic trends reflected in PMI. It’s always wise to consider the broader context.
- Complementary Analysis Needed: Relying solely on PMI data without looking at other economic indicators, like employment figures or consumer spending, can lead to a narrow view. Therefore, it’s usually used as part of a broader economic analysis.
The Bottom Line
The PMI offers valuable insights into economic trends, helping traders analyse potential market movements across various asset classes. While not without its limitations, it's a key indicator for understanding market sentiment. For those looking to take advantage of PMI data in their trading, opening an FXOpen account provides access to more than 700 markets and low-cost, high-speed trading.
FAQ
What Does PMI Stand for in Markets?
PMI stands for Purchasing Managers’ Index. It reflects the sentiment of purchasing managers who are responsible for buying goods and services in various industries. Their responses to monthly surveys form the basis of the PMI data, meaning traders can better understand which sectors are expanding or contracting.
What Does PMI Mean in Trading?
In trading, the PMI meaning refers to the Purchasing Managers’ Index, a key economic indicator that traders use to assess the health of the manufacturing and services sectors. It helps traders gauge economic growth or contraction, which can impact asset prices like equities, currencies, and commodities.
How to Use PMI in Forex Trading?
In forex trading, PMI data is closely monitored because it provides insight into economic strength. A higher PMI typically signals economic growth, which can strengthen a currency. Conversely, a lower PMI may suggest weaker economic activity, potentially putting downward pressure on the currency.
How Does the PMI Index Work?
The PMI index is calculated from monthly surveys of purchasing managers in manufacturing and services. The data covers areas like new orders, production, employment, supplier deliveries, and inventory levels. Readings over 50 demonstrate an expanding economy, while below 50 indicate a contracting economy.
What Is Manufacturing PMI?
Manufacturing PMI focuses solely on the manufacturing sector. It tracks changes in production, new orders, inventories, and more to reflect the overall health of the manufacturing industry.
What Is the Difference Between the ISM and PMI Index?
The ISM PMI index is produced by the Institute for Supply Management and focuses on the US economy, while PMI is a broader term that refers to similar indices in other regions, like IHS Markit’s global PMI.
This article represents the opinion of the Companies operating under the FXOpen brand only. It is not to be construed as an offer, solicitation, or recommendation with respect to products and services provided by the Companies operating under the FXOpen brand, nor is it to be considered financial advice.

Australian dollar falls as core CPI dips lowerThe Australian dollar is lower for a second straight trading day. In the North American session, AUD/USD is trading at 0.6214, down 0.27% at the time of writing. The Australian dollar dropped as low as 0.60% but has pared much of those losses.
Australia's inflation report was a mixed bag in November. Headline inflation rose 2.3% y/y, up from 2.1% in the previous two months and above the market estimate of 2.2%. This marked the highest level since August and was partially driven by a lower electricity rebate for most households.
At the same time, the trimmed mean inflation, the Reserve Bank of Australia's preferred core inflation gauge, fell from 3.5% to 3.2% in November. This reading is close to the upper limit of the RBA's target band of 2%-3% and supports the case for the RBA to join the other major central banks in lowering rates.
The RBA has maintained the cash rate at 4.35% at nine consecutive meetings but is this prolonged pause about to end? In the aftermath of today's inflation report, the money markets have priced in a quarter-point hike in February at over 70%. Australia releases the quarterly inflation report for the fourth quarter on Jan. 29 and if inflation is lower than expected, expectations of a rate cut will likely increase.
The US economy has been solid and this week's services and employment indicators headed higher. The ISM Services PMI rose to 54.1 in December, up from 52.1 and above the market estimate of 53.3. JOLT Job Openings jumped to 8.09 million in November and 7.8 million in October. The market is looking ahead to Friday's nonfarm payrolls, which is expected to drop to 154 thousand, compared to 227 thousand in November.
AUD/USD tested support at 0.6214 earlier. Below, there is support at 0.6182
0.6250 and 0.6282 are the next resistance lines
