Polkadot: Ready to Bounce Straight Back Up?For now, we continue to expect that DOT will be sold off into our orange Target Zone between $1.66 and $0.70—which could offer attractive long entry opportunities – and complete magenta wave . However, we estimate there’s a 37% chance that the significant low is already in place and that the altcoin could break out directly above resistance at $3.45; in this scenario, our Target Zone would no longer be relevant.
Polkadotanalysis
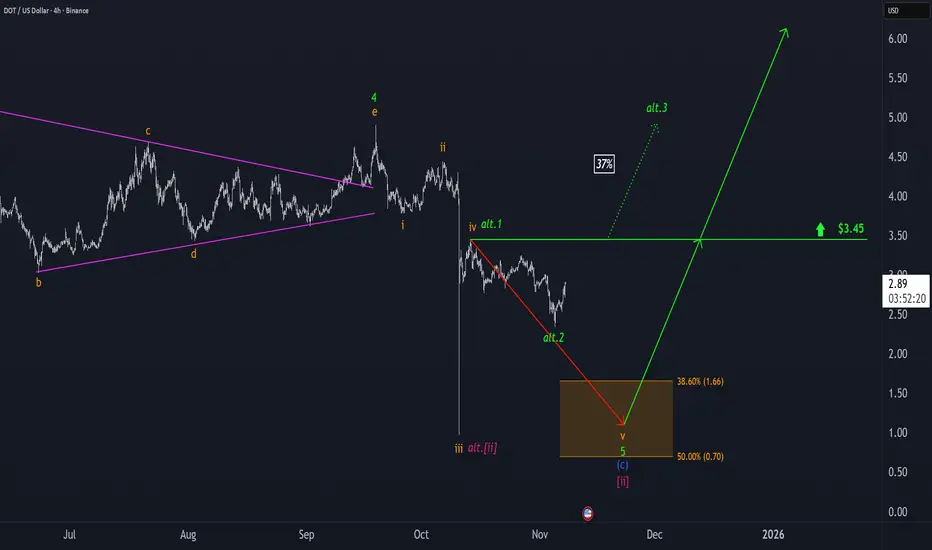
Polkadot: Short-Term Rally Before Potential Drop into Target ZonDOT is currently expected to move toward the high of wave iv in orange, according to our primary scenario. We continue to anticipate that this move will remain below the resistance level at $3.78. Afterward, we are primarily preparing for a wave v sell-off into the orange Target Zone ($1.66 – $0.70). In this range, we expect to see the low of wave in magenta, which should signal a potential long-term trend reversal to the upside. There is still a 30% probability that the correction low has already been completed as wave alt. in magenta. However, this alternative would only be definitively confirmed by a significant breakout above the $3.78 level.

Can DOT/USDT Sustain Its Bullish Momentum This Week?🎯 DOT/USDT: The Kijun Breakout Heist 💎 | Swing/Day Trade Setup
📊 Market Overview: POLKADOT vs TETHER
The DOT/USDT pair is flashing some serious bullish signals, and this setup is looking too good to ignore! We've got a Kijun moving average breakout brewing alongside a CCI momentum oscillator golden cross — the kind of technical alignment that makes traders smile. 😏
🎯 The "Thief Strategy" Game Plan
Trading Style: Swing/Day Trade Hybrid
Bias: BULLISH 🚀
Confirmation: Kijun MA breakout + CCI golden cross momentum surge
💰 Entry Strategy: The Layered Limit Order Approach
Here's where it gets interesting. Instead of market buying like a rookie, we're using multiple limit orders (the "layering strategy") to scale into this position like professionals:
Suggested Entry Layers:
🎯 Layer 1: $4.150
🎯 Layer 2: $4.200
🎯 Layer 3: $4.250
You can add more layers based on your position size and risk appetite. The beauty of layering? You average into the move instead of gambling on one entry!
🛡️ Risk Management Zone
Stop Loss: $4.050 🚨
⚠️ IMPORTANT DISCLAIMER:
Dear Ladies & Gentlemen (Thief OG's) — this is MY stop loss level based on MY analysis. You are NOT obligated to use this level. Trading is YOUR responsibility, YOUR risk, YOUR reward. Set YOUR own stop loss based on YOUR risk tolerance. Manage your money, take your profits, and protect your capital at your own discretion.
🎯 Profit Target: Know When to Exit the Heist
Target Zone: $4.600 💰
This target aligns with:
Strong historical resistance
Overbought RSI/CCI conditions (potential trap zone)
Natural profit-taking area
🚨 Exit Strategy Reminder:
Dear Ladies & Gentlemen (Thief OG's) — this is MY target based on MY technical analysis. You are NOT required to follow this target. Take profits when YOU feel comfortable. Lock in gains, scale out, or let it ride — it's YOUR choice and YOUR capital. Make money, then take money at your own risk.
🔍 Key Technical Indicators Breakdown
✅ Kijun Moving Average: Bullish breakout confirmed
✅ CCI Momentum Oscillator: Golden cross formation (bullish momentum shift)
✅ Price Action: Higher lows forming, trend structure improving
✅ Volume Profile: Increasing buying pressure on breakout levels
💎 Related Pairs to Watch (Correlation Play)
Keep an eye on these correlated assets for confluence:
CRYPTOCAP:DOT Dominance — Overall Polkadot ecosystem strength
$KSM/USDT (Kusama) — Polkadot's canary network, often moves in tandem
$ATOM/USDT (Cosmos) — Similar interoperability narrative
$AVAX/USDT (Avalanche) — Competes in similar L1 smart contract space
$BTC/USDT — King Crypto correlation; DOT typically follows BTC trend direction
$ETH/USDT — Ethereum's strength often lifts altcoins including DOT
Why watch these? If CRYPTOCAP:DOT rallies while CRYPTOCAP:BTC and CRYPTOCAP:ETH consolidate, that's relative strength — a bullish divergence. If ASX:KSM pumps, CRYPTOCAP:DOT often follows. Smart traders watch the whole ecosystem, not just one chart! 👀
🧠 Final Thoughts: Trade Smart, Not Hard
This setup combines:
📈 Momentum confirmation (CCI golden cross)
📊 Trend confirmation (Kijun breakout)
💰 Smart entry execution (layered limits)
🛡️ Defined risk (clear stop loss)
🎯 Clear target (resistance + overbought zone)
The "Thief Strategy" isn't about greed — it's about stealing profits from the market with precision and discipline. Layer in, manage risk, and take profits when the market gives them to you. 💼
📌 Disclaimer
⚠️ This is the "Thief Style" trading strategy — for educational and entertainment purposes only. This analysis is NOT financial advice. Trading crypto carries substantial risk of loss. The "Thief" approach is a fun, stylish way to describe disciplined layered entries, but YOU are responsible for your own trading decisions, risk management, and capital. Trade what you can afford to lose. Do your own research (DYOR).
Not a registered financial advisor. Just a chart enthusiast sharing ideas. 🎨📊
✨ If you find value in my analysis, a 👍 and 🚀 boost is much appreciated — it helps me share more setups with the community!
#DOTUSDT #DOT #Polkadot #CryptoTrading #SwingTrading #DayTrading #TechnicalAnalysis #CCIOscillator #KijunBreakout #CryptoSignals #AltcoinSetup #LayeredEntry #RiskManagement #ThiefStrategy #BullishSetup #MomentumTrading

Polkadot: Rally Gains MomentumPolkadot’s DOT token has posted impressive gains recently. We primarily attribute this rally to wave iii in orange, which appears poised to break decisively above the $4.68 resistance level. At the same time, we see a 30% chance that a new correction low could still develop within the green alternative Target Zone between $3.22 and $2.31.

Polkadot: Bottom Already in?Given Polkadot’s recent sharp rebound toward resistance at $3.66, we consider it 35% likely that magenta wave alt. has already bottomed at $3.02. This would be confirmed by a meaningful breakout above said $3.66 level. Our primary scenario, however, still calls for lower lows as part of wave – with a break below the same $3.02 support.
📈 Over 190 precise analyses, clear entry points, and defined Target Zones - that's what we do.

Polkadot Setup Unfolding - Wait for the Breakout!🔍 Polkadot (DOT/USDT) Technical Breakdown
Currently analyzing DOT/USDT, and when we zoom out to the higher timeframes (📆 weekly and daily), it’s clear that price remains in a macro bearish trend 📉. We’ve recently seen a deep retracement into the upper end of the range — a region I would classify as premium pricing 💰.
Despite the recent bullish momentum 🔼, I'm exercising caution when it comes to long positions. From a value perspective, this isn’t where I want to be buying. Instead, my bias leans bearish — but only if specific criteria are met. ✅
I'm watching closely for a clear break of the current range, ideally with:
1️⃣ A market structure break
2️⃣ Strong price displacement (to confirm intent)
3️⃣ A shift in order flow and momentum to support a downside move 🚨
These concepts are influenced by a blend of Wyckoff theory and ICT (Inner Circle Trader) principles 🧠, which I walk through in detail in the video.
📚 As always, this is for educational purposes only — not financial advice. 💼❌

Polkadot: Shaky SupportPolkadot remains weak, barely holding onto the round $4 mark on Friday. Primarily, we soon expect another sell-off below the support at $3.67 and into the orange Target Zone between $2.40 and $1.07. Once the low of the magenta wave is reached down there, the next major impulsive movement can start and carry the price back above the resistance at $5.38. If Polkadot turns sustainably upward now and directly breaks through the $5.38 mark, the next magenta impulse wave alt. will begin prematurely. In this 20% likely alternative scenario, the corrective structure (still ongoing according to the primary scenario) would have already been completed with the low of March 11.

PolkaDot DOT Has Just Confirmed The Huge Reversal!Hello, Skyrexians!
Recently we made analysis on BINANCE:DOTUSDT where pointed out that the reversal is likely, but not confirmed. Now we have the reversal signal even on weekly. Moreover, we know that you don't like DOT and argue when we draw the unbelievable targets. Toady we will show you the realistic one.
Let's take a look at the weekly chart. We can see two confirmed green dots on the Bullish/Bearish Reversal Bar Indicator . Moreover there bars have the great angle with the Williams Alligator. Even if we will not count Elliott waves it's enough to have an idea that bull run is starting now. The realistic target is located at 0.61 Fibonacci zone approximately at $30-$35.
Best regards,
Skyrexio Team
___________________________________________________________
Please, boost this article and subscribe our page if you like analysis!

PolkaDot DOT Has a Chance, But Still In Danger!Hello, Skyrexians!
Recently we have already made analysis on BINANCE:DOTUSDT before the dump, where pointed out that wave 5 to the downside ahead. Asset has finally reached the minimal target at $3.8 and now we have a question if it's going to reverse or $2 is next.
Let's take a look at the daily time frame. We can see the Elliott waves structure and wave 5 can be finished anytime now. Our best practice to find the reversals is the green dot on the Bullish/Bearish Reversal Bar Indicator and the divergence with Awesome Oscillator. Now we can see all these conditions, but bullish reversal bar is still unconfirmed, while it's high is going to be broken, the danger will be melted, but now we still have a chance to go down.
Also wanna notice the false signals on the indicator. All of them are placed inside the range and cannot be counted as valid. Take it into account when use it.
Best regards,
Skyrexio Team
___________________________________________________________
Please, boost this article and subscribe our page if you like analysis!

Polkadot: Now It’s Crunch TimePolkadot has been unable to resist the widespread downturn in the altcoin sector, giving up much of its recent gains after a solid performance in recent days. Our grayed-out Target Zone for the low of the green wave is coming back into focus – though under our primary scenario, DOT shouldn’t fall much lower in the short term. If the coin drops below the $3.80 support, however, a new bear market low in our orange Target Zone between $2.40 and $1.07 will be on the horizon. In this 39% probable alternative scenario, the coin would erase all gains since the low in October 2023, implying a new bottom for the magenta wave alt. . In our primary scenario, we expect renewed buying pressure soon, which should allow the green wave to surpass the resistance at $5.38.

Polkadot: Back on the Rise?Following the recent sharp pullback, Polkadot has established an important low just above the support at $3.56, completing the orange wave ii. In the medium term, the subsequent orange impulse wave iii should drive the price significantly higher, breaking past the resistance at $11.88. However, if DOT falls below $3.56, our 39% likely alternative scenario will come into play, and the magenta wave alt. will reach a new major correction low. For this case, we have outlined our orange alternative Target Zone between $2.40 and $1.07.

Polkadot ready to fly!Hi fellow traders, DOTUSDT is ready to make a move higher after completing the complex correction in WXY formation. Target the 12.7788 level. Good luck and trade safe!

Polkadot Dot usdt Daily analysis
Time frame 4hours
Risk rewards ratio >2 👈👌
Technical analysis base on Eliot waves
The correction 3points (ABC) Eliot waves has finished ✅️
Now, I think, impulse Eliot waves starts . (1-5)
I designed the fist impulse wave on the first branche of main Eliot waves. ✅️
If this analysis happens, we will have a unbelievable alt-season. 🎅💥💥🎅
What's your analysis? 🤔
Do you think impulse wave is started?🤔

Polkadot: New Yearly High Soon?Polkadot is currently showing a slight downward trend. However, since hitting the pink wave II low at $7.42, the cryptocurrency has made a significant recovery. According to our primary scenario, the ongoing impulsive wave III should push the price well above the $10.52 resistance before the next interim correction in the pink five-wave pattern begins. However, Polkadot is unlikely to surge straight to a new all-time high without experiencing occasional pullbacks along the way. Indeed, there is even a chance for a new low of wave alt. II below $7.42.

Polkadot RebornAs always, I’ve kept the chart simple and straightforward, so there’s no need for lengthy explanations:
- Bubbles: Red represents resistance, and green indicates support.
- Trends: Clearly marked with blue lines.
- Historical Resistance: Illustrated with violin lines.
Key Notes:
- As I’ve explained before, resistances often flip into supports over time, so in this graphic, i turned red older bubbles to green bubbles. simple as that..
- Like many altcoins, Polkadot (DOT) has broken out and is now showing bullish momentum.
Important Considerations:
- Keep in mind that most altcoins are heavily influenced by BTC, BTC Dominance (BTC.D), and USDT Dominance (USDT.D). To trade effectively, you need to monitor these factors simultaneously.
------------------------------------------------------------------
DOT Support and Resistance Levels:
------------------------------------------------------------------
Support 1: $9.50 (current level)
Support 2: $7.50
Support 3: $5.80
Resistance 1: $23.20
Resistance 2: Approximately $50 (previous 2021 ATH).
------------------------------------------------------------------
Potential Targets for the Next Bull Run:
- The potential incoming alt run targets are aligned with the trend and marked by grey dotted lines, calculated using Fibonacci.
Remember, this is just the beginning, not the end, don’t be fooled.
Happy Tr4Ding !

Polkadot- I understand it may feel like a challenging time, but remember, fortune favors the bold.
- Using extreme leverage, whether 30X or 100X, won't lead to wealth.
- it often leads to losses.
- Instead, consider buying on the spot market; it's a more stable strategy. When the market dips, that's the perfect time to dollar-cost average (DCA) more.
- Hold your positions, stake wisely, and most importantly :
- exercise patience.
- it's the ultimate key to success.
- Keep an eye on the charts, watch for triple bottoms, track trends, and be mindful of bubbles and Fibonacci levels.
Happy Tr4Ding!

You Will Not Believe In This Polkadot DOT Target!Hello, Skyrexians!
BINANCE:DOTUSDT is one is the most hated coin now because it was introduced as a fundamentally strong crypto on the previous bull run, but on the current bull run it's performance is one of the worst in comparison with other tokens. Today we are going to show you why PolkaDot can be the sleeping giant and despite the great market cap can reach insane targets!
Let's take a look at the 1W time frame. If we consider previous bull run as a wave 1, price still has not broken its bottom. It means that DOT is still in the global uptrend. Bear market for this crypto has clear ABC structure which has printed the global wave 2. It has been ended in August 2024 with the green dot on the Bullish/Bearish Reversal Bars Indicator , which is strong long signal with the bullish reversal bar.
We expect that wave 3 has been already started and its targets can be measured by the Fibonacci Extension 1.61 and 2.61 levels. The first one is $89, the second $142.
Best regards,
Skyrexio Team
___________________________________________________________
Please, boost this article and subscribe our page if you like analysis!

Polkadot Critical Momentum - Since 2015, Bitcoin showed me a glimpse of what decentralization could achieve – true empowerment of people through a trustless, resilient network.
- By 2020, Polkadot amplified that vision for me, giving projects the freedom to build their own blockchains and putting governance back in the hands of the people. It may seem utopian, but Bitcoin has already proven it's possible with POW (proof of work).
- In this 2024 pre-bull market, I’ve heavily watched BNB, Solana, and Toncoin bring in impressive profits.
- I’ve followed these projects since their inception. BNB, tied closely to Binance, shares its fate—if Binance falters, so will BNB. Solana’s development team holds substantial control, often restarting the blockchain when it encounters issues, which raises questions about its decentralization. Similarly, Toncoin’s future is tied to Telegram’s success, meaning that if Telegram fades, Toncoin would likely follow.
- All three projects – BNB, Solana, and Toncoin – have been heavily influenced by hype, memes, and venture capital backing.
- Back to the trend :
- Polkadot is at a critical juncture: if it doesn't break the downtrend, it could easily slide back to $3.60 or less, if it breaks up $5.50 is the next critical point.
- Cryptos remain highly volatile and unpredictable. Invest wisely, do your own research (DYOR), and approach each projects with caution.
Happy Tr4Ding!

Polkadot (DOT) Set for Potential Rebound? Key Price Action Signa👀👉 Despite recent downward pressure, Polkadot (DOT) is showing a bullish break of market structure on the 30-minute timeframe. I’m closely monitoring for a possible buying opportunity, guided by the key criteria discussed in the video. In this analysis, we’ll highlight the critical price action signals to follow and how to strategically position yourself for the next potential move. Disclaimer: This analysis is for informational purposes only and does not constitute financial advice. 📊✅

Polkadot (DOTUSDT) Falls Fast! TP1 Hit, More Targets in Sight!Technical Analysis:
Polkadot (DOTUSDT) on the 15-minute timeframe entered a short trade with a clear rejection of the Risological Dotted Trendline, signaling strong bearish momentum.
Key Levels:
Entry: 4.450
Stop Loss (SL): 4.534
Target 1 (TP1): 4.347 ✅
Target 2 (TP2): 4.180 (In progress)
Target 3 (TP3): 4.013
Target 4 (TP4): 3.910
Observations:
Price respected the Risological Dotted Trendline as dynamic resistance, confirming the downtrend.
After hitting TP1, Polkadot remains in a solid downward trajectory, increasing the likelihood of hitting subsequent targets.
Volatility is providing momentum, which could lead to quicker completion of lower targets.
Polkadot's bearish move continues to unfold as TP1 is confirmed. Watch for the price to challenge TP2 and beyond as this short setup gains further momentum.

I am entering Long-term Long position on Polkadot!BINANCE:DOTUSDT all time high in early March which is huge sign to go up. As you can see there was a crucial resistance channel holding BINANCE:DOTUSDT since last June. Now BINANCE:DOTUSDT consolidating above it and checked weekly crucial support zone once. I suggest you to look at my last idea on BINANCE:DOTUSDT and where to take profits.

Polkadot Next BullRun- Okay now that we got the Bottom ( 4.3$ ish).
- We can try to calculate the highest points for the next bull run.
- i am not in patterns too much but we can see that DOT formed a kind of Cypher Bullish Pattern.
- A resistance was created around 9.80-10$.
- So Polkadot will have to go retest this zone and breakout to climb more.
--------------------------------------------------------------------------------------------------
- TP Zones :
--------------------------------------------------------------------------------------------------
- TP1 : 50$ ish (ATH 2021).
- TP2 : 85$ ish (161.8 Fibo).
- TP3 : 200$ ish (Max Fibo 423.6).
--------------------------------------------------------------------------------------------------
- Like Always :
-- Take your train ticket before the mass.
-- Sell when others rush to buy :D.
Happy Tr4Ding !

