ASTERDMHi guys, this chart is for educational purpose only not for sale... plz do your own analysis too.. Thank Q
Positional

RADICO is ready to buy for positional trade.Aim for 6-8% . It can be easily achievable in 1-3 days.
My belief is to choose high winning probability trade with a risk-reward ratio going from 1:1 to 1:2.
The reason for booking profit of only 6-8% is because the market direction is not sure at this point. So better to aim for 1:1 risk-reward and rotate your money in better opportunities.
It is an analysis video. Take your decision on your own.
If you have any questions or suggestions, please leave a comment below.
I will personally reply to every single comment!
If you enjoyed this analysis, I would definitely appreciate it, if you smash that like button and maybe consider following my channel.

Sunteck realty positional viewThe stock of Sunteck realty has recently given strong breakout from its ATH levels of around 535.
It has given a retest of the breakout level and currently consolidating from past few days.
We can see a fresh upmove above 590-595 levels.Also, stock can be accumalated at current price and added on dips upto 535 as Realty sector is expected to perform good in the next 2-3 years
This is just for educational purposes and my personal view based on technical analysis.

NEWGEN SOFTWARE - BuyHigh Probability Trade Setup
Buy NEWGEN Software above 620.
Risky traders can even buy around 600-610 range.
Stock looks good for mid-term.
Above 645, stock can blast and we can see 700++ levels as well. Refer chart for in detailed levels.
There is a gap created from 664 to 645, high probability of gap getting filled in coming week.
Good Volumes seen on the chart on Friday. Stock has retraced from 50%. High chances of 700 levels in coming days.

INDIA CEMENTS Monthly chart breakoutmomentum very strong long buildup swing trade
monthly chart resistance upside however

HDFC life - Breakout tradeKeep on radar for breakout trade.
A pullback and then a breakout will give an opportunity to go long.

DOUBLE YOUR MONEY PART 2NSE:APOLLO broke out from its base in weekly time frame after strong downtrend. Increasing volumes on the bullish side.
WAIT FOR CLOSING TOMORROW TO GET PROPER CANDLE CONFIRMATION ON WEEKLY TIMEFRAME.
Buy 30% position at C.M.P next week and rest after retrace on daily timeframe. Holding time is 1 year+.
Buy more at dips and breakouts as the uptrend continues.
Targets- 300/400/500+
Stop loss below 100 (position size accordingly now and then add more quantity after uptrend is established)
HAPPY TRADING!

BAT PATTERN IN BAJAJ AUTOBajaj Auto's weekly chart has formed Bullish Bat Pattern and currently, prices are trading near its Prz zone.
Sustaining the supports provided by the patterns, we could see a good bounce back in the stock towards 35500 levels

MAYUR UNQUOTERSWeekly BO in MAYURUNIQ perfectly and retested on support ,
good setup to go long ...
View more than 3 month.

Thyrocare: Buy If Closes & Holds 910 levels ahead [CMP 866.65]Another chart for study the price action;
Thyrocare: Buy Above 910 levels for Mid-Long term : CMP 866.65
TGT 1 = 1010,
TGT 2 = 1200,
ROI 1 = 11%
ROI 2 = 32%
Hold with Patience for Greater Reward, To Manage risk - Consult your Financial advisor

ITC Rallied - What's next ??ITC tumbled down from 262 levels to 222 levels.
It created support around 222 levels, tested it many times, and started rallying again.
Structure on the shorter timeframe is of higher highs and higher lows.
Today it rallied to around 245 levels, but couldn't sustain and closed around 239 levels.
Immediate support for the stock is around 237-238 levels, if it sustains these support levels, it will try to retest its previous highs again.

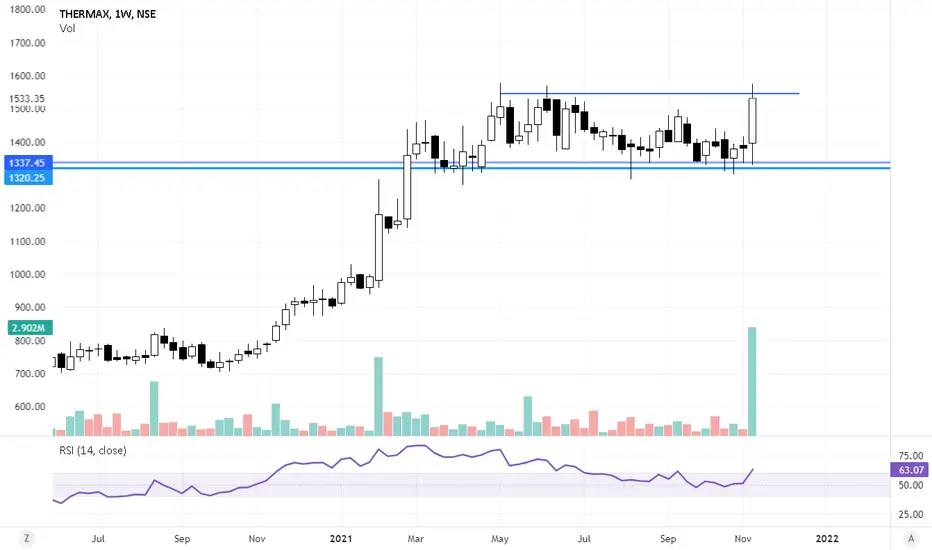
THERMAX - AT RESISTANCEThermax has been trading in a range since March 2021.
Currently, it is trading near the upper end of the range, any breakout on the upside might take stock to new highs.
CREDITACCESS - at supportThe stock is trading near its previous support levels .
Rsi is also at 40 support,
If held, the stock might move towards 700- 800 levels in the coming weeks.

ESAB INDIA Resistance breakoutVery simple setup.
We can see a Clear breakout above 2500, with good volume.
Stock can reach up to 2800 levels in the coming several sessions.
Below 2350 We can expect weakness.
Happy Trading

Deepak Nitrate looks good on weekly chartThe stock has taken support at 0.382 level on weekly chart. One can take a long position between 2230 - 2250.
Target - 2500 Stoploss - 2200
Risk : Reward - 1:5

FLAG AND POLE BREAKOUTThis will give good swing targets....also hold for positonal will update the target
KEY POINTS :
*Flag and pole pattern
*Bullish in daily in weekly
*Bigger targets than the sl

UJJIVAN SMALL FINANCE BANK Positional long 1 to 2 yearsUJJIVAN SMALL FINANCE BANK Positional long 1 to 2 years
Buy above 21 or buy on Dips best Buying/Accumulation Zone 18 to 22
Stop Loss below 16
Currently Its available at Covid Crash level and compared to similar Small Finance Banks under valued.
Disclaimer: These levels are purely based on Price action/demand and supply zones & and consumed only for educational purpose & should not be taken as buy/sell recommendation. I will not be responsible for any loss/profit incurred if anyone takes trades based on my views. Please consult your Financial Advisor before making any trading decision.
Leave a comment that is helpful or encouraging. Let's master the markets together.

SUPER ADAusdti believe cardano in these prices is going to be a memory! were heading right to the 3ed wave. the most exciting wave!

NiftyBank Futures Positional trading levels on daily time frameMajor Resistance 36887.05
Major Support 36472 to 36255
This is buying zone and Stop loss level for Positional long
Positional Longs Potential upside target of 1500 Points in Coming days
1st target 37274
2nd target 37782
3rd Target 38500
Short side target 35750 to 35700 Incase of breakdown below support level
short side 2nd target 35000 to 34800 incase of breakdown from 1st support zone.
Disclaimer: These levels are purely based on Price action/demand and supply zones & Technical Analysis and consumed only for educational purpose & should not be taken as buy/sell recommendation. I will not be responsible for any loss/profit incurred if anyone takes trades based on my views.
Please consult your Financial Advisor for before making trading decision.

Whirlpool - Bounced from SupportWhirlpool closed in positive last month forming a Bullish engulfing candle and managed to close above august month highs( hammer candle) another positive sign.
The structure of the stock is maintained as HH and HL
Volume was good both on the hammer as well on Bullish Engulfing Candle.
Now We have a support zone of 2130-2080 on the monthly chart. if the stock sustains the same, the stock might move towards its previous highs. ie. 2600- 2700 levels in the coming months.
Current levels: 2294
Type of Trade: Positional, Support trade

HDFCLIFE - Pullback TradeThis is excellent timing for a trade-in HDFC life, considering the stock did a breakout a few weeks ago and then started pulling back to the immediate support.
Last week stock formed at spinning candle at the support zone: 717- 725.
Currently, the stock is trading around 729, and if it sustains 700 levels, it mostly is then moving towards 788 and 833 in the coming weeks and months.
Type of Trade: Long -Positional, Pullback trade.

Triveni engineering - Uptrend continues after pauseConvincing long position
Buying in range 180_185
TGT1 207
TGT2 230
SL 159

ITC chart analysis for positional trade.......................................
(entry, exit, stop loss, identified )
