Monero[XMR] 80%+ short term Profits OpportunitySince May, Monero has been in an elliot correction wave. It seems the end for this correction is almost here and we did see an engulfing candlestick yesterday. Besides this its almost shaping out to form a falling wedge and it seems its almost on the end of forming a pattern.
Entry Level : 161000 sats - 166000 sats
Stop Losss 134000 sats
Possible Targets :
T1 : 194020 sats
T2 : 217710 sats
T3 : 236860 sats
T4 : 256010 sats
T5 : 283270 sats
T6 : 318000 sats
Good Luck.
Legal disclaimer:
Information on this channel is our team's analyst's "opinion" based on data available at this point in time. These opinions are not recommendations to buy or sell securities/commodities and cryptocurrencies. Trading and investing is a risk and you should not rely on this data to make any financial decisions. You must consult a financial advisory licensed by regulatory agencies in your legal jurisdiction. All information stated here and in our reports don't guarantee any possible profits or losses. Please do consider to do your own due diligence and research when making any kind of a transaction with financial implications. With Regards. TeamTWA.
Potential

USDCAD Potential Wedge breakout and Exhaustion On Monthly chartsPrice is looking to breakout of the Daily wedge formation. Looking at the image below (weekly charts) the price is also confined in the wedge and is looking to test the lower trendline soon after rejecting the upper trendline.
On the Monthly timeframe a strong resistance of 1.2800 has been broken and now acting as potential support. There have been around 3 strong bullish candles indicating the bulishness of the USD, however an exhaustion is likely to take place and bring the price down temporarily
In short, The USDCAD is showing signs of exhaustion on monthly timeframe and is looking to test the lower part of trendline on the weekly time frame. On the daily chart there is enough evidence and probability to suggest that a breakout is likely. Please be aware this is a just analysis and potential break of the wedge will be intensified if it breaks and retest the EMA 50 as well. When all the criteria is met a trade can be placed
FUNDAMENTAL ANALYSIS
As we all know USDCAD is a commodity currency and currently the oil market is in correction and most likely headed up. Any news regarding the OIL affects this pair greatly so always read up. Personally i am neutral fundamentally
Commitment Of Traders
Large speculators have been dumping the USD and are in favour of the CAD inspite of the bullishness of the USD. This is probably because the recent uptrend in OIL. In short its a good stage to go SHORT when the wedge breakouts but i expect the USD to resume its uptrend after the exhaustion has been processed.
Overall its a good position to go short and take advantage of the Exhaustion move that USDCAD has to offer
If you like my analysis please give a like and follow me if you would like to read more and learn from these charts. Any trade entries if valid and meets my criteria will be updated in their respective charts

Two Potential Long With Each Different Target & Risk/Reward !First LONG Trade has a 1/3 Risk/Reward Ratio with 2 Targets! Second LONG has a 1/4 Risk/Reward Ratio with 3 Targets! both waiting for retract level retest!


BITCOIN SUMMER TREND UPDATE - expecting more downmovement. BTC/ showed weakness after breaking multiple trend resistance lines. After the bullish move we saw a few weeks ago where bitcoin broke the longterm trend resistance, everyone was hopeful again. Nevertheless, we are now testing it as support at a much lower pricelevel.
I expect the bear trend to continue during this summer to finally look for Queen trendline.

series of higher lows still in tact, higher highs broken.We are still at this moment in a continuing series of higher lows on the 4hr which is good but we've actually had 2 lower highs in between those higher lows in a row so that coupled with a new potential head and shoulder pattern leaves rom for concern. I exited my position above the t line at around 7632 and only plan on getting back in around 7821 to play it safe. I may buy back in to accumulate more btc if it dips way low but I might just wait until it reaches this point and shows that it can clear some of these sell walls. That's my current approach. Good luck in whatever you choose to do, and remember this is not financial advice only me sharing my personal strategy that works best for me.

NXS: 4 hour chart- UPDATEAs expected, NXS had a pretty nice run, but I still think it has a ton of potential. This is a higher risk setup, but I think we're nearing the end of the sell-off after the Binance add. We're hitting strong support with a confluence of FIBS, the 200 EMA on the 4 hour, and decent RSI support. If it drops below the green box I will exit the trade.

Bullish butterfly pattern nn PNTV chart with target zonesAfter pointing out the pattern on twitter, I was asked where I see it going. I wasn't able to find much online as far as common targets for the butterfly pattern, other than points A and C. I used a common technique often used with other harmonic patterns to map out other significant resistance zones(drew a fib extension from point X to A, back down to X, then moved the bottom of it to point D). The XA leg added on top of point D is a common target for most harmonic patterns I've researched so far. Beyond that, the 1.27-1.68, 2.27-2.68, and so on are also common targets if bullish momentum continues. It just so happens that the 4.27 matches up perfectly with a very long-term trend line...

USOIL: WTI June 3 Trade Points For Week AheadWTI USOIL: June 3rd Trade Points for Week Ahead
Good call/bad call last week here. Was looking to close out the short as the week began at around the 66.48 line and then
reversed long from here looking for 69.48. A forlorn hope.The rally got as high as 68.63 before failing away to end the week
1 pip below the next key support at 65.55 - and busted out the long stop just under 66.47 for a few pips loss as it fell,
before a little bear closing at the end of the week to finish at 65.69.
This price action has left WTI on a knife edge, saved by the closing bell at the downside limit and in desperate need of
buyers right here to avoid a another plunge to 61.92 initially. Any fall below 65.40 can be shorted using a stop above the
66.48 line to begin with looking for 61.92 initial downside..Any subsequent fall below here will signal further weakness to
60.21 and later to 58.25 as we move through the summer months
Looking at upside potential from here, the 65.55-65.50 level is critical to the medium term trend. Bulls know full well this
is their last stand for the summer ahead. It may well try to rally away from here but am not looking to buy it again after
the pattern it's made since the last rally attempt.
But it may tempt contarians...in which case please use a stop only 10 or so pips under the lows of last week and be ready
to reverse short if broken. Am hoping for a good break lower here - but it may defy us a while longer yet if it can find some
respite right here. If so, be prepared wait a little longer still or perhaps consider setting an alert

GRC - Gridcoin possible growthLooking at previous satoshi cycles there is a lot of potential in this chart.
(This is not financial advice, this is a volatile market where anything can happen)

[ETH/USD] Price might find support around 400 zoneCryptocurrencies have been in a bear market the last period of time, but the momentum to the downside is running out of steam.
Price might settle down and find support at 400 and slowly create an uptrend again.
Just market cycles. Let's see what happens, I'll keep the chart updated

OIL last 10% up potential Oil is in a uptrend, but there is some big resistance at the 178 levels. I expect a correction when it hits those levels.

TRXBTC Binance Breakout potentialTRX has formed a bull pennant on the 4 hour chart. we could see a potential breakout very soon.
yesterday i posted this as a Bull flag. put as the trade develops it looks more like a pennant. the next resistance will be the 1049 mark just above.
with current market conditions we are not sure as to what kind of break out we will have and whether the breakout will be a big one.


Cloak/BTC first target 55%As we can see, cloak has broken from the 3 month long wedge. Vlume is rising up on the breakout, daily candle will be most likely closed above the breakout point and that would be the time for us to buy some. 0.0018 looks like a perfect entry. Close above 0.0002084 since today is the closing day of the weekend candle, would signify the possibility of this scenario to happen since it would be as well breakout from the huge cump and handle. I would therefore recommend cautious traders wait for that to happen. The last significant point is that Stoch RSI is just breaking to the upside on the dialy, and is already flying on the weekly. First target would be 0.032 which is measured from the break out of the handle. Then we can buy in cheaper, and go for the second target at 0.0062, which is measurment of the breakout from the 3 month wedge. In the best case we would achieve something around 250%. Play it safe, keep track of volume, and don't be too greedy.


Cardano VS Ethereum, How Far UP?Cardano has bottomed out at ETH 0.00026 forming a bullish divergence on the RSI oscillator. Price then started to move up, breaking above the downtrend trendline and the 50 Moving Average, suggesting the continuation of a long-term uptrend.
Considering the statistics of cryptocurrencies rising in x10 encasement, the nearest upside target of ADA/ETH is seen at ETH 0.0028, that is just over 10 times the price of the recent bottom, which was ETH 0.00026. Also, the target level corresponds to the 261.8% Fibonacci retracement level.
The x10 growth is expected during the currently starting wave up and should be the very first upside target. Break above it could send the price much higher, but it yet to be seen if the resistance will be rejected or not.

[RRT/BTC] Potential +300 Soon !!!Hi,
I watch RRT/BTC since January, now the pattern is close to the end of his road. I'm already in but it's not too late if you want to get some RRT (Bitfinex token - Recovery Right Tokens).
We need big volume for break the triangle pattern and MA100 but all it's possible many trader just wait for confirmation before buy..
Have a good day, GLHF.

Potential bearish breakdown of bearflag..dropped to necklineWe have tumbled to the neckline of the potential head and shoulders that magicpoopcan was warning everyone about. Many recent head and shouldrs and inverse ehad and shoulders have been fake outs but, considering an impending death cross is nearing this one may be legit...as you can see once it breaks under the enckline I'm going short with the intention of setting a stop loss a few pips above this so that if it tries to rebounc from here its not much of a loss. You choose your own aoth as this is not financial advice.

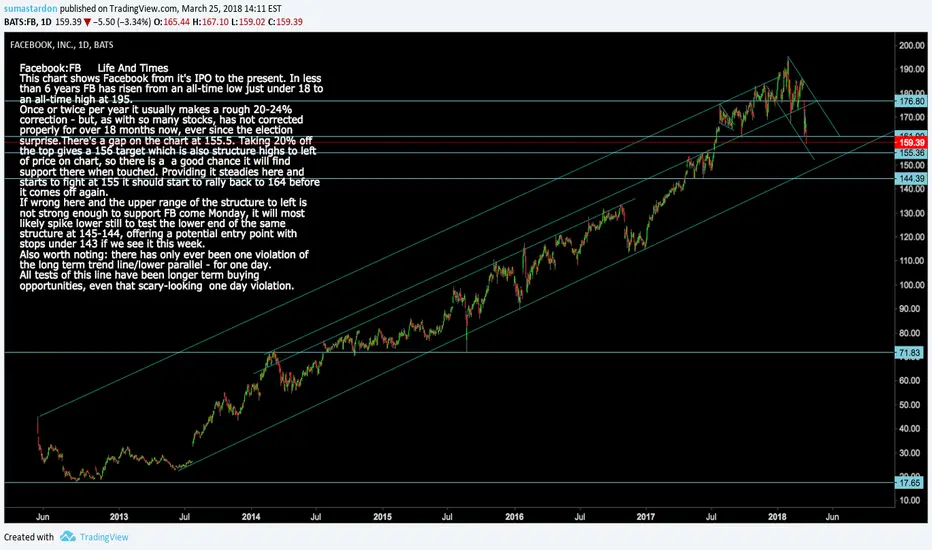
FB: Facebook Life and TimesFacebook:FB Life And Times
This chart shows Facebook from it's IPO to the present. In less
than 6 years FB has risen from an all-time low just under 18 to
an all-time high at 195.
Once or twice per year it usually makes a rough 20-24%
correction - but, as with so many stocks, has not corrected
properly for over 18 months now, ever since the election surprise.There's a gap on the chart at 155.5. Taking 20% off
the top gives a 156 target which is also structure highs to left
of price on chart, so there is a a good chance it will find
support there when touched. Providing it steadies here and
starts to fight at 155 it should start to rally back to 164 before
it comes off again.
If wrong here and the upper range of the structure to left is
not strong enough to support FB come Monday, it will most
likely spike lower still to test the lower end of the same
structure at 145-144, offering a potential entry point with
stops under 143 if we see it this week.
Also worth noting: there has only ever been one violation of
the long term trend line/lower parallel - for one day.
All tests of this line have been longer term buying
opportunities, even that scary-looking one day violation.
Cup and Handle on POA networkPOA network is one of the coins I am post passionate about. Also, I believe will do really well during this next altcoin rally. POA token is attractive to investors because they are a platform token with a brand new consensus mechanism, Proof of Authority. Proof of Authority, or POA puts identity up at stake instead of holdings. since everybody has only one identity, POA is very decentralized when it comes to their validators. Since other platform tokens with old consensus methods are evaluated in the billions, I believe there is huge potential for POA.
Yesterdays volume was the most since the coin ICO. Since the coin went to the upside, I think this is a big indication of a rally. Also, POA is holding its short term gains very well, which shows investors are not eager to sell anytime soon. A cup has formed after yesterdays rally and i believe a handle too.
The Project idea, the Volume, and the teacup pattern all indicate signs of a rally soon. I am hodling POA token for the altcoin rally, lets see where this ride takes us!

BITCOIN JUST BROKE OUT!? 50% PROFIT? WHAT DO YOU THINK?By looking at my chart we just broke the neckline of H&S which has been building up from the correction in january. If we work together we can go to moon! I encourage everybody make profit from here, but still you have to make your own research.
DISCLAIMER
This is not financial advise and make your own research!
