QuantumScape (QS): Cup-and-Handle Structure Intact – Handle LowsI wanted to share a technical perspective on QuantumScape (QS), as the Cup-and-Handle formation remains intact on the higher-timeframe chart.
From a pure price-action standpoint, QS has already completed a well-defined cup, marked by a rounded base following the prior drawdown, and is now trading at what appears to be the lower boundary of the handle consolidation. Historically, this phase represents controlled profit-taking rather than distribution, with volume typically contracting as weak hands exit and stronger holders accumulate.
Key technical observations:
The handle has retraced within acceptable Fibonacci bounds (generally 30–50% of the cup advance), preserving the bullish structure.
Price is consolidating above long-term structural support, suggesting the broader trend remains constructive.
Volatility compression during the handle phase often precedes directional expansion, particularly when aligned with improving sentiment or fundamental catalysts.
Momentum indicators on the daily/weekly timeframe are stabilizing, consistent with handle basing behavior rather than trend failure.
From a pattern-projection standpoint, the measured move of a confirmed cup-and-handle breakout typically targets the prior rim high plus the depth of the cup, which in QS’s case implies upside potential meaningfully above the $25 level once price resumes from the handle lows and reclaims resistance with volume confirmation.
In past market cycles, entries near the bottom of the handle have statistically offered some of the most favorable risk-reward profiles, provided the structure holds and invalidation levels are respected.
In short, the current zone appears to be a structural reset rather than a breakdown, and if the handle resolves to the upside as expected, QS has the technical setup to retest and exceed $25-$42 during the next impulsive leg.
Power

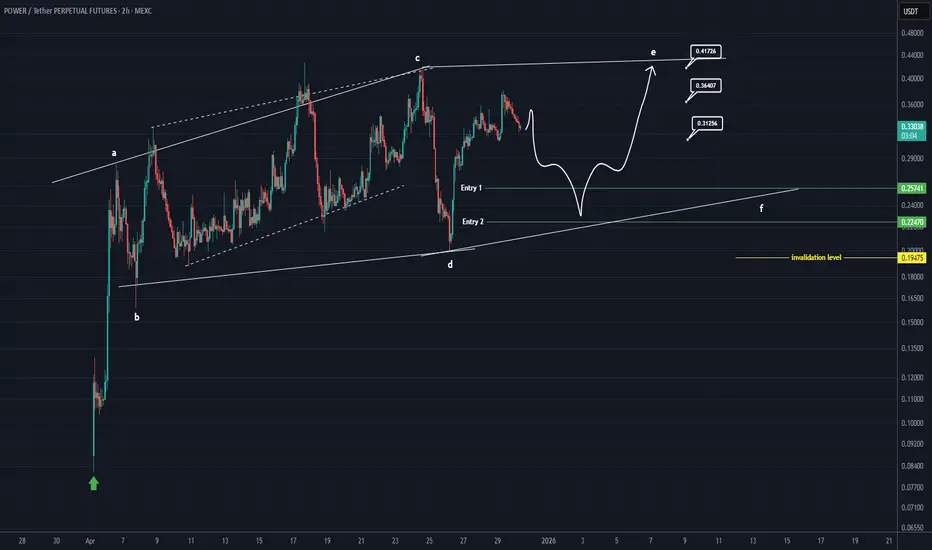
POWER Analysis (2H)Before anything else, you should know that this cryptocurrency is a bit volatile and risky, so make sure to manage your risk.
From the point where we placed the green arrow on the chart, it seems that this crypto has formed a diametric pattern. It appears that POWER is in a bullish diametric, currently at wave D or E.
To ride the bullish waves, you can enter a buy/long position at the points we have identified for entry. We have marked two entry points, and you should enter the position using DCA (Dollar-Cost Averaging).
The targets are indicated on the chart.
A daily candle closing below the invalidation level will invalidate this analysis.
If you have a coin or altcoin you want analyzed, first hit the like button and then comment its name so I can review it for you.
This is not a trade setup, as it has no precise stop-loss, stop, or target. I do not publish my trade setups here.
Combining Stage analysis with O.Kell momentum principles.1. every market has a stage. Peak -> trough. We use the logic of 50/200 crosses and the price action to determine where we are on a risk cycle (or stage).
Variables: the slope of 50, 200. Price action (extended? exhausted?)
2. Oliver Kell momentum principles (Qullamaggie uses 10/20/50 slopes). Kell uses 10/20 cross for a early indicator, that somewhat make sense (as ive always focused on "long" market "forces" only).
Price breaking above 10MA, before 10 breaks above 20. In that sense I think there's some game theory and leveling involved? but we can confirm using other markets (and fundamental news/change).
Beauty in this is to simplifying everything to very basics. When markets peak - it's simple things that make the difference. Call it "power law" or 20/80.
When markets on very lows.... 10/20 wouldnt matter 99% of time... but here it's possibly the most important indicator? (no?)

BIG PUMP - POWER🐂 LONG – POWER
Price is accelerating strongly on the 15m timeframe, supported by a clear expansion in trading volume—confirming aggressive buyer participation. This combination of momentum + volume often precedes an impulsive continuation move. The structure suggests accumulation has completed and POWER is entering a markup phase, with a high probability of a sharp upside expansion.
🎯 TP: 0.41229
🛡️ SL: 0.21291
📊 RR: 1 : 5.3
A momentum-driven long setup: rising price + volume confirmation → strong upside potential with attractive risk–reward.

Short idea So basically look for short at around 0.5 which is strong fib level, it could go further to it all time high to 0.8 , so calculate your risk based on worse case scenario. Let me know what you guys are doing long or short ...
HUT Uptrend intactNASDAQ:HUT A large bearish engulfing candle at major resistance saw the price drop back into the range. It is now attempting break-out once more.
Price remains in a firm uptrend at major resistance with not much to add.
🎯 Terminal target for the business cycle could see prices as high as $135 based on Fibonacci extensions
📈 Weekly RSI hit overbought and reset back to the EQ.
👉 Analysis is invalidated if we close back below the weekly 200EMA
Safe trading
IREN Well overextended.... deeper pullback before upsideNASDAQ:IREN Price has overextended in a macro wave 3, the strongest and most powerful move described as a “wonder to behold” by Elliotticians. Novice investors are likely to get over-confident in these conditions, enter without risk management and keep chasing the price upwards only to be underwater when it turns around.
Profit taking appears to be taking place. I have closed my positions and am waiting for re-entry. The weekly pivots have been run.
Initial downside targets for wave (4) have been hit $39, the next is 0.382, $26.43. Expect shorts to pile in, adding to any downside momentum.
In the long term, we have higher to go in wave (5).
🎯 Terminal target for the business cycle could see prices as high as $124 based on daily pivots
📈 Weekly RSI hit overbought with no divergence
👉 Analysis is invalidated if we continue into price discovery
Safe trading

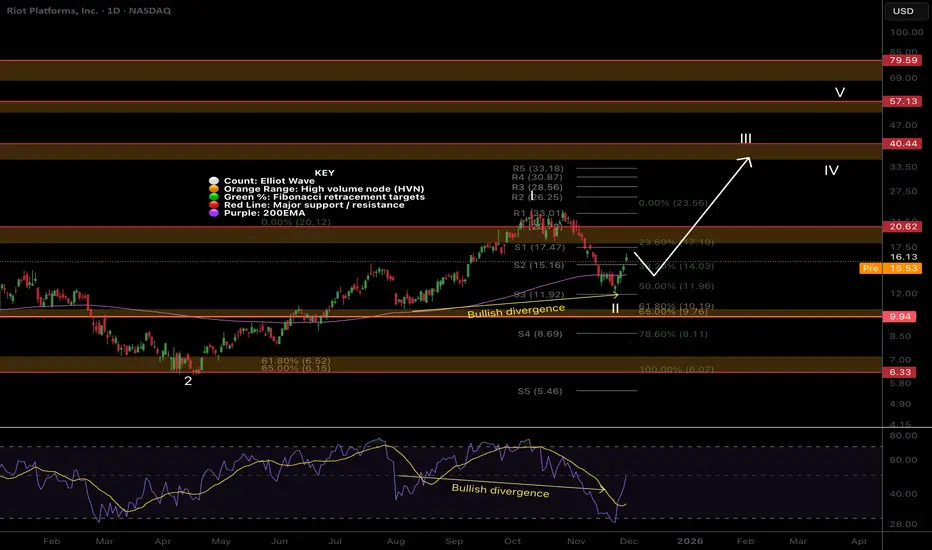
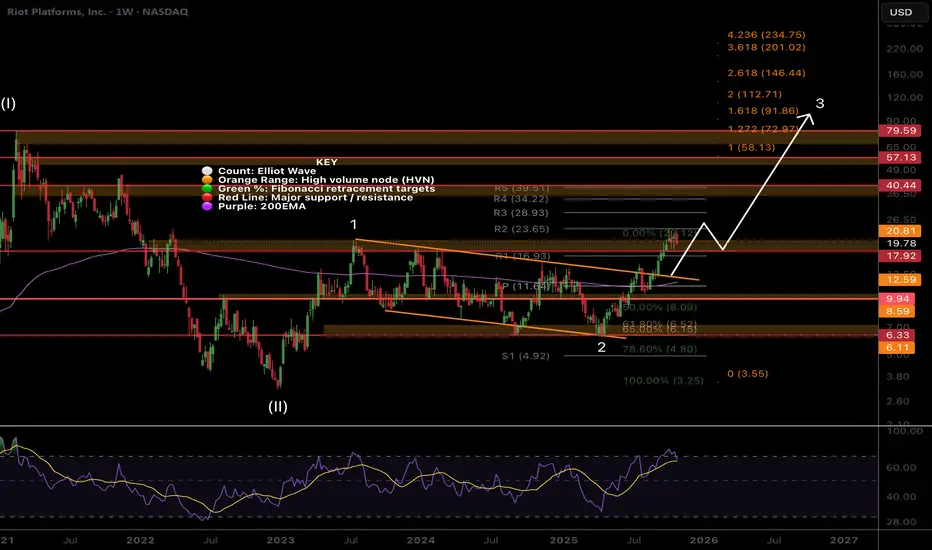
RIOT Macro outlook, weekly bullish divergenceNASDAQ:RIOT tested the upper boundary trend-line after its breakout. Expected behaviour.
A large weekly candle formed after hitting the weekly 200EMA and support suggesting the bottom is in.
Price remains above the downtrend and showed strength by poking above the wave 1 high.
🎯 Terminal target for the business cycle could see prices as high as $112 based on Fibonacci extensions
📈 Weekly RSI has bullish divergence
👉 Analysis is invalidated if we close below $6.33
Safe trading
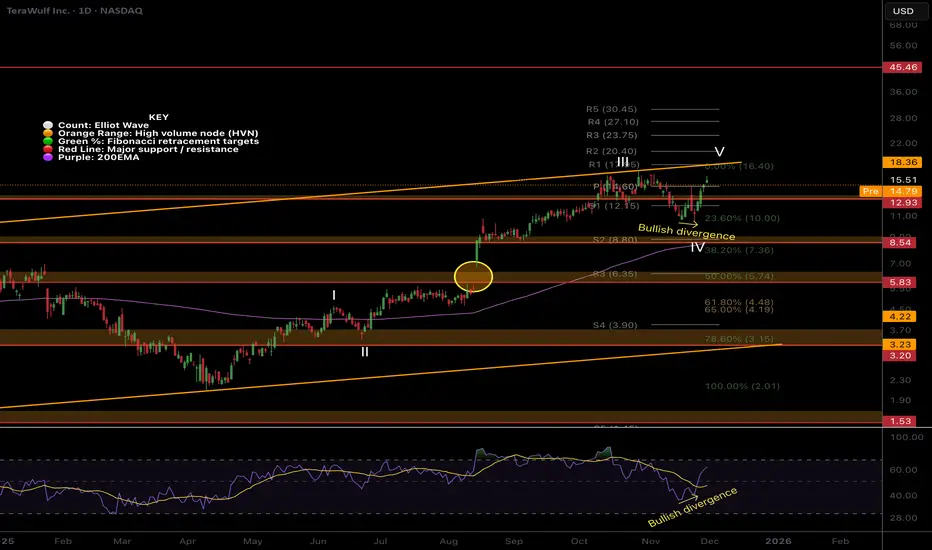
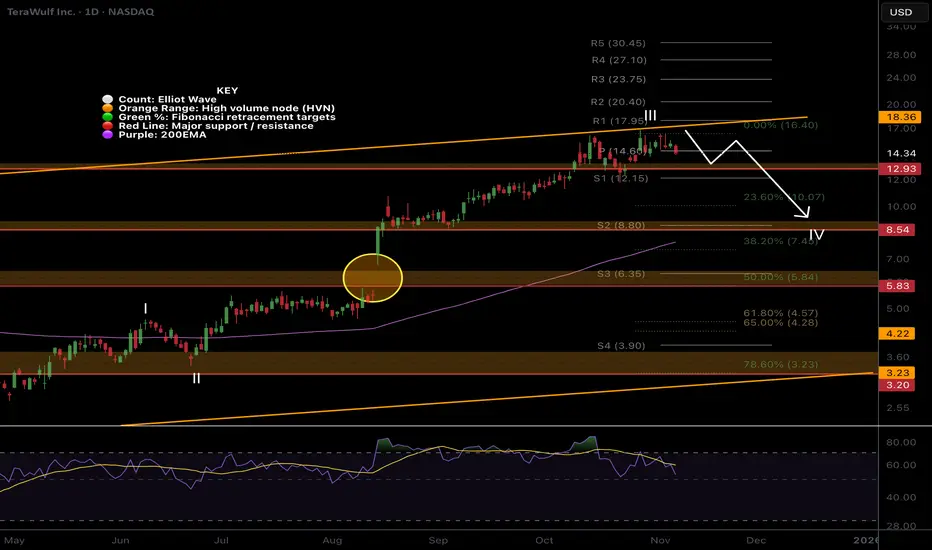
WULF LocalPrice caught a bid above the daily 200EMA on bullish divergence. It’s possible a triangle is forming for wave IV.
Price is stuck between the breakout upper-boundary and mean support, its hard to decipher the next direction as it stands. A breakout above the line could see it rally to $25 while back below wave IV would test the 200EMA.
📈 Daily RSI had confirmed bullish divergence but not from oversold
👉 Continued upside will invalidate this analysis.
Safe trading
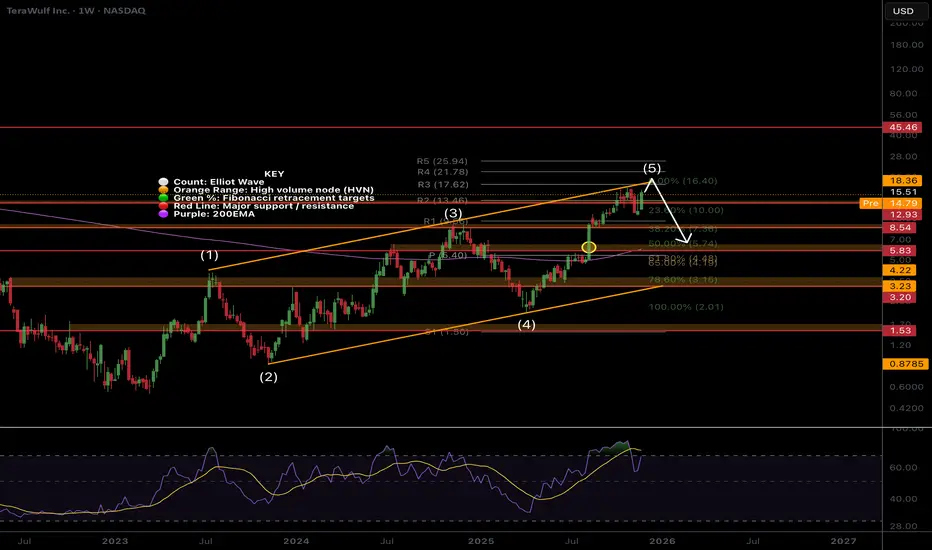
WULF Macro looks exhausted... pullback before higherNASDAQ:WULF Price appears exhausted at the upper channel boundary, and I have exited completely for now. The Elliot wave pattern completes a leading diagonal, which hints at higher to go after a deep wave 2 pullback, which could end at the 0.382 Fibonacci retracement, $8, but a more likely target is the 0.5 Fib at $5.84 with downside momentum. Also the weekly 200EMA.
Breaking out above the channel would change the count and structure and be very bullish. RSI has been overbought for a while. For now, I watch and wait.
🎯 Terminal target for the business cycle could see prices as high as $25 based on weekly pivots
📈 Weekly RSI is oversold with no divergence and can remain here for months as price keeps increasing.
👉 Analysis is invalidated if we close back above $20
Fair value sits at $11.
Safe trading
MARA struggling...NASDAQ:MARA Price dropped hard, changing the Elliott wave count completely, stopping at the golden pocket.
Wave (z) of B appears complete, but we need to see a structure change to add confirmation, so the probability is to the downside with a target of the $8 High Volume node.
📈 Daily RSI went deep into oversold
👉 Continued downside has a target of the High Volume Node, $8
Safe trading

IREN, still lower to go...NASDAQ:IREN wave 4 appears to want one more pusher lower towards the daily 200EMA and 0.382 Fibonacci retracement.
Price has broken its uptrend on bearish divergence and is yet to show strong support, suggesting we continue lower next week.
📈 Daily RSI has printed a bullish divergence, but not from oversold
👉 Continued downside has a target of the daily 200EMA, $26.75
Safe trading

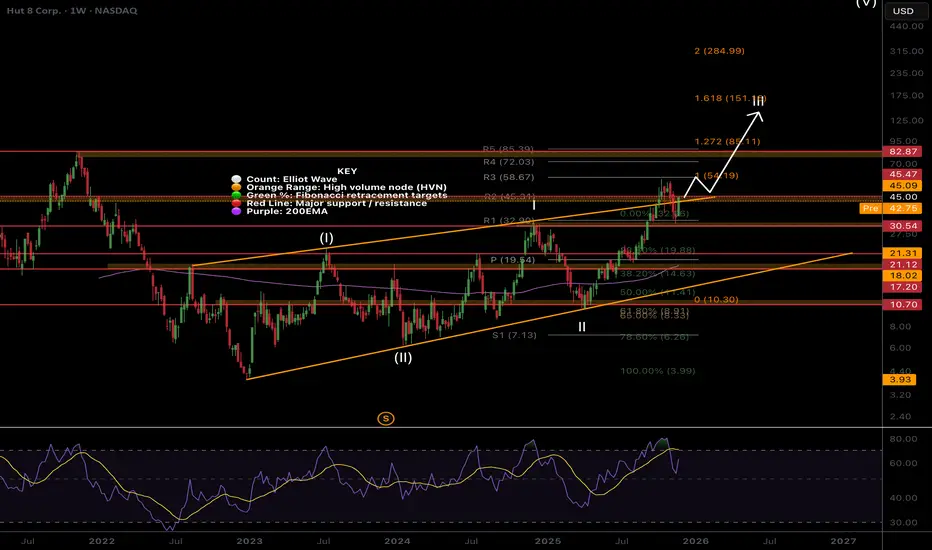
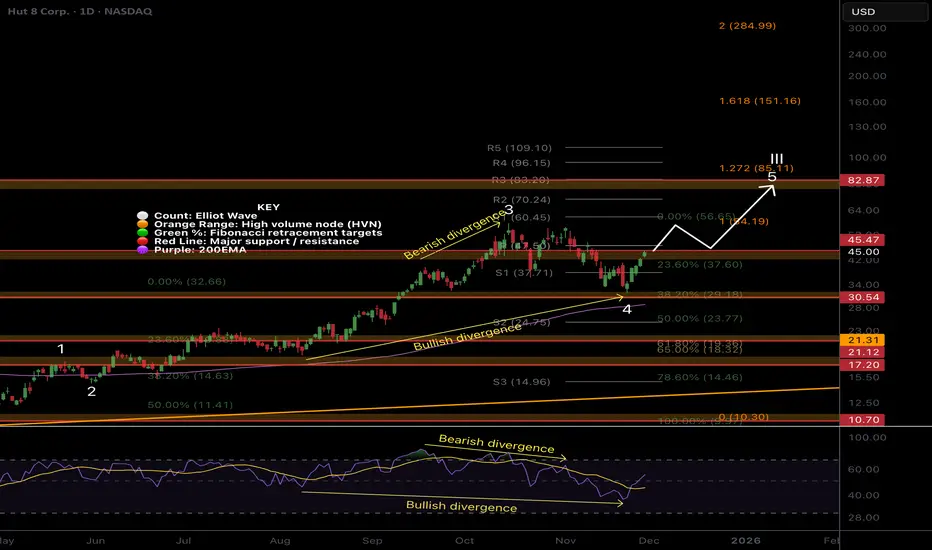
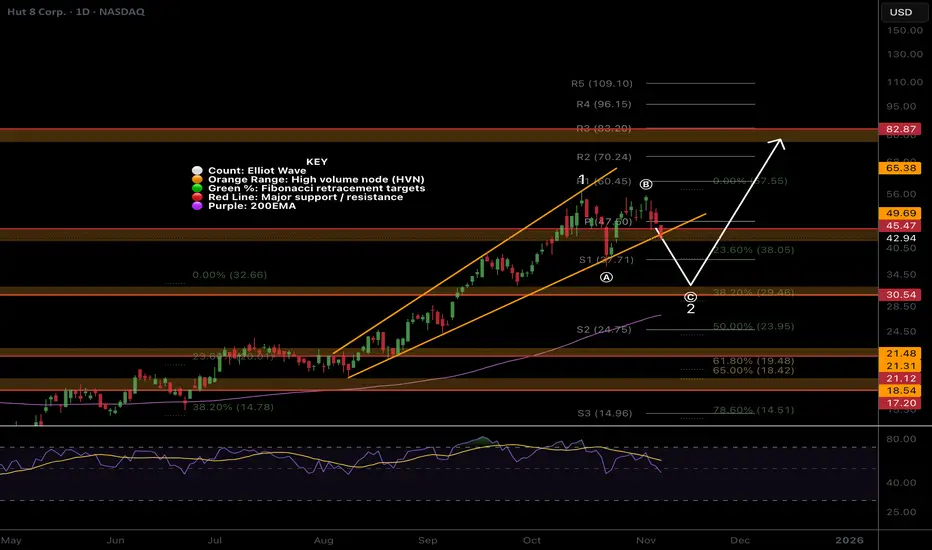
HUT ready for higher?NASDAQ:HUT Wave 4 appears complete at the 0.382 Fibonacci retracement and High Volume Node just above the daily 200EMA, proving its value by holding up better than the other assets.
Daily bearish divergence played out into bullish divergence as price caught a huge bid in the bullish, 3 white knights pattern. Resistance looms directly ahead, and a breakout above the daily pivot should see price head towards the $80 target High Volume Node.
📈 Daily RSI has printed a bullish divergence
👉 Continued downside has a target of the daily 200EMA, $28
Safe trading
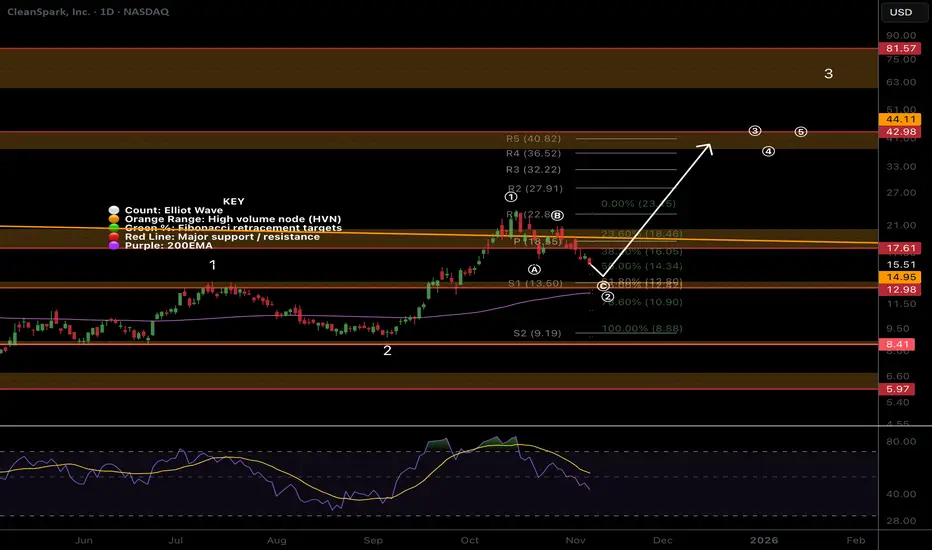
CLSK 3 white knights, bullish divergenceNASDAQ:CLSK Price fell a dollar shy of breaking the triangle wave D target, keeping the triangle alive. The 3 green candle structure below is an extremely bullish pattern called 3 white knights.
Wave (2) of the triangle breakout move looks complete at the low-cap golden pocket 0.782 Fib. Wave (3) should be strong and powerful. Breaking out above the descending trend-line is the goal to find momentum. The target is the High Volume Node resistance, $42
📈 Daily RSI has printed a confirmed bullish divergence from oversold.
👉 Continued downside has a target of the High Volume Node at $8.41
Safe trading

TIINDIA a strong fundamental company for mid to long termTIINDIA after making a high of 4500+ , stock corrected a lot and looks like a bottom has formed.
Right now immediate resistance is 3055-3080 then 3260 then 3560
Once this major resistance is taken out TIINDIA can hit back its previous high.
while support is at 2784.
this is a part of murugappa group which has strong presence in Tamil naidu region and has strong companies like CG power, shanti gear, chola fin and many other.

WULF pullback on the cards!Price is struggling at the trend-line boundary on bearish divergence suggesting wave III is complete and wave IV is soon underway.
Due to the size of the rally wave IV could be deep. The usual 0.382 target is down at $8 where it would meet the daily 200EMA.
Daily RSI has printed bearish divergence in overbought.
breaking out above the trend-line could be extremely bullish.
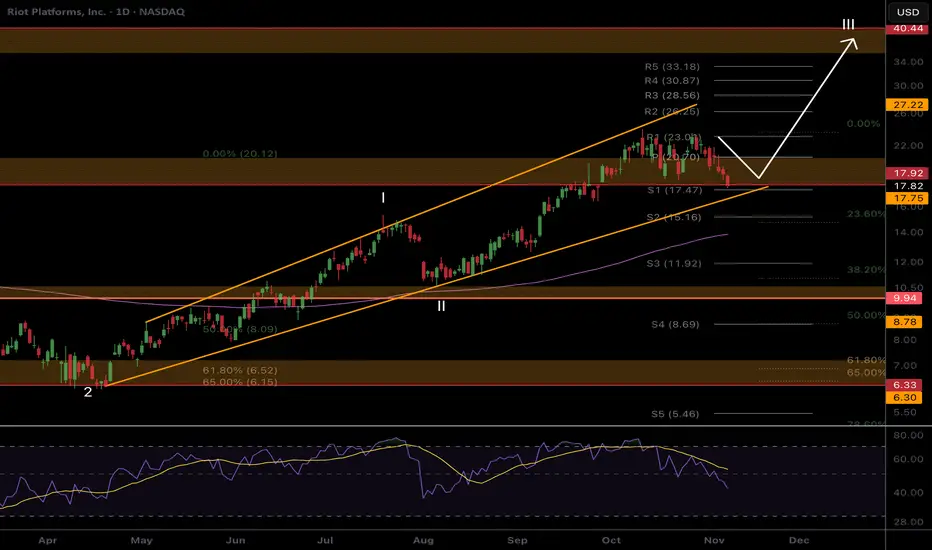
RIOT Respecting the boundariesPrice remains in its uptrend channel demonstrating shallow pullbacks as is characteristic of wave III.
Price is consolidating above support which could lead to a break down below but still within the boundaries of the channel. Daily 200EMA is ascending to meet price and support lines.
Daily RSI has printed unconfirmed bullish divergence at the EQ.
Continued upside has a $40 target at the next High Volume Node.
HUT Within channel boundary, all fine locallyNASDAQ:HUT Wave 1 appears complete at the channel upper boundary on bearish divergence.
For now the probability is to the upside and the trend is in tact. However, wave (B) of 2 looks complete. Wave C is expected to be strong and scary, capitulating many. Price is expected to terminate at the 0.382 Fibonacci retracement, High Volume Node support and rising daily 200EMA.
Daily RSI has printed bearish divergence from overbought but also bullish divergence at the EQ. This is ambigous.
Continued upside has a target os the $82 High Volume Node resistance.
CLSK Local analysis, pullback does not violate larger trendNASDAQ:CLSK Price is pulling after a failed breakout falling back into the macro triangle. Behaviour appears to be a textbook corrective ABC which should end with one more thrust down to the S1 pivot before continuation to the upside.
Wave © can be strong and powerful, often where investors capitulate. The target is the High Volume Node support, rising daily 200EMA, Fibonacci golden pocket and S1 pivot.
Daily RSI has room to fall.
Breaking above wave (B) would suggest the correction is over.
CIFR Pullback time?NASDAQ:CIFR Locally, price continues into price discovery with big jumps suggesting wave 3 is still going Wave (5) of 3 appears to be underway which could end at any moment. I am still expecting a retracement to test the previous all time high and punish late investors who are chasing prices up, trapping them into capitulation later.
Wave 4 has a downside target of the 0.236 Fibonacci retracement, High Volume Node support + the trend-line retest, $14. This may also meet the ascending daily 200EMA.
Daily RSI has a series of bearish divergence from overbought which a strong signal for a reversal.
Continued upside could run the daily pivots to $38.

BTDR Consolidation below support often leads to a breakoutNASDAQ:BTDR Locally, price is struggling at the expected High Volume Node resistance but without a major rejection. Consolidation below resistance often leads to a breakout
Wave (3) characteristics are being followed with shallow pullbacks so far. The target for a stronger downwards move is the golden pocket and S1 pivot at $17 which would meet the rising daily 200EMA, adding confluence to a local bottom. This would be normal and should be expected.
Daily RSI has printed unconfirmed bullish divergence at the EQ.
Continued upside would flip $25 resistance into support.

RIOT, nothing changed, Higher...Riot is another low cap volatile asset that keeps people afraid with its wild swings as I am seeing panic in my comments across platforms.
Price remains in momentum breaking out of the channel in a wave 3 with a minimum target of the 1.618 Fibonacci extension at $91, a 4x from here. Wave 2 completed at triple support- Fibonacci golden pocket, High Volume Node and channel boundary before quickly overcoming the weekly pivot and 200EMA. Breaking out above wave 1 is a show of strength.
Price should stall at the High Volume Nodes as supply comes in; $21, $40 and $57 but ultimately they should be overcome.
🎯 Terminal target for the business cycle could see prices as high as $112 based on Fibonacci extensions
📈 Weekly RSI is oversold with no divergence and can remain here for months as price keeps increasing.
👉 Analysis is invalidated if we close back below $9
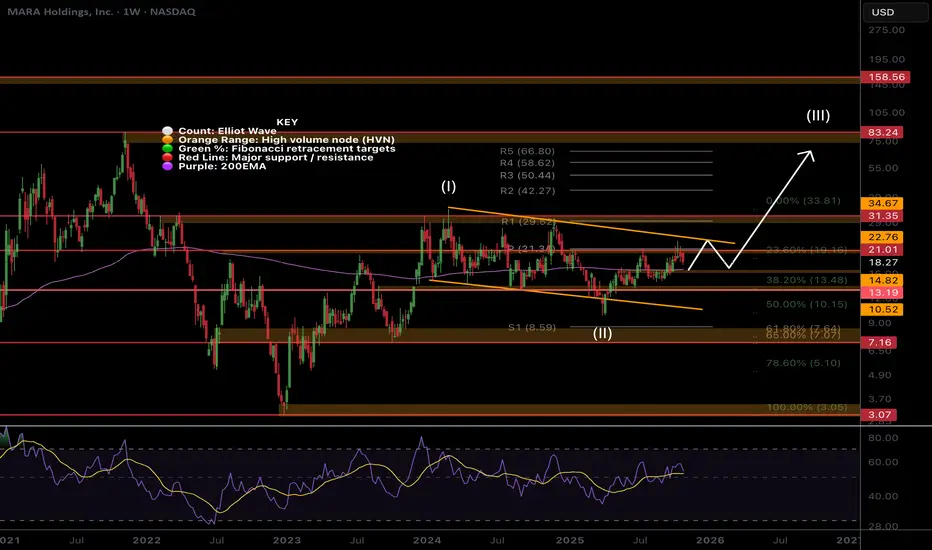
MARA boring... Investors cant waitMara has the potential for a strong move alongside Bitcoin but has ultimately been boring. Investors struggle the most with boredom and see is as negative and bearish. This is not the case and it could just be accumulating towards a strong breakout.
Price is stalling at the weekly pivot as expected but is above the 200EMA- a great buy spot. Wave (II) appears complete at the 0.5 Fibonacci retracement with a swing below the lower boundary trend-line. Wave 3 of (III) appears to be underway so I am looking for an aggressive breakout to the upside once we clear the current resistance. The R1 pivot is the first target at $30 where the last bit of major resistance is. Wave (III) has a target of $83 at the next major High Volume Node resistance, just above the R5 pivot.
🎯 Terminal target for the business cycle could see prices as high as $80 based on Fibonacci extensions and High Volume Nodes
📈 Weekly RSI is at the EQ.
👉 Analysis is invalidated if we close back below wave 2 at $9.50.