MARA Huge bullish engulfing!NASDAQ:MARA had a huge bullish engulfing candle yesterdays almost eclipsing 9 days of price action in 1 session, a characteristic candle for wave 3!
Partial take profit target for me is the High Volume Node between the R4 and R5 pivot, $20, where I expect price to struggle before more upside. Next target is $28 at the descending macro resistance trend-line.
RSI didn't hit overbought and was rejected back to EQ resetting for higher.
Safe trading
Power

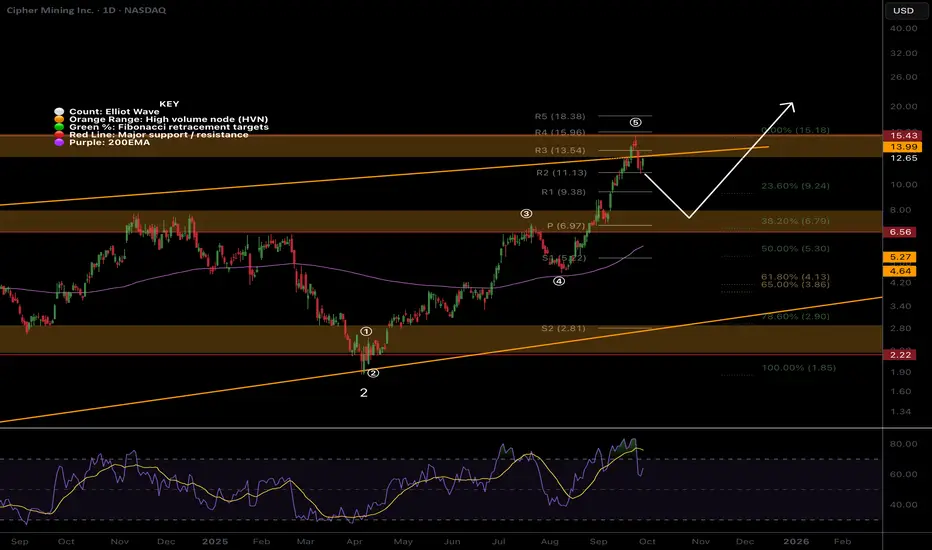
CIFR deep pullback before more upside?CIFR appears to have completed 5 waves for wave (1) of 3 completing at the previous all time High Volume Node where we expect Elliot wave 1s to complete. The orange channel boundary also had a throwover and drop back, an ending pattern!
Wave (2) has an expected shallow pullback of the 38.2 Fibonacci retracement at the daily pivot and High Volume Node support $7 where I will look out for long signals. The ascending 200EMA will also meet this point making it a quadruple support and an excellent opportunity area if price gets there!
If we continue into price discovery the analysis will be invalidated and I'll take a breakout long.
Daily RSI hit overbought but has since fell with no divergence.
Safe trading
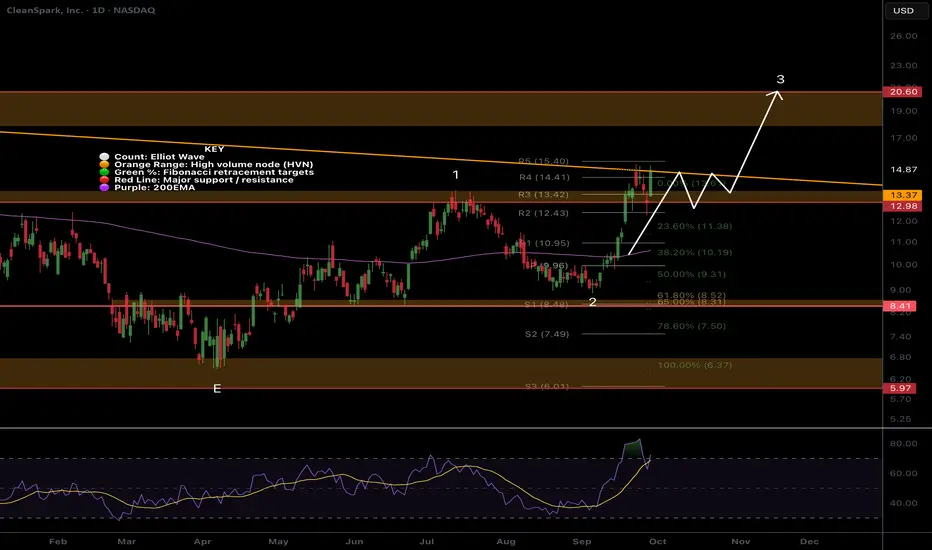
CLSK Attempting a significant resistance breakout!NASDAQ:CLSK has awoken at long last and has smashed through the wave 1 resistance High Volume Node straight into the Macro Triangle upper boundary i have been sharing in the weekly time frame posts. Breaking out above this and wave D at $20 will be a bullish signal with significant upside to come!
The High Volume Node resistance held as support in the big drop last week, quickly recovering back to highs showing strong demand.
The next local target is the wave D resistance $20 with continued upside in wave 3
Daily RSI is overbought but divergence yet and daily 200EMA has flicked positive.
Analysis is good unless we go back below wave 2 into the golden pocket.
Safe trading
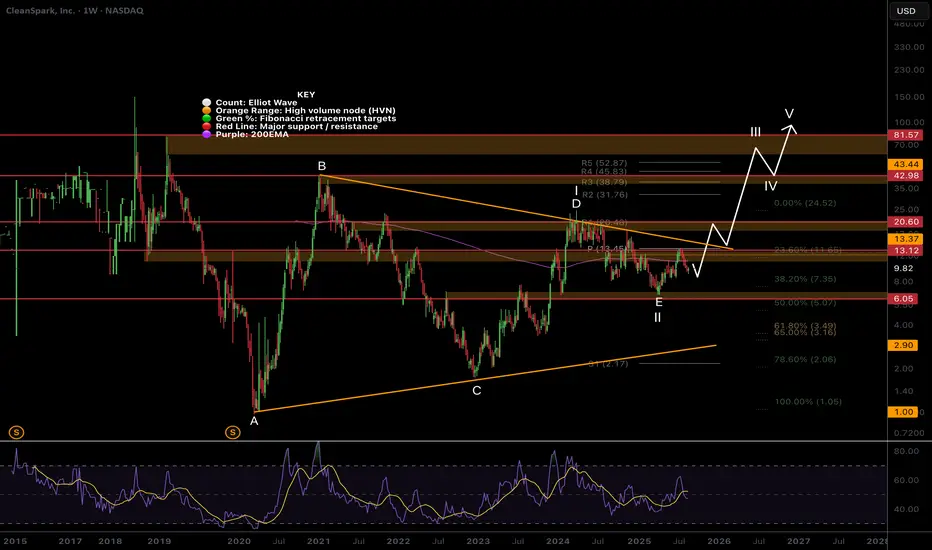
$CLSK Looks like XRP at $0.4 before the move to $3NASDAQ:CLSK is hated right now as much as XRP was when it ranged between $0.4-$0.8 for 4 years before it when ballistic.
CRYPTOCAP:XRP printed a huge macro triangle similar to what I have identified here for CLSK which looks complete at the triangle EQ, where wave E is expected to terminate! This finds confluence with the High Volume Node and 0.5 Fibonacci retracement.
Quadruple resistance lies ahead of the weekly 200EMA, major High Volume Node, weekly pivot point and descending resistance boundary, tested multiple times weakening the point. This built up pressure could provide an explosive move to price discovery.
I have left my alternative motif wave count on their as a secondary count (1-2) with similar targets.
RSI is at the channel EQ so plenty of upside left.
Analysis is invalidated below $6.05.
Safe trading
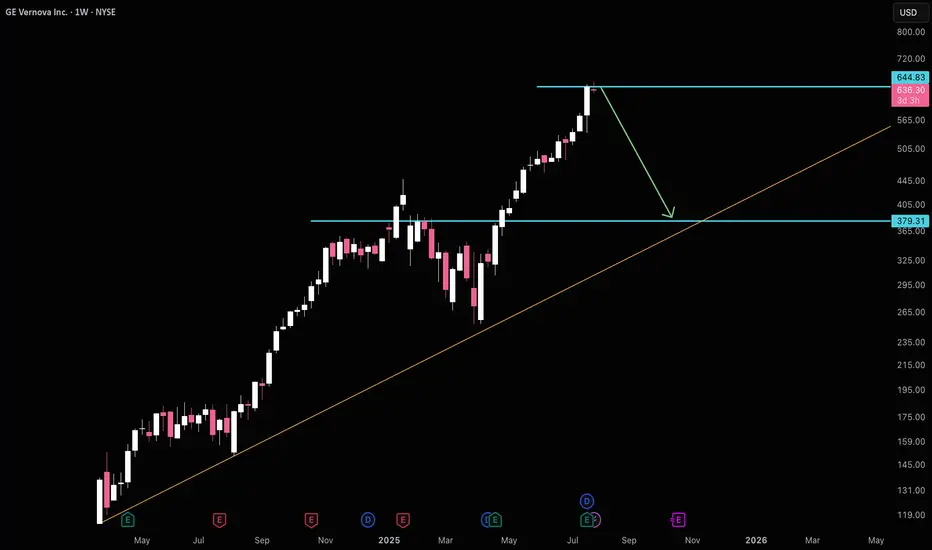
GEV High Risk $380GEV has a high risk of $380 at the moment. Obviously don't bet against the trend, especially while the S&P still has a lot of room to run, but it's an easy area to open some insurance for a potential fall to $380.
Good luck!
What’s America's Real Goal in a Possible India–Pakistan War?We are nearing the end of the petro-dollar era. The power balance of the new world order will be defined not by oil, but by the strategic resources essential for AI, electric vehicles, and cutting-edge technology.
Throughout the 20th century, the U.S. maintained its global dominance by controlling access to oil. From the Middle East to Latin America and Africa, wherever oil was found, the U.S. was there.
But today, the focus has shifted to rare earth elements, lithium, copper, and other strategic minerals.
Trump’s 2025 move to buy Greenland wasn’t a diplomatic joke—it was a signal. Behind-the-scenes deals in Ukraine for rare earth deposits tell the same story: whoever controls these "white gold" assets will lead the tech-driven world.
Now enters Pakistan, with mineral-rich lands spanning over 600,000 km², nearly three times the size of the UK. Experts estimate its underground reserves to be worth $8 trillion.
In Balochistan's Rekodik field alone, there are 12 million tons of copper and 20 million ounces of gold, with a copper purity of 0.53%, well above global standards. In the north, newly discovered lithium reserves could be a game-changer for the EV revolution.
This is no longer just about resources—this is about deciding the future balance of global power.

Power cement may double its valuePower cement may cross 20 and 25 level. Currently on 12. Note: this is not a buy sell call. Trade at your own will and use stop loss.

POWER CEMENT PERFECT SETUP FVG + HIGHER HIGH RETEST AND BREAKOUTPower cement fair value gap plus higher high retest at 9.75. also, there was an accumulation box on the higher time frame. the liquidity was resting in the higher high retest in the fair value gap. the stock absorbed all the liquidity at 9.75 and gave a breakout at 10.30, rallying quickly 8 percent in 2-3 hours. that’s how the smart money and the big institutes play!!

Nat Gas: Trading the WeatherNYMEX: Micro Henry Hub Natural Gas Futures ( CME_MINI:MNQ1! )
On December 31, 2024, the lead contract of NYMEX Henry Hub Natural Gas futures closed at $3.6330 per MMBtu. This marked a strong gain of 44.5% year-over-year, making it the best performing active futures contract for the year.
Nat Gas is one of the most actively traded commodities. According to CME Group:
• Henry Hub booked record trading volume in 2024. Average daily volumes for futures and options were 566,000 and 242,000 contracts, respectively.
• As of last Friday, Open Interests were 1,511,978 for futures and 775,176 for options.
The Basic
Natural gas is a leading energy source for global economy. While clean energy generates a lot of buzz these days, natural gas still carries the biggest load in power generation. The U.S. Energy Information Administration (EIA) estimates U.S. electricity production at 4.18 trillion kilowatt-hours in 2023.
• About 43.1% of the electricity was generated by natural gas.
• Nuclear power contributed to 18.6%, while coal had a 16.2% share.
• Combined, Renewables accounted for a 21.4% share, including 10.2% from Wind, 5.7% from Hydro, and 3.9% from Solar.
The price of a commodity is determined by its supply and demand. In the case of electricity, it is hard to store while its demand is highly unpredictable. New storage technology is limited by capacity and high cost. With Nat Gas being the biggest energy source, unforeseen changes in power demand could send shock waves into the market.
Weather factors, in particular temperature, have the biggest impact in power demand.
• In the summer months, the biggest power usage is for air conditioning cooling. Cooling Degree Day (CDD) is the number of days in a month where the average daily temperature is above 68 degrees Fahrenheit.
• In the winter months, the biggest power usage is for heating home and offices. Heating Degree Day (HDD) is the number of days in a month where the average daily temperature is below 68 degrees Fahrenheit.
Energy traders deploy CDD/HDD analysis and weather forecast models to predict temperature trends, electricity demand and the subsequent natural gas use.
The Weather Shocks
On December 29, 2024, the Weather Co. and Atmospheric G2 released a weather forecast for January showing colder than average temperature in the East, specifically from Florida to Maine as well as certain parts of the Great Lakes.
In a separate report, AccuWeather meteorologists said that the colder air could trigger a winter storm with substantial snow and ice for a significant portion of the month’s first half. They added that the drop will begin in the middle and latter part of next week.
When the futures market opened the next day, the price of Henry Hub futures surged 20%, hitting a new 52-week high of $4.20.
Earlier in the winter, Germany experienced the so-called “Dunkelflaute” with no wind and a clouded sky. This is the worst scenario for wind and solar power. As Germany is heavily reliant on renewable energy, when the weather fails to cooperate, its power supply drops by half, sending electricity prices sky high.
The huge supply gap prompted energy companies to turn on gas-fueled backup power plants, pushing the Dutch TTF ( NYMEX:TTF1! ) natural gas contracts to a record high.
At the time of this writing, severe winter storms are sweeping across the Central Plains in the U.S., bringing heavy snow, sleet, and frozen rain from Kansas to Missouri, Illinois, Indiana, Kentucky, Ohio and Washington, D.C. Apart from the winter hazards, I expect higher power consumption to keep people warm from the below-average temperatures.
Trading with Micro Henry Hub Futures
Micro Henry Hub natural gas futures (MNG) offer smaller-sized versions of CME Group’s liquid benchmark Henry Hub futures (NG) contracts. The Micro futures have a contract size of 1,000 MMBtu, which is 1/10th of the standard contract. The Micro contracts allow traders to control a large contract value with a small amount of capital.
With Friday settlement price of $3.354, each February contract (MNGG5) has a notional value of $3,354. Buying or selling one contract requires an initial margin of $366.
Since its Monday high, Henry Hub prices have plunged 20%. Subsequent updated weather forecasts now predicted warmer trends for the Eastern US, which could curb heating demand for Nat Gas. Losses accelerated last Friday after the EIA reported that Nat Gas inventories for the week of December 27th fell -116 bcf, a smaller draw than expectations of -128 bcf.
In my opinion, the draw was lower due to the reduced economic activity around the Christmas holiday. For the same token, we could see a smaller draw during the New Year. However, I consider this data seasonal outliners, rather than a longer-term trend.
Global warming doesn’t necessarily mean warmer winters. Higher global temperature brings moisture from the ocean, with wetter atmosphere generating more extreme weather events. I expect winter temperature patterns to shift to much colder-than-normal, with cool anomalies poised to stick around key population centers deep into the winter.
As we have seen in the past, unpredictable weather events could send large shocks to natural gas prices. With Micro Henry Hub contracts, traders could potentially realize sizable gains with a small capital requirement.
Hypothetically, if the February prices move up 10% to $3.689 with lower temperature forecasts, the $0.3354 price gain would translate into $335.4 for a long futures position, given the contract size at 1,000 MMBtu. Using the initial margin of $366 as a cost base, the trade would produce a theoretical return of 99.6% (=335.4/366).
The long futures position would lose money if Nat Gas prices continued to trend lower.
Happy Trading.
Disclaimers
*Trade ideas cited above are for illustration only, as an integral part of a case study to demonstrate the fundamental concepts in risk management under the market scenarios being discussed. They shall not be construed as investment recommendations or advice. Nor are they used to promote any specific products, or services.
CME Real-time Market Data help identify trading set-ups and express my market views. If you have futures in your trading portfolio, you can check out on CME Group data plans available that suit your trading needs www.tradingview.com

Power cement is flying to 11.5 level after flying over 8 levelPower cement monthly chart is showing these 2 important levels, It can go to 11.5 after crossing level of 8

PFC 2 Nov 24PFC 2 Nov 24
Monthly MC
Weekly Stochastic Over Sold Region after long time
Weekly Bullish RD
Daily Bullish Divergence

Genus Power Infra: Bullish Breakout – Buy now for higher targets🔍 Technical Analysis: NSE:GENUSPOWER (NSE: GENUSPOWER)
1️⃣ Overview:
📈 Current Market Price (CMP): ₹430.15 (+2.26%)
🗓️ Date & Time: As of 15:25 (UTC+5:30)
🕹️ Chart Analysis: Daily (1D)
2️⃣ Technical Indicators Overview:
📊 Moving Averages:
🟢 50-Day EMA: ₹399.89, currently acting as a support zone.
🔵 200-Day EMA: ₹332.71, indicating the longer-term trend remains positive.
📦 Volume Profile: Strong demand visible between ₹360-₹380, suggesting robust buying interest at lower levels.
📈 MACD: Bullish crossover with the MACD line above the signal line, implying momentum is still positive.
MACD Line: 3.76
Signal Line: 1.04
Histogram: 📈 Positive, indicating rising momentum.
📉 Williams %R (14): At -5.59, signaling overbought conditions, which might result in a short-term pullback.
💹 Stochastic RSI (14, 3): At 100, indicating strong bullish momentum, though caution is advised as overbought zones can precede minor corrections.
🟣 Parabolic SAR: Positioned below the price, supporting the ongoing uptrend.
3️⃣ Fibonacci Retracement Levels:
The stock is retracing from the swing high of ₹451.55 to the swing low of ₹351.05.
📐 38.2% Retracement: ₹399.30 – Strong support.
📐 50% Retracement: ₹414.05 – Intermediate resistance.
📐 61.8% Retracement: ₹428.80 – Currently breached, signaling bullish strength.
📐 78.6% Retracement: ₹442.80 – Next resistance level to watch .
4️⃣ Rationale for Buy:
🚀 Breakout above 61.8% Fibonacci Level: The breach above ₹428.80 indicates a potential continuation of the upward move.
🔥 Bullish Momentum: MACD crossover, Stochastic RSI in overbought territory, and Parabolic SAR below the price all point to a continuation of the bullish trend.
📈 Volume Surge: Increased volume activity supports the bullish move, suggesting robust buying interest.
📦 Demand Zone: The significant demand between ₹360-₹380 acts as a strong base, providing a good risk-reward opportunity for entry.
5️⃣ Recommendation:
🔔 Action: Buy
🎯 Target 1: ₹442.80 (78.6% Fibonacci Level)
🎯 Target 2: ₹451.55 (Recent Swing High)
🛑 Stop Loss: ₹414.05 (50% Fibonacci Level) to protect against downside risk.
6️⃣ Risk Management:
📥 Entry Strategy: Consider entering near the current price or on minor pullbacks towards the 61.8% retracement level (₹428.80).
⚖️ Risk-to-Reward Ratio: The trade setup offers a favorable risk-to-reward ratio of at least 1:2 based on defined targets and stop-loss levels.
⚠️ Disclaimer:
This analysis is based on technical indicators and market patterns and is intended for educational purposes. Market conditions may change, and this is not investment advice. Please conduct your own research or consult a financial advisor before making trading decisions.
#GenusPower 🚀 #TechnicalAnalysis 📊 #StockMarket 📈 #FibonacciLevels 📐 #SwingTrading 💹 #MACD 🔵 #StochasticRSI 💠 #VolumeProfile 📦 #BuyRecommendation 🛒 #IndianStocks 🇮🇳 #NSE 📉 #FinogentSolutions 💼

JPPOWERThis Stock is making a upward Triangle Pattern. If the Stock crosses 24 price mark. It can give a great momentum upwards.

#POWER/USDT#POWER
The price is moving within a descending channel pattern on the 4-hour frame and is expected to rise after it has been largely committed to it
We have a downtrend on the RSI indicator that is expected to break upwards and we have a trend to stabilize above it
We have a major support level in green at a price of 1900
We have a trend to stabilize above the moving average 100
Entry price 0.1920
First target 0.2046
Second target 0.2176
Third target 0.2346

SWING IDEA - SUZLON ENERGYA potential swing trade opportunity in Suzlon Energy - a leading renewable energy solutions provider in India.
Reasons are listed below :
Strong Support at 34-36 : Suzlon Energy has found a robust support level in the 34-36 range, indicating resilience and potential buying interest at these levels.
Bullish Engulfing Candle : A bullish engulfing candlestick pattern, confirming the hammer formed in the previous week, suggests potential upward momentum.
0.382 Fibonacci Support : Finding support at the 0.382 Fibonacci level reinforces the bullish outlook, providing a solid foundation for potential upward movement.
Trading Above 50 and 200 EMA : Suzlon Energy is trading above both the 50 and 200 Exponential Moving Averages (EMA), indicating positive momentum and potential bullish trend continuation.
Constant Higher Highs : The stock has been forming constant higher highs, reflecting a trend of increasing bullish momentum and reinforcing the potential for further gains.
Target - 49 // 60
Stoploss - weekly close below 35
DISCLAIMER -
Decisions to buy, sell, hold or trade in securities, commodities and other investments involve risk and are best made based on the advice of qualified financial professionals. Any trading in securities or other investments involves a risk of substantial losses. The practice of "Day Trading" involves particularly high risks and can cause you to lose substantial sums of money. Before undertaking any trading program, you should consult a qualified financial professional. Please consider carefully whether such trading is suitable for you in light of your financial condition and ability to bear financial risks. Under no circumstances shall we be liable for any loss or damage you or anyone else incurs as a result of any trading or investment activity that you or anyone else engages in based on any information or material you receive through TradingView or our services.
@visionary.growth.insights

Drax - Bearish DRAX broken out of a bullish triangle this week. Bearish in my book. Expect retest at around 548.
PS: This could also be a false breakout.
This is not a recommendation to trade. Do your own research and make your own decisions.

Power law and the halvening theory In 2021, I was convinced that the power law model had been broken and wrote it off as invalidated.
But when I turned on the halvening date indicator, it marked the exact top of the last market cycle.
Coincidence? I THINK NOT!
Get on the gravy train now! Next stop $300k motherfucker!

REC LIMITED
REC Ltd (Rural Electrification Corporation Limited) is a distinguished public sector company in India that plays a pivotal role in the country's power sector. With a mission to promote and finance rural electrification projects across India, REC Ltd has made significant contributions to enhancing the quality of life in rural areas. The company offers an array of financial products and services that support the development of power infrastructure, thereby fostering economic growth and sustainability. Known for its robust financial performance, innovative solutions, and commitment to corporate social responsibility, REC Ltd stands as a beacon of progress and reliability in the energy sector.
Entry at-524.65
Breakout-536.90
Target 1-558.10
Target 2-584.20
Target 3-601.10
STOP LOSS-499.25
Disclaimer - All information on this page is for educational purposes only,
we are not SEBI Registered, Please consult a SEBI registered financial advisor for your financial matters before investing And taking any decision. We are not responsible for any profit/loss you made.

BTC simple analysis: Elliot Wave fifth waveElliot Wave has been settled in D1 time frame. Waiting for fifth wave to finish on 300% of E.W. fibonacci.
Fibonacci is between 2 and 4 peak of E.W.
USD should become strong or BTC become weak, which, I believe it's what's going to happen.
SL behind 1 peak.
there's a chance that wednesday finish bearish.
Note: Trade wise 👍
think cold.

#POWER/USDT#POWER
The price is moving in a bearish channel on the 12-hour rem and is largely committed to it
The price rebounded well from the green support area at the 0.2600 support level, which is a strong level
We have a trend to hold above the Moving Average 100, which is strong support for the rise
We have very strong oversold saturation on the RSI indicator to support the rise, with a downtrend about to break higher
Entry price is 0.3000
The first target is 0.3717
The second target is 0.4100
The third goal is 0.4543

Long POWRWith BTC stabilizing above support, I think it goes to 70k next. This will drag ALTS up along with it. I am going to start dipping back into some of the previous positions which I was stopped out of with all the volatility. One such position was POWR. I like POWR here above the VRVP PoC and above that long-trending RSI support. I don't know if it will go to a dollar again but that will be my final target rn with profit taking along the way. Entry was .38 with a SL of .29 for a rrr of 7/1.

BUY RELIANCEBuy Reliance and hold it for 2-3 months. It is the largest company of BHARAT and also the most profitable company. It is a good company for investment purpose.

Long TATA POWERShort, mid and Long term targets of TATA power. No SL req.
DISCLAIMER: I am not a SEBI Reg. Analyst. Do your own research before trading or investing.
