$SPY & $SPX — Weekly Market-Moving Headlines Jan 26–30, 2026🔮 AMEX:SPY & SP:SPX — Weekly Market-Moving Headlines Jan 26–30, 2026
🌍 Market-Moving Themes
🥈 Silver Squeeze Momentum
Silver holds above 100 as industrial shortage and safe-haven demand collide
📣 Mega Cap Earnings Gauntlet
Microsoft Meta Tesla Apple Amazon earnings drive the AI narrative for the entire tape
🏦 Fed Week Volatility
FOMC decision and Powell press conference set the rate path into month end
💻 Chip Supply Reality Check
Intel shock keeps focus on capacity constraints across AI hardware supply chains
📉 End of Month Positioning
January flows and de-risking risk increase after major catalysts land
📊 Key U.S. Economic Data and Events ET
Monday Jan 26
- 8:30 AM Durable Goods Orders Nov delayed: 4.5%
- 8:30 AM Durable Goods ex Transportation Nov delayed
Tuesday Jan 27
- 10:00 AM Consumer Confidence Jan: 90.0
Wednesday Jan 28
- 2:00 PM FOMC Interest Rate Decision
- 2:30 PM Fed Chair Powell Press Conference
Thursday Jan 29
- 8:30 AM Initial Jobless Claims Jan 24: 209K
- 8:30 AM U.S. Trade Deficit Nov delayed: -45.1B
- 8:30 AM U.S. Productivity Q3 revised: 4.9%
- 10:00 AM Wholesale Inventories Nov delayed: 0.2%
- 10:00 AM Factory Orders Nov delayed: 1.1%
Friday Jan 30
- 8:30 AM PPI Dec delayed: 0.3%
- 8:30 AM Core PPI Dec delayed
- 8:30 AM PPI YoY
- 8:30 AM Core PPI YoY
- 9:45 AM Chicago Business Barometer PMI Jan: 42.0
- 1:30 PM St Louis Fed President Alberto Musalem speech
- 5:00 PM Fed Vice Chair for Supervision Michelle Bowman speech
⚠️ Disclaimer: For informational purposes only. Not financial advice.
📌 #SPY #SPX #FOMC #Powell #PPI #Macro #Earnings #Markets #Trading #Stocks #Options
PPI

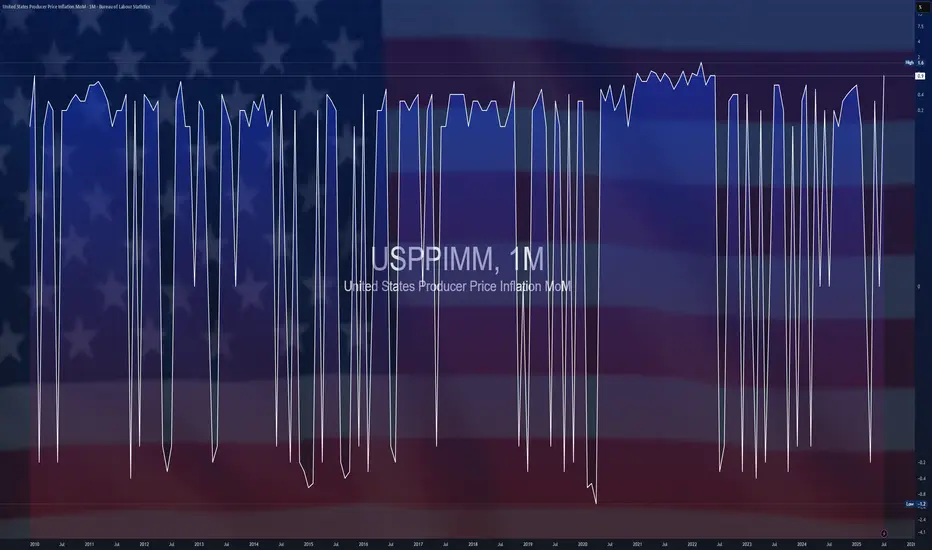
$USPPIMM - US Producer Inflation Picks Up (November/2025)ECONOMICS:USPPIMM
November/2025
source: source: U.S. Bureau of Labor Statistics
- U.S producer prices rose 0.2% month over month in November,
up from 0.1% in October and in line with expectations, delayed BLS data showed.
Core PPI was flat, below forecasts of a 0.2% increase.
On an annual basis, both headline and core producer inflation climbed to 3.0%, exceeding market expectations.

US100 M15 HTF FVG Reaction and Intraday Continuation Setup📝 Description
CAPITALCOM:US100 is holding above a short-term demand zone after a corrective pullback. Price is reacting positively from the M15 FVG, suggesting stabilization and potential continuation within the broader intraday structure.
________________________________________
📈 Signal / Analysis
Primary Bias: Bullish while price holds above the M15 FVG base
Preferred Setup:
• Entry: 25,690
• Stop Loss: Below 25,660
• TP1: 25,743
• TP2: 25,782
• TP3: 25,816 (HTF reaction / liquidity draw)
________________________________________
🎯 ICT & SMC Notes
• Reaction from M15 FVG confirms short-term demand
• No bearish BOS on lower timeframes
• Structure favors continuation after shallow pullback
________________________________________
🧩 Summary
As long as price holds above the intraday FVG, upside continuation toward higher liquidity remains the preferred scenario.
________________________________________
🌍 Fundamental Notes / Sentiment
Softer PPI reduces inflation pressure while strong Retail Sales support growth. This mix favors risk-on sentiment, keeping NASDAQ biased to the upside.
________________________________________
⚠️ Risk Disclosure
Trading involves substantial risk and may result in capital loss. This analysis is for educational purposes only and does not constitute financial advice. Always apply proper risk management, predefined stop-loss levels, and disciplined position sizing aligned with your trading plan.

ZB: 30 Year Treasuries Face a Defining Data Week The Long Bond and the Shifting Inflation Narrative
The ZB thirty year Treasury futures contract represents the long end of the United States Treasury yield curve and is primarily driven by expectations around inflation, growth, fiscal policy, and long term interest rate risk. Because of its long duration, ZB is the most sensitive Treasury product to changes in inflation expectations and shifts in term premium. When markets become concerned about persistent inflation or increased Treasury issuance, ZB tends to underperform. When growth risks rise or inflation pressures ease, ZB often attracts defensive demand.
Within the Treasury complex, ZB sits at the far end of the curve, while ZT two year, ZF five year, and ZN ten year futures reflect progressively shorter duration exposures. ZT is most reactive to Federal Reserve policy expectations, ZN tends to balance policy and growth considerations, and ZB expresses longer term confidence or concern about economic stability and inflation control. Over the past few months, sentiment in ZB has improved as inflation has moderated from prior highs and recession risks have remained present but not fully realized. The narrative since late spring has centered on easing tariff fears, slower but resilient growth, and a market that is gradually reassessing how restrictive policy needs to remain over the long run.
This week, macro data will be a major driver. CPI on January 13th, followed by PPI and retail sales on January 14th, will shape near term direction. A miss in CPI or PPI, particularly on core measures, would likely support ZB as it reinforces the idea that long term inflation pressures are cooling, allowing yields to drift lower. A beat in inflation or strong retail sales would pressure ZB lower, as it would revive concerns that growth and pricing power remain too firm for comfort at the long end of the curve.
What the Market has done
• Since bottoming out at the 109'14 area in May 2025 after tariff fears were alleviated, bids have stepped up and the market has steadily reclaimed the April Trump liberation tariff selloff.
• In September 2025, buyers were able to overcome sellers at 116’00, which was daily level 2 and a four month resistance level where sellers had previously defended.
• Subsequently, buyers were able to defend this level until the end of November, when bids slipped and sellers were able to offer prices down through the September 5, 2025 low value area and single print at 115'20 to 114'20.
• Since December, the market has been consolidating sideways within this zone, filling in and repairing the LVA as balance has developed.
What to expect in the coming week
The key level to watch is 115'25 to 116'00, which represents the previous week’s close, the current consolidation block high, and the over-under zone of daily level 2.
Neutral scenario
• Expect the market to continue consolidating in a tight range, potentially between 115'25 and 115'05, as participants wait for clarity from CPI on January 13th and PPI and retail sales on January 14th.
• In this scenario, rotational and mean reverting behavior should dominate, with responsive buyers and sellers active at range extremes.
Bearish scenario
• If the market is unable to accept above 116'00, expect a rotation back down through the consolidation block toward 114'18, which aligns with the range low and weekly one standard deviation low.
• This bearish scenario is likely to be very choppy and difficult to trade, as the market remains in balance within the broader 116 to 114'20 range.
Bullish scenario
• If the market is able to accept above 116'00, price could move up through offer block 1 toward 117'00, which represents the high of offer block 1 and the weekly one standard deviation high.
• In our opinion, this is the cleaner trade opportunity, as the market would be imbalancing out of the current balanced and composite value area, opening the door for directional follow through.
Conclusion
ZB sits at a critical decision point, balancing between a well repaired value area below and a clearly defined acceptance zone above. With CPI scheduled for January 13th, followed by PPI and retail sales on January 14th, the market is likely to remain patient until these releases provide clarity on inflation persistence and demand strength. A softer inflation print or weaker consumption data would support acceptance higher and reinforce the bullish imbalance scenario, while firmer data could keep ZB capped and pressure price back through the current consolidation. In our opinion, traders should focus on how price responds at 116'00 and 115'25 following the releases, as acceptance or rejection at these levels will likely define the next directional opportunity.
If you found this analysis useful, feel free to give a boost, comment, or share your own levels and scenarios below.
Disclaimer: This is not financial advice. Analysis is for educational purposes only; trade your own plan and manage risk.
Acronyms:
w - Weekly
VAH - Value Area High
VAL - Value Area Low
VPOC - Volume Point of Control
LVN - Low Value Node
HVN - High Value Node
LVA - Low Value Area
SP - Single print

BTC: 114.2k–116k Decision Zone into CPI__________________________________________________________________________________
Market Overview
__________________________________________________________________________________
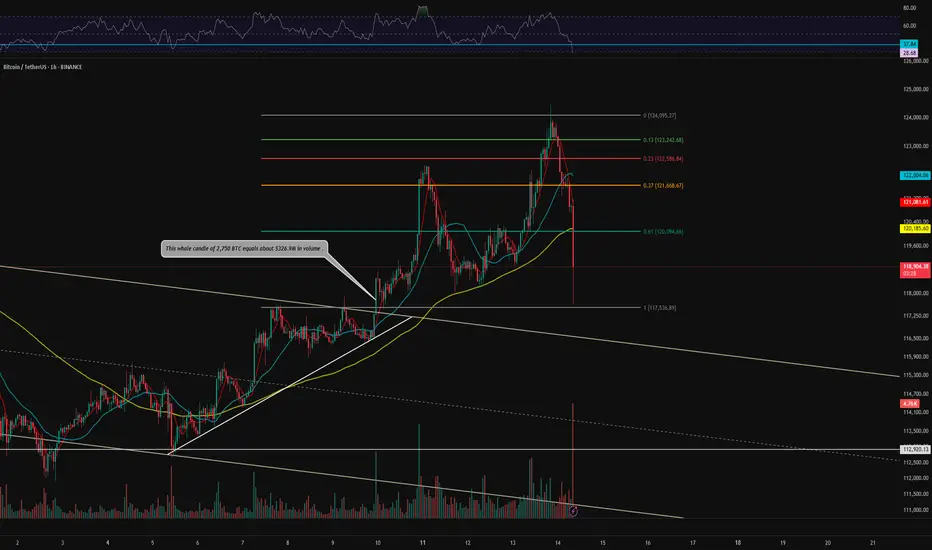
BTC is consolidating just below 114k after reclaiming 112k–112.5k, sitting in a 113.5k–114.5k decision zone. Intraday drives higher, while HTF remains cautious into CPI.
Momentum: Tactical bullish 📈 — higher highs/lows on 4H→1H, but capped below 114.2k–116k.
Key levels:
• Resistances (4H/1H): 114.2k–114.6k | (6H/12H): 115.5k–116.0k | (12H): 117.0k
• Supports (2H): 113.0k–113.2k | (W/4H): 111.9k–112.3k | (4H): 110.8k
Volumes: Normal on 1D/12H, Moderate on 4H/2H, Very high on 1H/30m/15m during impulses.
Multi-timeframe signals: 1D/12H MTFTI Up but broader caution; 4H/2H/1H in NEUTRE ACHAT with rising volumes; short‑term divergence as 12H is still hesitant.
Risk On / Risk Off Indicator: NEUTRE VENTE — a mild risk‑off backdrop that contradicts intraday momentum; watch for a flip to NEUTRE ACHAT to validate continuation.
__________________________________________________________________________________
Trading Playbook
__________________________________________________________________________________
Approach: favor continuation buys on breakout with quick invalidations while HTF remains mixed.
Global bias: Tactical NEUTRE ACHAT above 113.6k; swing invalidation if 111.9k then 110.8k break.
Opportunities:
• Breakout buy: 2H/4H close > 114.6k → aim 115.6k then 117k; stop 113.6k.
• Pullback buy: 112.2k–112.3k with absorption/volume → 114.6k / 115.8k / 117k; stop 111.5k.
• Tactical sell: failure below 114.3k + close < 113.0k → 111.9k then 110.8k; stop 113.6k.
Risk zones / invalidations: Repeated rejection below 114.3k followed by a 113.6k loss opens 112k; losing 111.9k then 110.8k invalidates the tactical bullish bias.
Macro catalysts (Twitter, Perplexity, news):
• US CPI Thursday: benign print supports a 114.6k break; hot CPI favors a fade under 114.3k.
• US labor softening: bolsters rate‑cut odds (tailwind if CPI undershoots).
• Pro‑crypto policy tone (SEC/HK): marginally improves regime if levels confirm.
Action plan:
• Entry: 114.65k (2H/4H close) / Stop: 113.60k / TP1: 115.60k, TP2: 117.00k, TP3: 118.50k
• Approx R/R: ~1.5R to TP1, ~3R to TP2; scale size if volumes stay Very high and Risk On / Risk Off Indicator flips ≥ NEUTRE ACHAT.
__________________________________________________________________________________
Multi-Timeframe Insights
__________________________________________________________________________________
Intraday risk‑on, HTF cautious: continuation is possible but needs regime confirmation.
1D/12H: MTFTI Up, yet backdrop “NEUTRE VENTE”; bounded between 111.9k–110.8k base and 114.2k–116k cap; daily HH above 113.5k needs confirmation.
6H: Ascending sequence from 110.8k; resistances 114.2k–114.6k then 115.5k–116k; pullback 112.2k–112.3k is attractive if volume confirms.
4H/2H/1H/30m/15m: NEUTRE ACHAT with rising volumes; breakout > 114.6k is primary setup; key divergence: Risk On / Risk Off Indicator still NEUTRE VENTE outside 15m → wait for confirmation.
__________________________________________________________________________________
Macro & On-Chain Drivers
__________________________________________________________________________________
Macro is the referee: CPI and weak labor frame risk, while on‑chain/crypto flows are constructive but demand confirmation.
Macro events: CPI in focus (moderate consensus); very weak US labor supports rate‑cut narrative; selective global risk‑on (Japan ATH, China recovery); pro‑crypto policy signals (SEC/HK) add a marginal tailwind.
Bitcoin analysis: Daily trend reclaimed >113.5k; immediate resistance 114.2k; acceptance >117k would open 124.3k extension; strong alt rotation can cap BTC’s relative upside; short clusters imply squeeze risk if breakout validates.
On-chain data: Accumulation 108k–116k (URPD); STH ~60% in profit = fragile neutral state; neutral funding (compression risk); slower spot ETF inflows — need a firm close >114.2k–116k to convert.
Expected impact: “Cool” CPI + pro‑crypto tone backs a breakout >114.6k; “hot” CPI favors a move back to 112k/110.8k.
__________________________________________________________________________________
Key Takeaways
__________________________________________________________________________________
Market at an inflection into CPI: intraday bullish, HTF cautious.
- Trend: tactically bullish, but needs confirmation above 114.6k (then 117k).
- Top setup: validated 2H/4H breakout > 114.6k with volume → 115.6k/117k; alternative pullback buy at 112.2k.
- Key macro: CPI and weak labor steer near‑term risk‑on/off.
Stay disciplined: wait for the signal or de‑risk pre‑event — invalidations are close, use them. 🚦

XAUUSD – PPI Ahead: Key Liquidity Levels & Trading Plan🚀 MMFLOW TRADING
Market View:
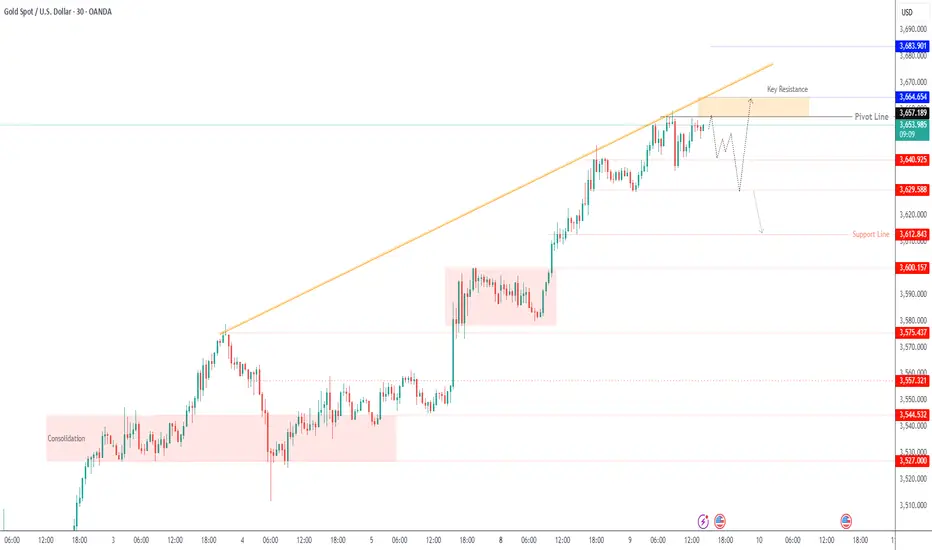
After yesterday’s sharp drop where sellers dominated the liquidity zone, gold (XAUUSD) is now recovering from 362x → 364x during the Asian session. In the short term, price may range between 362x–365x in Asia/Europe before going sideways to await the PPI release in the US session.
Today’s PPI is expected at 0.3% vs 0.9% previous, signalling cooling inflation. However, actual data could surprise higher – often creating a “news trap”. From a technical view, gold may need to revisit 360x liquidity before resuming its uptrend ahead of CPI & the upcoming FED meeting.
👉 In short: Structure remains bullish, but short-term liquidity sweeps are likely before any continuation move.
Key Levels:
Resistance: 3647 – 3654 – 3665 – 3674 – 3704
Support: 3635 – 3613 – 3600 – 3586
Trading Plan:
🔵 BUY Zone: 3600 – 3598
SL: 3592 (or tighter at 3580)
TP: 3605 → 3610 → 3615 → 3620 → 3630 → 3640 → 3650+
🔴 SELL Zone: 3703 – 3705
SL: 3710
TP: 3698 → 3694 → 3690 → 3680 → 3670 → 3660+
Summary:
✅ Gold remains in an uptrend, but may retest 360x liquidity before heading higher.
✅ PPI today & CPI tomorrow could act as a “news trap” – caution is required.
👉 Watch the key levels and follow MMFLOW TRADING for real-time updates & BIGWIN setups!

Gold : Neutral Between 3,640–3,657, Breakout to DecideGold – Overview
Gold hit a fresh record high at $3,659 on Tuesday, supported by weak U.S. jobs data and growing bets on Fed rate cuts. Traders now await key U.S. inflation releases – PPI on Wednesday and CPI on Thursday – which could drive the next major move.
📊 If inflation comes in hotter than expected, gold risks a sharp correction.
📊 If inflation is weaker, expectations for a 50 bps Fed rate cut could lift gold further.
Technical Outlook:
🔻 While below 3,657, price may correct toward 3,640. A 15M close below 3,640 would extend the decline to 3,629.
🔺 Stability above 3,657 on a 15M close would support further upside toward 3,665 → 3,683.
Key Levels:
Pivot: 3,657
Support: 3,640 – 3,629 – 3,612
Resistance: 3,665 – 3,683
previous idea:
ETH 4H Analysis - Key Triggers Ahead | Day 18😃 Hey , how's it going ? Come over here — Satoshi got something for you!
⏰ We’re analyzing BTC on the 1-Hour timeframe.
🔭 On the 4-hour timeframe of Ethereum we can see that ETH is clearly in a very strong consolidation, and for several days even the oscillator has been ranging around the 50 zone. This time-based range will eventually come to an end. Ethereum now has two important levels ahead with the upcoming news: the top of the box midline at $4373, where breaking this zone could trigger a strong pump, and the bottom zone, which is a maker-buyer area at $4252, considered a very strong and important support for Ethereum.
⛏ The key RSI levels for Ethereum are at 57 and 40. If the range of oscillation crosses these levels, ETH could gain more volatility and even move toward its overbought or oversold regions. Usually, this type of short-term consolidation ends with a good price move once the compression is broken.
💰 The size, volume, and number of green candles have really decreased, and multiple candles inside the range have formed, creating a decision-making phase for ETH. With today’s PPI news, it is likely that one of these zones will either be touched or broken, and after this news, candles are expected to come with stronger volume.
🪙 On the 4-hour timeframe of the ETHBTC trading pair we can see that it is in a descending continuation channel. Each time the price has reached the top or bottom of this channel, it has reacted with a reversal and then moved in the opposite direction. Currently, ETHBTC is above its midline and has shown a positive reaction to it. The volatility of this pair has significantly decreased in recent days and is now ranging under its 50 zone. A breakout above the channel top and the 0.03893 level could start a bullish move.
💡 The zones we are considering for Ethereum’s top and bottom are $4493 and $4252. Breaking either of these levels after this multi-day consolidation could start a strong trend and even a sharp directional move! Keep in mind that war and economic news have created interconnections for risky markets—trade with low risk.
❤️ Disclaimer : This analysis is purely based on my personal opinion and I only trade if the stated triggers are activated .

US PPI Data Preview (Aug 2025) – Impact on USD, Gold, and Fed RaThe US Producer Price Index (PPI) for August 2025 will be released on September 10th. PPI measures the prices producers receive for goods and services, making it one of the earliest indicators of inflation trends.
July 2025 Recap
PPI MoM: +0.9% (biggest jump in 5 months, mainly services)
PPI YoY: +3.3% (highest since early 2025)
Core PPI (ex-food & energy): +0.9%
Core-Core PPI: +0.6% (largest since 2022)
The surge was driven by service costs and tariffs on goods.
What to Expect in August
Headline PPI MoM: Likely 0.2% – 0.4% (a slowdown after July’s spike)
Core PPI MoM: Around 0.3% – 0.5% (services stabilizing)
PPI YoY: Could ease to 2.8% – 3.2%
Tariffs, energy prices, and service costs remain the key risks.
Why This Matters for Markets
If PPI comes in hotter than expected, inflation fears rise → less chance of a Fed rate cut → USD stronger, Gold weaker, stocks cautious.
If PPI is softer, markets may price in a September Fed cut → USD weaker, Gold and risk assets supported.
Core-Core PPI (ex-food, energy, trade services) is critical to see the real inflation trend.
Market Watch
Dollar Index (DXY): Could gain on strong PPI, slip on weak PPI.
EUR/USD: Around 1.16 – sensitive to inflation data & Fed bets.
Gold (XAU/USD): Likely to benefit from weaker data and safe-haven flows.
S&P 500 / Stocks: Bullish if inflation cools, cautious if hot.
Conclusion:
August PPI is expected to cool slightly after July’s jump. If inflation pressure eases, the Fed may stick to rate cut plans, which could lift Gold and risk assets. But if service and tariff costs stay high, expect the Dollar and yields to rise.
👉 What do you think? Will the PPI surprise higher and boost the Dollar, or cool down and give Gold a push?
#PPI #USD #Gold #Forex #Fed #Inflation #Trading #tradewithdecrypters

$SPY / $SPX Scenarios — Wednesday, Sept 10, 2025🔮 AMEX:SPY / SP:SPX Scenarios — Wednesday, Sept 10, 2025 🔮
🌍 Market-Moving Headlines
🚩 PPI Hits: August Producer Price Index at 8:30 AM — critical input for inflation trend into CPI (Thu).
📈 Yields in focus: Bond market watching supply + inflation mix; $TLT/ TVC:TNX extra sensitive.
💬 Fed chatter: Post-Apple event, markets shift back to Fed data dependency into next week’s FOMC.
📊 Key Data & Events (ET)
⏰ 🚩 8:30 AM — Producer Price Index (PPI, Aug)
⏰ 7:00 AM — MBA Mortgage Applications (weekly)
⏰ 10:30 AM — EIA Petroleum Status Report
⚠️ Disclaimer: Educational/informational only — not financial advice.
📌 #trading #stockmarket #SPY #SPX #PPI #inflation #Fed #bonds #energy #economy

NAS100 - Stock Market, Waiting for Inflation Index?!The index is above EMA200 and EMA50 on the one-hour timeframe and is in its long-term ascending channel. If the drawn upward trend line is maintained, we can expect Nasdaq to reach its previous ATH. In case of its valid breakdown, its downward path will be smoothed to the specified demand zone, where it can be bought with appropriate risk-reward.
U.S. equities closed lower on Friday after a volatile session, capping off a turbulent week in negative territory. Initially, weaker-than-expected employment data fueled optimism that the Federal Reserve would move toward further rate cuts. However, growing fears of an economic recession quickly overshadowed that optimism and pushed the indexes into the red.
Following the labor market report, expectations for a 25-basis-point rate cut at the Fed’s September meeting are now virtually certain. The main question, however, is how fast subsequent cuts might unfold. Some analysts have even floated the possibility of a surprise 50-basis-point cut on September 17. Fed Chair Jerome Powell, speaking at the Jackson Hole symposium, stressed that risks stemming from labor market weakness may now outweigh inflation risks—a factor that could justify a shift in the central bank’s policy approach.
Nick Timiraos, a prominent Wall Street Journal reporter closely tracking Fed policy, noted that the sharp slowdown in job growth over the summer has likely cemented the Fed’s decision to cut rates by 25 basis points in the upcoming meeting.
Still, he made no explicit mention of a 50-basis-point move. While markets have raised the probability of that scenario to 14%, Timiraos believes the main focus remains on a more moderate reduction. He also observed that the latest jobs report has deepened uncertainty over the pace and scope of cuts beyond September—a challenge that policymakers and markets will grapple with in the months ahead.
Barclays Bank now projects the Fed will lower rates three times in 2025—each time by 25 basis points in September, October, and December. This is an upward revision from its earlier forecast of just two cuts in September and December.
President Donald Trump once again lashed out at Fed policy in a post on his social media platform, writing: “Jerome Powell should have cut rates long ago. But as usual, he has acted too late.”
Meanwhile, mounting concerns over ballooning fiscal deficits—not only in the U.S. but also in countries like Japan, France, and the U.K.—have placed added pressure on long-dated bonds. The yield on the 30-year U.S. Treasury briefly climbed to a one-and-a-half-month high last week. At the same time, the Treasury Department plans to issue new three-year, ten-year, and thirty-year securities next week, an event that could further fuel volatility in the bond market.
The coming week will be light in terms of data volume, yet the few scheduled releases will carry significant weight as inflation once again takes center stage. On Wednesday, the Producer Price Index (PPI) for August will be published. Forecasts suggest both the headline and core readings will show sharp declines compared to July.
On Thursday, the European Central Bank (ECB) will hold its policy meeting, where markets currently expect the deposit rate to remain unchanged at 2.15%. Shortly afterward, traders will turn their attention to the U.S. Consumer Price Index (CPI) for August, along with weekly jobless claims data—closely monitored for signs of potential weakness in the U.S. labor market.
Finally, on Friday, the preliminary University of Michigan Consumer Sentiment Index will be released. This survey has been a particularly important gauge of inflation expectations this year, offering deeper insights into how U.S. households perceive price trends.
The PPI, which reflects changes in goods prices at the factory gate, often provides more forward-looking signals than the CPI. As shown in July’s data, any unexpected surge in August’s numbers could temper investors’ optimism about the pace of rate cuts. For now, the impact of tariffs on goods prices appears limited, while the Fed’s main concern remains the risk of renewed inflationary pressures in the services sector. According to the Cleveland Fed’s Nowcast model, headline inflation rose 0.1% in August to reach an annualized rate of 2.8%, while core inflation held steady at 3.1%.

BTC 1H Analysis – Key Triggers Ahead | Day 12💀 Hey , how's it going ? Come over here — Satoshi got something for you !
BINANCE:BTCUSDT
⌛ On the 1-hour Bitcoin timeframe, we can see that the trend has shifted from bullish to a deep correction. The reason for this move was the release of higher-than-expected Producer Price Inflation, influenced in part by Trump’s tariff policies. As a result, the likelihood of an interest rate ( CPI) cut has decreased — which is not particularly favorable news for the market.
👀 After forming a new all-time high, Bitcoin faced heavy selling pressure and a sharp rejection, pushing it towards support levels. The current key support for Bitcoin is at $117,200, which could attract market makers (buyer entries). The next support is likely around $115,000.
🎮 Fibonacci levels have been drawn from a higher low to Bitcoin’s all-time high. The most important levels are $117,200 and $119,800. A breakout above or below these levels could provide potential long or short trading opportunities.
⚙️ On the RSI, the key resistance zone is at 35.88. Historically, each time the RSI has reached this level, Bitcoin has reacted strongly. A rejection here could lead to a deeper correction, while a breakout above it could trigger upward momentum.
🕯 Both trading volume and the number of transactions are increasing, but selling pressure is leaving increasingly “red” candles. This rise in volume could be a useful signal for planning entries.
🔔 There’s no specific alarm zone today since Bitcoin is in a phase of uncertainty, and the exact reason for the market’s drop has not yet been fully absorbed.
CRYPTOCAP:USDT.D 📈USDT.D has broken a strong resistance level and is now moving toward its next resistance .
🖥 Summary: Trump’s tariffs have fueled higher producer inflation, reducing the chances of a rate cut. Bitcoin’s critical support is at $117,200; if this breaks, the price could move towards lower levels.
❤️ Disclaimer : This analysis is purely based on my personal opinion and I only trade if the stated triggers are activated .

Double Top (1h)TOTAL3ESBTC has formed and confirmed a textbook double top, with peaks near 0.347821 and a neckline at 0.336428 . The measured move projects a downside target of approximately 0.3250 , aligning closely with prior horizontal support.
Today’s hotter-than-expected PPI report adds macro pressure to an already bearish technical setup, potentially accelerating the move toward the target.
Key Points :
Pattern : Double top
Top : 0.347821
Neckline : 0.336428
Target : 0.3250 ( measured move )
Invalidation : if price reclaims and holds above 0.336428
Trade Considerations :
Aggressive traders may already be short from the breakdown
Conservative traders could wait for a neckline retest and rejection before entry
Monitor volume behavior to confirm momentum
Disclaimer :
This is not financial advice. Always do your own research before trading.

$USPPIMM -U.S PPI Rises the Most Since 2022 (June/2025)ECONOMICS:USPPIMM
June/2025
source: U.S. Bureau of Labor Statistics
- U.S producer prices rose 0.9% mom in July,
rebounding from a flat reading in June and much higher than expectations of 0.2%.
It marked the largest increase in producer prices since June 2022, driven primarily by higher service costs, particularly margins in machinery and equipment wholesaling.
Meanwhile, core PPI also went up 0.9%.
Year-on-Year, headline producer inflation accelerated to a five-month high of 3.3% while core producer inflation jumped to 3.7%.
What the Heck is Happening? Core PPI Spike & Fed’s Tough ChoiceCrazy market moves, weird data spikes… and everyone’s confused.
In under 2 minutes, I’ll break down what’s going on — and why it matters for your trades.
If it helped, smash that boost—it fuels my mission!

#BITCOIN - What to Expect After the DUMP?The massive correction happened.
Why? Because of the PPI data rose to 3.3% — higher than expected. Typically, this news would not trigger such a massive sell-off.
However, people had grown accustomed to the bullish market and opened a ton of LONG positions with high leverage. As the result, a massive cascade of liquidations occured and drove the dump crazy.
TALKING ABOUT FURTHER POSSIBILITIES: We are still in the bullish market, but the next few days will determine the future of this cycle (at least for the next 1-2 months) . Bitcoin is now back inside the $116,500 - $119,500 consolidation range.
If we see some strong positive movements on Altcoins & Bitcoin this week, it will show that the real demand (whales & funds) are interested in pushing the price higher. However , if Altcoins & Bitcoin are weak, then most likely the TOP of this cycle was marked at $124,000.

AUDUSD Potential UpsidesHey Traders, in today's trading session we are monitoring AUDUSD for a buying opportunity around 0.65000 zone, AUDUSD is trading in an uptrend and currently is in a correction phase in which it is approaching the trend at 0.65000 support and resistance area.
Trade safe, Joe.

DXY Potential DownsidesHey Traders, in today's trading session we are monitoring DXY for a selling opportunity around 97.900 zone, DXY is trading in a downtrend and currently is in a correction phase in which it is approaching the trend at 97.900 support and resistance area.
Trade safe, Joe.

BTC 1H Analysis – Key Triggers Ahead | Day 11💀 Hey , how's it going ? Come over here — Satoshi got something for you !
⏰ We’re analyzing BTC on the 1-hour timeframe , we observe it approaching the 99 moving average .
👀 Bitcoin moved upwards after breaking the $117,500 level, creating a new historical high at $124,474, then was rejected by sellers at this level and is now correcting this upward leg. Today is a news day, so keep an eye on the market.
🎮 A Fibonacci retracement has been drawn from the channel breakout to the new high, showing support at the 0.61 level, which coincides with our 99 moving average, making it a relatively good support zone. The key level for an upward movement is breaking 0.37, which would end our correction trend.
👑 We observe the moving averages where the 7-period moving average has crossed over the 25-period moving average from above, and the price is approaching the 99 moving average.
⚙️ The key RSI zone for us is at 37.84, which has shown an upward reversal, serving as our RSI support. Breaking this zone could lead to further oscillation towards 30. The next key zones are 50 and 70, where Bitcoin could move towards with increased volume and number of trades.
🕯 We see that Bitcoin has experienced increased volume at breakout zones, and there's a strong seller zone above this area where buy orders are triggered each time the price reaches this zone. Breaking this zone would require a significant volume increase from major buyers.
🔔 An alert zone for Bitcoin has been set at 0.37, where upon reaching this price, you can check market behavior for a long position and make the most logical trading decision.
📊 We observe Tether's dominance, which has moved upward after breaking the 4.10 resistance level. The next resistance for Tether's dominance is the 4.20 zone. If this level is broken, Bitcoin could undergo a deeper correction. 💸 Conversely, if it breaks below the 4% level, it could move toward forming a new high.
🖥 Summary : Today is a news day, and Bitcoin could experience unusual fluctuations. Make sure to manage your capital and risk properly. Also, remember that the news released can have several scenarios: initial impact, secondary impact, long-term effects, ... .
❤️ Disclaimer : This analysis is purely based on my personal opinion and I only trade if the stated triggers are activated .
SPX trending....PPI comes in hot!PPI comes in super hot.
3.7% vs 2.9% exp YOY
0.9% vs 0.2% MOM exp
The SPX does gave higher upside targets but we are getting very stretched in the near term.
Liquidity has been flowing into crypto at full force and often moves of 125% in 2 months see profit taking.

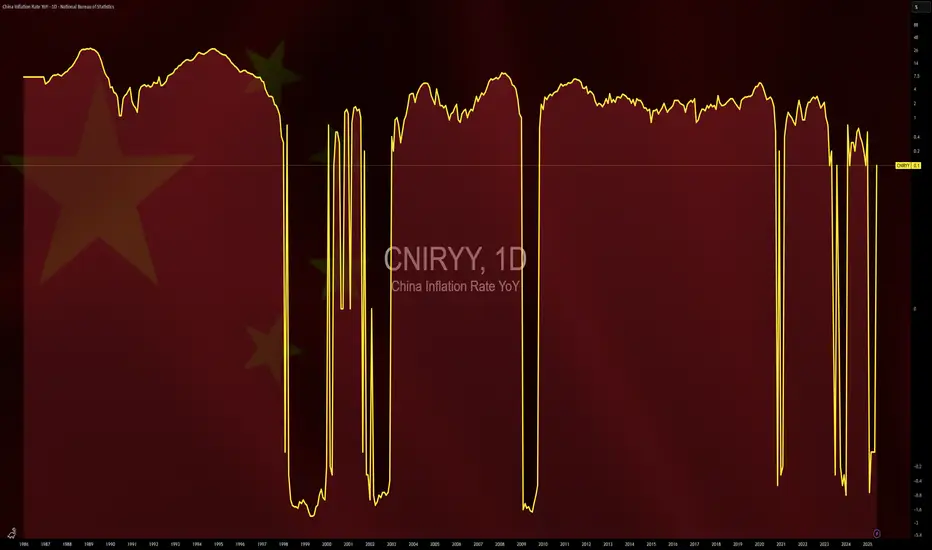
$CNIRYY -China CPI Data Beats Forecasts (July/2025)ECONOMICS:CNIRYY
July/2025
source: National Bureau of Statistics of China
- China’s consumer prices were flat yoy in July 2025,
surpassing expectations for a 0.1% decline and following a 0.1% rise in June.
Non-food prices picked up, supported by Beijing’s consumer goods subsidies. Meanwhile, producer prices fell 3.6%, extending declines for the 34th month and holding at the steepest drop since July 2023.
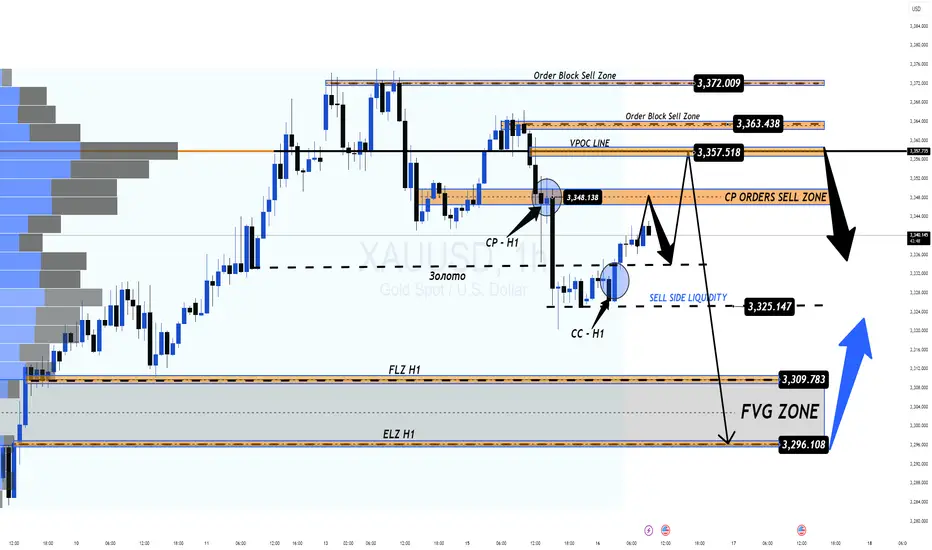
XAUUSD 16/07 – Temporary Rebound or Trap Before the Next Drop?XAUUSD 16/07 – Temporary Rebound or Trap Before the Next Drop?
🌍 Macro View – Calm Before the Volatility?
Gold is currently hovering around $3,334/oz after an aggressive sell-off earlier this week. While June's Core CPI data from the US came in lower than expected — easing immediate inflation concerns — the broader macro landscape remains far from stable:
New US tariffs are beginning to ripple through consumer prices.
Sectors like appliances and electronics are seeing early signs of inflation.
Shrinking inventories may lead to direct price pressures on consumers soon.
🔎 As the market digests these signals, gold remains a defensive play — but today's PPI release could flip sentiment quickly.
📉 Technical Outlook – Setup for a Deeper Pullback?
After CPI, gold retraced sharply and filled liquidity around 332x.
A clear Fair Value Gap (FVG) formed on the H1 chart, alongside a potential Continuation Pattern (CP) near 3347–3349.
Price action is likely to revisit the 334x–336x resistance zone, providing ideal short setups if rejection is confirmed.
🎯 Below lies a deep liquidity zone (FVG) near 3294, which could serve as the magnet for the next bearish move.
📊 Key Trade Zones to Watch
🔵 Buy Zone – Deep Liquidity Support: 3,296 – 3,294
SL: 3,290
TP: 3,300 → 3,304 → 3,308 → 3,312 → 3,316 → 3,320 → 3,330
🔴 Sell Scalp – CP Pattern Rejection: 3,347 – 3,349
SL: 3,353
TP: 3,343 → 3,340 → 3,336 → 3,330 → 3,325 → 3,320 → 3,310 → 3,300
🚨 Sell Zone – VPOC Level Resistance: 3,358 – 3,360
SL: 3,364
TP: 3,354 → 3,350 → 3,346 → 3,340 → 3,330 → 3,320 → 3,300
⚠️ What to Expect Today
All eyes are on the US PPI data, which could shake markets later in the session.
Look for a bullish fake-out during London or New York hours, especially toward 334x–336x zones.
Ideal strategy: wait for H1 candle confirmation before entering, and manage risk with clean TP/SL levels.
💬 Your Take?
Will gold revisit 329x this week, or are we setting up for a bullish reversal?
👇 Drop your thoughts in the comments and follow @MMFlowTrading for high-probability setups and macro insights — daily!
NAS100 - Stock market awaits inflation!The index is located between EMA200 and EMA50 on the one-hour timeframe and is trading in its ascending channel. Maintaining the ascending channel and confirming it after breaking the downtrend line will lead to the continuation of the Nasdaq's upward path to higher targets (23000), but in case of no increase and channel failure, one can look for selling positions up to the target of 22500.
Last week, the U.S.dollar demonstrated strong performance against major global currencies, despite having experienced some weakness since April 2, when President Donald Trump announced retaliatory tariffs against key U.S. trading partners. However, these tariffs were ultimately postponed, and only a baseline 10% tariff was maintained.
The 90-day deadline for implementing these tariffs, originally set to expire on Wednesday, has now been extended to August 1. Nevertheless, Trump surprised the markets this week by announcing a 25% tariff on imports from Japan and South Korea, threatening a 50% tariff on Brazilian goods, and implementing lower tariffs for other partners. These developments triggered a shift of capital toward the U.S. dollar as a safe-haven asset, boosting its strength.
This marks a notable shift in how the dollar is reacting to tariff tensions. In April, fears of an economic slowdown weighed on the greenback, but now it is gaining traction as a refuge in times of uncertainty, particularly as inflation risks mount—contributing to choppy moves in U.S. equity markets.
As is customary, the earnings season will kick off with reports from major banks and financial institutions. On Tuesday, JPMorgan is set to release its financial results, opening the floodgates for a wave of earnings reports. The image referenced lists several other companies, many of which are market heavyweights.
Following a relatively quiet week due to Independence Day holidays and a lack of major economic data, markets are now gearing up for a steady stream of reports in the coming days. Tuesday will bring the Consumer Price Index (CPI) for June along with the Empire State manufacturing survey. On Wednesday, the spotlight will shift to the Producer Price Index (PPI) for the same month. Then, on Thursday, traders will focus on June’s retail sales report, the Philadelphia Fed’s manufacturing survey, and the weekly jobless claims figures.
The week will conclude with two additional reports on Friday: the June housing starts data and the preliminary reading of the University of Michigan’s Consumer Sentiment Index.
June’s CPI report is expected to reflect an uptick in inflation, potentially driven by Trump’s tariff policies. Some analysts believe the tariffs will have an “undeniable” impact on prices, though others remain uncertain.
Despite concerns from both experts and consumers that businesses might pass tariff costs on to buyers, inflation has so far remained relatively moderate this year. The effects of Trump’s aggressive tariff campaign on hard economic data have not yet been clearly reflected—but that may be about to change.
According to Bloomberg’s consensus forecasts, as cited by Wells Fargo Securities, the CPI is expected to show a 2.7% year-over-year increase in June—up from 2.4% the previous month. Meanwhile, core CPI, which excludes volatile food and energy prices, is projected to have risen 3% over the same period, compared to a prior gain of 2.8%.
If these numbers come in as expected, it could support the forecasts of analysts who have warned that the costs of Trump’s heavy import tariffs would eventually show up on price tags, as manufacturers, importers, and retailers pass along the burden through the supply chain. Since taking office, Trump has imposed a wide array of tariffs, including a 10% levy on most imports, a 25% duty on foreign automobiles, and tariffs exceeding 50% on Chinese products.
