Coeur Mining (CDE) Elliott Wave Outlook - Count 1 (4H)Since the previous weekly outlook on NYSE:CDE , price has moved pretty much in line with the expectation, with wave (3) and wave (4) playing out. The pull back in wave (4) was more aggressive and deeper than I would have liked, but wave (2) was fairly flat, so based on the guideline of alternation it does suggest a sharper correction in wave (4), it did run just beyond the 50% fib retracement which is getting a little deep.
In this interpretation I have the chart moving higher in wave (5) with red wave 1 underway. I'll add a caveat, there are alternative wave counts available and should we see an aggressive sell off in silver, then CDE may get hit alongside it. in that scenario this recent up move from $13.55 may instead be a corrective wave, which would mean more consolidation in wave (4), and potentially a break below $13.55 (which is the invalidation level for red 1), unless a triangle pattern forms and we instead go sideways.
Preciousmetals

Gold Drops More Than 200 USDAt the close of trading on December 29, gold plunged 201 USD to 4,331 USD. In the following session on December 30, prices edged slightly higher to around 4,350 USD.
The precious metal had set a new peak late last week at 4,548 USD, but the rally was quickly reversed. This move is largely attributed to aggressive profit-taking and year-end liquidation by short-term futures traders.
So far, although gold has shown some short-term volatility on the chart, the magnitude remains manageable. However, strong selling pressure may persist today and tomorrow, potentially leading to more significant price swings—especially if the current price channel is decisively broken.
If gold rebounds sharply in the coming days, today’s low could become the latest reaction low within the broader uptrend. In other words, price action over the next two sessions will be critical in determining gold’s direction in the weeks ahead.
From a technical standpoint, the next upside objective for February gold futures bulls is a break above the strong resistance at the record high of 4,548 USD. On the downside, bears are aiming to push prices below the key technical support at 4,200 USD.
What’s your view on where XAUUSD is heading next? Share your thoughts in the comments.

COPPER IS PRIMED AND READYSo this decade precious metals have finally shown volatility. Gold and Silver have been a highlight especially with the past Administration boasting EV, GREEN-NEW DEAL, and now with AI; Precious metals are showing that people as of right now prefer a physical safe haven asset rather than “code” like cryptocurrency. Even now with the Trump administration, space exploration and the ongoing need and increasing demand for more precious metals is obviously making these assets worth looking at BUT one metal that stands out the most but no one is talking about, is COPPER (CU)!
COPPER is by far primed and ready to show what its really made of. Often overlooked, with pennies being disclosed as being “worthless,” it takes more to produce 1 penny than what its actual value is, with only 2-4% of modern day pennies being made of Copper (CU) and 96%+ being zinc and other over supplied metals. Why?
By 2026 the US Government will stop printing pennies, and any 1 cents transactions will now be rounded to the nearest Nickel.
Gold and Silver showed similar chart patterns, and experienced almost the same innovations that lead to its increase demand thus leading to price being bullish as well. One thing that leads me to believe COPPER IS VERY UNDERVALUED is the FACT that silver mining and gold mining can be done by basically any individual with an increased appetite to fund a business venture of 1mil+, and in this day and age thats more common than you think. But copper mining takes at least 10times more money, and it takes at least 15 years to get a Copper Mine up and ready before you start to dig your first ore. With that being said, and the fact that most copper mines if not all of them up to unow, are starting to show depletion…. its TIME.
Technical analysis is easy here, basic trend and resistance/support and price action on the monthly outlook. This asset will be like when your daddy or great granddaddy bought gold cheap!

Gold crashes 5%! Dead cat bounce or buy-the-dip opportunity?Gold has taken a brutal hit, plunging over 5% from the $4,550 highs down to $4,300 as profit-taking slams the market in thin holiday trade. We are now seeing a bounce toward $4,400, but the big question is: is this just a dead cat bounce before a drop to $4,150?
In this video, we analyse the sharp reversal driven by year-end profit-taking and thin liquidity after an extraordinary ~70% rally in 2025. We then map out the critical Fibonacci retracement zones that will determine whether we see a V-shaped recovery or another leg lower.
Key drivers
Profit-taking & thin liquidity : The 5% drop was fuelled by a lack of buyers to absorb heavy selling in a thin, pre-New Year market. This is classic risk-off behaviour after an extended run.
Dead-cat-bounce risk : Bounces to the 38.2% ($4,400) or 50% ($4,430) Fibonacci levels are typical after violent drops. If price rejects here, the technical structure favours another leg down.
Downside targets : A measured move extension from a rejection at $4,400 points to a target around $4,150, which aligns with the 100% Fibonacci extension and previous support zones.
RSI reset : The 4-hour RSI has swung from overbought to oversold in one go. A bounce to the 50-60 level on the RSI would likely reset momentum for the next wave of selling.
Trade plan Bearish continuation : Sell the rally into $4,400–$4,430, targeting $4,170–$4,180 with a stop above $4,500.
Bullish reversal : Watch for hidden bullish divergence on the RSI or a break above the 61.8% retracement ($4,460) to invalidate the immediate bearish bias.
Are you selling this bounce or waiting for the bottom? Share your plan in the comments, and happy New Year to all traders! See you in 2026.
This content is not directed to residents of the EU or UK. Any opinions, news, research, analyses, prices or other information contained on this website is provided as general market commentary and does not constitute investment advice. ThinkMarkets will not accept liability for any loss or damage including, without limitation, to any loss of profit which may arise directly or indirectly from use of or reliance on such information.

District Metals - Bullish outlook for the Uranium StockDistrict Metals (DMX): A Sweden-Focused Metals Story With a Regulatory Catalyst
District Metals is a Canada-listed exploration and development company with a strong focus on Sweden. The company is positioned around two key themes: polymetallic base and precious metals in historically productive mining districts, and long-dated optionality tied to energy and critical metals.
One of the company’s core assets is the Tomtebo project in the Bergslagen mining district. Bergslagen is one of Europe’s most established mining regions, with centuries of documented production across copper, zinc, lead, silver and gold. Tomtebo hosts multiple historical mines and polymetallic showings distributed along a large structural trend. The investment case here is straightforward: modern exploration techniques applied to an old mining district that was never explored with today’s geophysics, structural modeling, or systematic drilling. Value creation is driven by data — drilling results, geological continuity and scale — not narratives.
The second leg of the story, and the one attracting increasing attention, is Viken. This project hosts uranium alongside other metals such as vanadium, molybdenum, nickel, copper and zinc. For years, the economic potential of Viken has been structurally capped by Swedish legislation, as uranium extraction was effectively prohibited. That regulatory ceiling mattered — regardless of geology, uranium could not be part of any mine plan.
That is now changing.
Sweden has formally decided to reverse its long-standing uranium ban. The Swedish parliament has approved amendments to the Minerals Act and the Environmental Code that allow uranium to be classified as a concession mineral, meaning it can legally be explored for and extracted under the standard permitting framework. These changes are scheduled to come into force on 1 January 2026.
This is a material shift. It removes a hard legal stop that has existed for decades. For projects like Viken, uranium can once again be considered as part of the economic equation rather than being ignored entirely. That said, this is not a shortcut to production. Permitting, environmental assessments, technical studies, social acceptance and economics still apply. The law change does not eliminate risk — it eliminates prohibition.
From a market perspective, District Metals sits at the intersection of three forces: drill-driven exploration upside at Tomtebo, regulatory re-rating potential tied to uranium in Sweden, and a broader European push for domestic supply of critical raw materials. This is inherently high-risk territory, but that is where optionality and asymmetric outcomes live.
Execution, not sentiment, will decide the outcome.
Disclaimer: This post is not financial advice and should not be considered a recommendation to buy or sell any security. Always do your own research before making investment decisions.

GOLD (XAU) Outlook - Prediction (12 NOV)GOLD (XAU) Outlook - Prediction
📊 Market Sentiment
Market sentiment for GOLD remains strongly bullish, primarily driven by central bank accumulation. Since 2023, global central banks led by China have been purchasing gold aggressively, creating a durable demand base. With the FED preparing to initiate QE while inflation remains elevated, I think risk assets like GOLD could outperform as the USD (DXY) weakens. This macro setup continues to support a long term bullish narrative.
📈 Technical Analysis
Price has been retracing since October 20, which I think was a healthy correction following a strong expansion. As mentioned in my previous GOLD outlook, price appeared to be retesting the Weekly Value Gap and accumulating within that zone. In my opinion, this accumulation phase seems to have ended, and the market looks ready to continue higher.
📌 Game Plan - Prediction
Price has broken out of the accumulation zone and started expanding upward. I plan to enter after a retest near the key zone around $4060. It may dip toward $4027, which I consider a discount zone. I intend to scale in between $4060 and $3950, with invalidation if the daily candle closes below $3900.
💬 Follow my Substack profile for detailed insights and extended analysis.
⚠️ Disclaimer: For educational purposes only. This is not financial advice.

Gold in 2026: Will the Bull Market Defy Gravity?Gold emerged as the premier asset of 2025, delivering a remarkable year-to-date gain of roughly 60% . The precious metal shattered multiple records, peaking near $4,550 per ounce in December. While the S&P 500 advanced approximately 17%, gold decisively outperformed almost every major asset class. As we enter 2026, the market must decide if this powerful uptrend still has "fuel in the tank."
Fed Policy and the Opportunity Cost Shift
Federal Reserve policy remains the primary engine for gold’s momentum. After reigniting the easing cycle in late 2024, markets now price in approximately * 60 basis points of additional cuts for 2026. Lower interest rates reduce the opportunity cost of holding non-yielding bullion, making gold more attractive to institutional investors.
The potential appointment of a more dovish Fed chair in mid-2026 could further accelerate this trend. President Trump has publicly pressured for more forceful rate reductions to support economic expansion. If the Fed adopts a markedly more accommodative tone, gold could easily target the $5,000 psychological barrier .
Geopolitical Flashpoints and Tariff Warfare
Military conflicts in Ukraine, Gaza, and the Middle East continue to drive persistent safe-haven inflows. However, the "Trump Liberation Day" announcement of sweeping global tariffs has become an even larger catalyst for demand. Investors increasingly utilize gold as a hedge against the resulting trade-war uncertainty and currency volatility.
Central Banks and the De-Dollarization Narrative
Central banks are fundamentally altering the global reserve landscape. Emerging market institutions, led by China and India, are stockpiling gold to reduce reliance on the U.S. dollar. In 2025, official sector demand reached record-breaking levels, with quarterly totals often exceeding 900 tonnes .
While the pace of accumulation may moderate slightly in 2026, the structural trend remains firmly bullish. Central banks now treat gold as strategic collateral in an increasingly fragmented global financial system.
The Gold-to-Silver Ratio Compression
While gold’s performance was exceptional, it lagged behind the explosive gains in silver, which surged over 150% in 2025 . This dynamic caused the gold-to-silver ratio to tumble toward the 70 mark. Historically, such a sharp compression often precedes a renewed acceleration in the gold rally as the ratio reverts toward the mean.
Risks: Jewelry Demand and Regulatory Headwinds
Despite robust investment interest, record-high prices are crushing physical jewelry demand. Worldwide jewelry consumption saw a 31% year-on-year decline in Q3 2025 as consumers balked at elevated costs.
Additionally, new regulatory measures could dampen local demand in key markets. China’s decision to cut tax exemptions on certain gold holdings might exert downward pressure on prices in early 2026. If the Fed implements fewer rate cuts than anticipated due to a resilient U.S. economy, the bull run could enter a consolidation phase during the second half of the year.
Strategic Outlook for 2026
Technical analysts target the $5,000 to $5,200 range for gold in the first half of 2026. This target aligns with the 261.8% Fibonacci extension of recent corrections. While the path will not be linear, the convergence of geopolitical risk, debt expansion, and accommodative monetary policy justifies a higher equilibrium price.

Gold Costs 175 Hours Of Work To BuyI like to price everything I buy in hours of work.
That’s the only price that actually matters.
Money can be replaced. Time can’t. When I look at a purchase in terms of how much of my life it costs, it becomes instantly clear whether it’s worth it.
My kids hate me for it because their view is that everyone else is paying the same tag price; therefore, it is fair. LOL!
Pay - After tax - Hours
$20 $14.00 324 hours → 8.1 weeks
$30 $21.00 216 hours → 5.4 weeks
$37 $25.90 175 hours → 4.4 weeks avg.
$50 $35.0 130 hours → 3.2 weeks
$60 $42.00 108 hours → 2.7 weeks
Markets don’t care about this at all. You should.
Pricing gold in hours of work gives you a far clearer sense of whether it’s actually cheap or expensive.
No one wanted to buy gold at $2,000—about 80 hours of work—when I posted the bullish setup in February 2024.
Now everyone wants it at $4,533—175 hours of their lives. I barely got 20 likes. LOL!
That’s how you know you’re in a euphoric market.
You can make a lot of money in Euphoria Land—fast.
You can lose it even faster.
Why?
Because most people don’t understand valuation, and they never have an exit strategy.
They want every last drop of greed.
The green number on the screen creates a false sense of safety—
as if unrealized gains are money you can afford to lose.
“F it. Keep it going.”
Hair on fire and all!
If you want to be a successful trader/investor, you MUST learn valuation and have an exit strategy. NO MATTER HOW HIGH THE PRICE GOES AFTER THE FACT! It is not your concern. You have ZERO RISK OF LOSING IT when the money is in your bank account. I lost my ARS! learning this lesson the hard way. I don't want you to do the same. I get people bashing me for GTFO and STFO because they know no better. They never made money in markets and kept it. They can be right for 1000 days and lose their ars in 5! In their premetive brains, they were "RIGHT" for 1000 days. It will come back. LOL! And it never does.
No One Should Be Buying Here!
Price is what you pay. VALUE is what you get.
If you enjoy the work:
👉 Drop a solid comment
Let’s push it to 6,000 and keep building a community grounded in truth, not hype.

Silver: Major Surge Following Triangle Breakout.Hello there,
I am a professional trader and investor. I have traded for several years and could realize thousands of successful trades. Likewise, I use several indicators to spot the best assets and trading opportunities in the market. My focus lies on pivot-based momentum analysis to spot the best timing to enter the trade for a maximum of profit through a total-return trading approach.
Today, taking a close look at silver, we saw a massive surge in bullish volatility within the previous weeks and month. After a strong consolidation, silver broke out of this huge triangle. Considering this, fundamental indicators also supported this breakout and the bullish build-up. We see a lot of supply chain shortages making industry-specific precious metals like silver massive.
Silver is now printing several highs after the other, and with this momentum it is likely that the main target will be reached. The main target of this huge triangle is within the 140 to 150 zone. It is not unlikely that with such bullish momentum established, further targets above this initial zone will be reached.
Thank you very much for watching.

Potential outside week and bullish potential for PMTEntry conditions:
(i) higher share price for ASX:PMT above the level of the potential outside week noted on 19th December (i.e.: above the level of $0.595).
Stop loss for the trade would be:
(i) below the low of the outside week on 15th December (i.e.: below $0.49), should the trade activate.

SILVER - Record High $72.70Executive Summary
Silver just hit an ALL-TIME HIGH of $72.70 on December 24, 2025, capping off a historic year that has seen the precious metal surge +148.54% YTD - outperforming gold's impressive +70% gain. Currently trading at $71.80, silver is riding a powerful ascending channel on the 4H timeframe with no signs of slowing down. Safe-haven demand, Fed rate cut expectations, inclusion on the U.S. critical minerals list, and rising industrial use have created a perfect storm for silver bulls.
BIAS: BULLISH - Strong Uptrend Intact
This is one of the most bullish setups I've seen. +148% YTD, record highs, ascending channel intact, and technicals screaming "BUY." The trend is your friend.
Current Market Context - December 24, 2025
Silver is having a historic year:
Current Price: $71.8050 (+0.50% on the day)
Day's Range: $70.2124 - $72.693
52-Week Range: $28.3390 - $72.693
ALL-TIME HIGH: $72.70 (hit today)
Technical Rating: BUY
Performance Metrics - ALL GREEN (HISTORIC):
1 Week: +12.68%
1 Month: +43.50%
3 Months: +63.61%
6 Months: +96.26%
YTD: +148.54%
1 Year: +142.28%
This is the best performing major asset of 2025. Silver has more than doubled from its 52-week low of $28.34.
THE BIG STORY - Silver Outshines Gold in Historic Rally
Record-Breaking Performance
Silver has surged more than 150% year-to-date, significantly outpacing gold's impressive 70%+ gain. This is gold's biggest annual gain since 1979, and silver is beating it handily.
Key milestones:
ALL-TIME HIGH: $72.70 (December 24, 2025)
Previous record broken multiple times this month
Up 143.56% from 52-week low of $28.94
Up 142.08% from 2025 low of $29.116 (April 4)
Month-to-date: +24.87%
Three consecutive winning sessions
Largest 3-day gain: +9.12% ($5.893)
Why Silver Is Outperforming Gold
Strong investment demand
Inclusion on U.S. critical minerals list
Rising industrial use (solar panels, electronics, EVs)
Tighter supply dynamics
Rotation from gold investment demand
Safe-haven appeal in uncertain times
FUNDAMENTAL DRIVERS - The Perfect Storm
1. Safe-Haven Demand
Geopolitical tensions driving investors to precious metals
U.S. President Trump calling for regime change in Venezuela
Global uncertainty supporting haven assets
Investors flocking to tangible assets
2. Fed Rate Cut Expectations
Markets pricing in two rate cuts for 2026
Non-yielding assets like silver thrive in low-rate environments
Trump wants next Fed chairman to lower rates
Falling U.S. dollar supporting precious metals
Interest rates ticking lower
3. Industrial Demand Surge
Silver added to U.S. critical minerals list
Solar panel production driving demand
Electric vehicle growth increasing silver usage
Electronics and technology applications expanding
Industrial use creating structural demand
4. Supply Constraints
Tight mine supply globally
Limited new production coming online
Inventory drawdowns
Supply unable to keep pace with demand
5. Broader Precious Metals Rally
Gold broke above $4,500 for first time
Platinum up ~160% YTD
Palladium up ~100% YTD
Copper and base metals climbing
Entire commodities complex in bull mode
Expert Analysis
Fawad Razaqzada (City Index/FOREX.com):
"The lack of any bearish factors and strong momentum, all backed by solid fundamentals, which include continued central bank buying, a falling U.S. dollar and some level of haven demand" is supporting precious metals.
Societe Generale Analysts:
"The risk of a major drop in the gold price would seem largely linked to a slowing of outright gold buying, such as by emerging market central banks. Barring such an event, investor positions suggest that the extraordinary surge in gold prices is likely to continue."
Gold target: $5,000/oz by end-2026 (Societe Generale)
ADM Investor Services:
"With the dollar weakening, interest rates ticking lower, and the U.S. President calling for regime change in Venezuela the bull camp has a plethora of bullish themes."
Technical Structure Analysis
Price Action Overview - 4 Hour Timeframe
The chart shows a textbook bullish structure:
Ascending Channel Pattern:
Clear ascending channel established
Lower trendline (support) rising from ~$58 area
Upper trendline (resistance) at ~$73-74 area
Price respecting channel boundaries well
Midline (dashed) providing dynamic support/resistance
Higher highs and higher lows throughout
Recent Price Action:
Strong rally from channel bottom
Price currently near upper channel (~$71.80)
Recent pullback found support at midline
Recovery to new highs
Momentum remains strong
No signs of channel breakdown
Key Observations:
Price at all-time high territory
Channel intact and well-defined
Trend structure extremely bullish
Pullbacks being bought aggressively
Volume supporting the move
Key Support and Resistance Levels
Resistance Levels:
$72.693 - Day's high / immediate resistance
$72.70 - ALL-TIME HIGH
$73.00 - Psychological level
$74.00-$75.00 - Upper channel resistance
$80.00 - Extended bullish target
$100.00 - Major psychological target (analyst projections)
Support Levels:
$71.00 - Immediate support
$70.00 - Psychological support / recent breakout level
$68.00-$69.00 - Channel midline support
$65.00-$66.00 - Secondary support
$62.00-$63.00 - Channel bottom support
$58.00-$60.00 - Major support zone
Channel Analysis
Channel width: approximately $10-12
Channel slope: strongly bullish (steep angle)
Current position: Near upper channel
Midline: ~$68-69 area (dynamic support)
Channel bottom: ~$62-63 area (strong support)
Channel top: ~$73-74 area (resistance)
Moving Average Analysis
Price trading well above all major moving averages
All MAs sloping sharply upward
Golden cross patterns on multiple timeframes
MAs providing dynamic support on pullbacks
Trend structure extremely bullish
Technical Rating
The TradingView technical gauge shows "BUY" - confirming the bullish bias across multiple indicators.
SCENARIO ANALYSIS
BULLISH SCENARIO - Continuation to New Highs
Trigger Conditions:
Price breaks above $73.00 with volume
Channel breakout to upside
Gold continues rally toward $5,000
Fed signals more rate cuts
Dollar weakness continues
Price Targets if Bullish:
Target 1: $73.00-$74.00 - Upper channel
Target 2: $75.00-$76.00 - Channel breakout target
Target 3: $80.00 - Extended target
Moon Target: $100.00 (analyst projections for 2026)
Bullish Catalysts:
Record highs attracting momentum buyers
Gold rally continuing ($4,500+, targeting $5,000)
Fed rate cut expectations
Dollar weakness
Safe-haven demand (Venezuela, geopolitics)
Industrial demand (solar, EVs, electronics)
Critical minerals list inclusion
Supply constraints
Entire precious metals complex in bull mode
BEARISH SCENARIO - Pullback Within Channel
Trigger Conditions:
Rejection at upper channel ($73-74)
Profit-taking after massive rally
Dollar strength
Fed hawkish surprise
Risk-on rotation out of safe havens
Price Targets if Bearish:
Target 1: $70.00 - Psychological support
Target 2: $68.00-$69.00 - Channel midline
Target 3: $65.00-$66.00 - Secondary support
Extended: $62.00-$63.00 - Channel bottom
Bearish Risks:
Overbought conditions after +148% YTD
Near upper channel (potential rejection)
Profit-taking at record highs
Holiday thin volumes
Potential dollar bounce
Fed policy uncertainty
NEUTRAL SCENARIO - Consolidation Near Highs
Most likely short-term outcome:
Price consolidates between $70-$73
Digests recent gains
Builds base for next leg higher
Healthy consolidation after massive rally
Channel midline provides support
MY ASSESSMENT - BULLISH
The weight of evidence overwhelmingly favors bulls:
Bullish Factors (Dominant):
+148.54% YTD - Best performing major asset
ALL-TIME HIGH just hit ($72.70)
Ascending channel intact and well-defined
Technical rating: BUY
Outperforming gold significantly
Multiple fundamental drivers aligned
Safe-haven demand strong
Fed rate cuts expected
Industrial demand surging
Supply constraints
Entire precious metals complex bullish
No bearish factors visible (per analysts)
Bearish Factors (Minor):
Near upper channel (potential short-term resistance)
Overbought after massive rally
Holiday thin volumes
Profit-taking risk at record highs
My Stance: BULLISH - Buy Dips
This is one of the strongest trends in any market right now. +148% YTD with no signs of slowing. The fundamentals are aligned, the technicals are bullish, and the channel is intact. Don't fight this trend.
Strategy:
Buy dips to channel midline ($68-69)
Buy dips to $70 psychological support
Target upper channel ($73-74) and beyond
Tight stops below channel support
Don't short this market
Respect the trend - it's massively bullish
Trade Framework
Scenario 1: Breakout Trade Above $73
Entry Conditions:
4H candle closes above $73.00
Volume confirmation
Gold holding above $4,500
Trade Parameters:
Entry: $73.00-$73.50 on confirmed breakout
Stop Loss: $71.00 below recent support
Target 1: $75.00 (Risk-Reward ~1:1)
Target 2: $78.00-$80.00 (Risk-Reward ~1:2.5)
Target 3: $85.00+ (Extended)
Scenario 2: Buy the Dip at Channel Midline
Entry Conditions:
Price pulls back to $68-69 zone
Bullish rejection candle
Channel midline holds
Trade Parameters:
Entry: $68.00-$69.00 at channel midline
Stop Loss: $65.00 below secondary support
Target 1: $71.00-$72.00 (Risk-Reward ~1:1)
Target 2: $73.00-$74.00 (Risk-Reward ~1:1.5)
Target 3: $75.00+ (Extended)
Scenario 3: Buy at $70 Psychological Support
Entry Conditions:
Price tests $70.00 level
Bullish bounce
Volume spike on recovery
Trade Parameters:
Entry: $70.00-$70.50 at psychological support
Stop Loss: $68.00 below midline
Target 1: $72.00-$72.70 (ATH retest)
Target 2: $73.00-$74.00 (upper channel)
Target 3: $75.00+ (Extended)
Risk Management Guidelines
Position sizing: 2-3% max risk per trade
Respect the channel - it's your guide
Don't short this market
Buy dips, don't chase highs
Use channel levels for entries/exits
Scale out at targets
Move stop to breakeven after first target
Holiday volumes may be thin - use appropriate size
Invalidation Levels
Bullish thesis invalidated if:
Price closes below $62 (channel bottom)
Ascending channel breaks down
Gold crashes below $4,000
Dollar surges significantly
Fed signals no more rate cuts
Bearish thesis invalidated if:
Price closes above $75 (channel breakout)
New all-time highs with momentum
Gold breaks $5,000
Industrial demand accelerates further
Conclusion
Silver is having a historic year. With +148.54% YTD gains, it's the best performing major asset of 2025, significantly outpacing gold's impressive +70% rally. The precious metal just hit an ALL-TIME HIGH of $72.70 and shows no signs of slowing down.
The Numbers:
Current Price: $71.8050
ALL-TIME HIGH: $72.70
YTD Performance: +148.54%
1-Year Performance: +142.28%
52-Week Low: $28.34
Technical Rating: BUY
Key Levels:
$72.70 - ALL-TIME HIGH
$73.00-$74.00 - Upper channel resistance
$71.80 - Current price
$70.00 - Psychological support
$68.00-$69.00 - Channel midline
$62.00-$63.00 - Channel bottom (major support)
The Setup:
Silver is in a powerful ascending channel with all fundamentals aligned. Safe-haven demand, Fed rate cuts, industrial demand, and supply constraints have created the perfect storm. The technical rating is "BUY" and the trend is undeniably bullish.
Strategy:
Buy dips to $68-70 support zone
Target $73-74 (upper channel) and $75+
Stops below channel support
Don't fight this trend
Respect the channel
Analysts are targeting gold at $5,000 by end-2026. If silver continues to outperform, $100 silver is not out of the question.

Why Are Precious Metals Rallying?All precious metals have performed exceptionally well, especially in 2025.
From this illustration, we can see that in 2025 alone, from their yearly troughs to their recent highs, gold rose by 73%, silver by 164%, and platinum by 172%.
In today’s tutorial, we will discuss whether the precious metals rally is likely to persist into 2026, and why platinum looks particularly interesting to me. As we can see, over just the last two weeks, platinum has rallied significantly more than both gold and silver.
Platinum Futures & Options
Ticker: PL
Minimum fluctuation:
0.10 per troy ounce = $5.00
Disclaimer:
• What presented here is not a recommendation, please consult your licensed broker.
• Our mission is to create lateral thinking skills for every investor and trader, knowing when to take a calculated risk with market uncertainty and a bolder risk when opportunity arises.
CME Real-time Market Data help identify trading set-ups in real-time and express my market views. If you have futures in your trading portfolio, you can check out on CME Group data plans available that suit your trading needs www.tradingview.com

SLV: short-term perspective Any local pullback into the rising EMAs (55–53–51 area) could form a higher low, potentially setting up one more leg higher toward the 65–77 mid-term resistance zone.
Chart:
Macro (weekly):

A massive move for Outcrop may be imminent!This is Outcrop Silver vs spot silver.
As you can see, the breakout has not even come close to starting. This base has been building for more than six years.
The positive divergence on the quarterly RSI charts tell me that IF this breaks out, it will be an EPIC move.
Fundamental Update - Eric Sprott has been buying a lot of shares AND this just graduated from TSX.V to TSX a few weeks ago.

Will Defiance join the party?Defiance Silver is one of the few development companies that has not taken advantage of this massive move in silver.
So, either there are underlying issues hurting this stock price... OR... this thing is getting ready for a massive pop to the upside.

Can Silver Become the Most Critical Metal of the Decade?The iShares Silver Trust (SLV) stands at the convergence of three unprecedented market forces that are fundamentally transforming silver from a monetary hedge into a strategic industrial imperative. The November 2025 designation of silver as a "Critical Mineral" by the USGS marks a historic regulatory shift, activating federal support mechanisms including nearly $1 billion in DOE funding and 10% production tax credits. This designation positions silver alongside materials essential for national security, triggering potential government stockpiling that would compete directly with industrial and investor demand for the same physical bars held by SLV.
The supply-demand equation reveals a structural crisis. With 75-80% of global silver production coming as a byproduct of other mining operations, supply remains dangerously inelastic and concentrated in volatile Latin American regions. Mexico and Peru account for 40% of global output, while China is aggressively securing direct supply lines in early 2025. Peru's silver exports surged 97.5%, with 98% flowing to China. This geopolitical repositioning leaves Western vaults increasingly depleted, threatening SLV's creation-redemption mechanism. Meanwhile, chronic deficits persist, with the market balance projected to worsen from -184 million ounces in 2023 to -250 million ounces by 2026.
Three technological revolutions are creating inelastic industrial demand that could consume entire supply chains. Samsung's silver-carbon composite solid-state battery technology, planned for mass production by 2027, requires approximately 1 kilogram of silver per 100 kWh EV battery pack. If just 20% of the 16 million annual EVs adopt this technology, it would consume 62% of the global silver supply. Simultaneously, AI data centres require silver's unmatched electrical and thermal conductivity for reliability, while the solar industry's shift to TOPCon and HJT cells uses 50% more silver than previous technologies, with photovoltaic demand projected to exceed 150 million ounces by 2026. These converging super-cycles represent a technological lock-in where manufacturers cannot substitute silver without sacrificing critical performance, forcing a historic repricing as the market transitions silver from a discretionary asset to a strategic necessity.

Gold Continues Its Upward TrendHello everyone — let’s take a look at today’s gold price.
At the start of the new week, gold continues to extend its bullish streak, currently trading around USD 4,326. The precious metal remains strong amid expectations that the U.S. Federal Reserve (Fed) will cut interest rates next year, and it is still on track to close the year with an increase of around 60%, marking its strongest annual gain since 1979.
Regarding this week’s outlook, results from Kitco’s weekly gold price survey show that both investors and analysts continue to expect further upside. In the Wall Street survey, 13 analysts participated, with 85% believing that gold prices will continue to rise. Notably, none forecast a decline, while 15% expect prices to move sideways.
Similarly, in the Main Street online survey, 237 investors took part. Among them, 71% anticipate gold advancing to new highs, 11% predict a decline, and the remaining 18% expect prices to consolidate.
From a personal perspective, the chart structure remains clearly bullish, supported by solid demand zones. The immediate target is the USD 4,350 area , followed by the key psychological level at USD 4,400.
I remain optimistic — how about you? Share your thoughts in the comments section.

AGQ projects to $405 SILVER 2X ETFYet to breakout from this W pattern.
What Is the W Pattern?
The W Pattern is a bullish harmonic pattern found on most stock charts at some point in time. Think of the letter “W” and imagine what this pattern might look like. It is characteristic of a bounce and retest of a key support area, commonly referred to as a double-bottom formation.
When this pattern forms on a chart, it usually indicates a trend reversal. Between the two bottoms, there is a level of resistance about halfway between the two tops. As a result, this is key, as it indicates a retest of the bottom support before rising higher into the newly formed uptrend.
Now you see it.
What do you think of this chart pattern and price targets?

Arizona Metals showing positive divergence. This stock has been VERY stretched to the downside and is deeply oversold on the quarterly, monthly and weekly.
As per this chart, positive divergence on the weekly is developing.
If it can break back into the upper orange channel, that would be a great step for this to begin to rebound.
However, those weekly gaps below are concerning. If it breaks below 50 cents, those are definitely in play. Keep an eye on that!!!

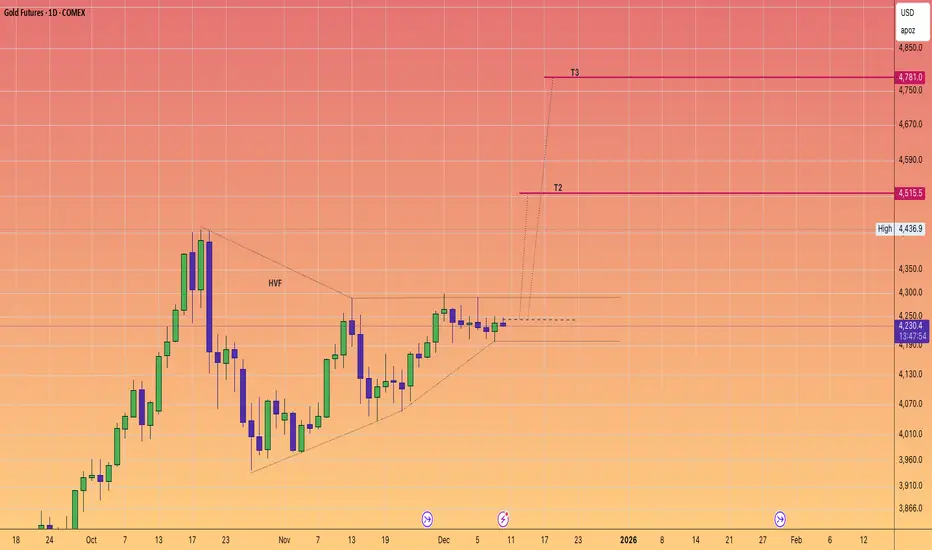
GOLD in a windup. Targets $4800AS we progress ever closer to the quite historic level of $5k for #GOLD
We note that Gold has been quite predictable and routinely has delivered +20% powerful moves since 2024.
The price action currently suggests we are about have another pop very soon.
Will it be enough to tag the $5K level
odds suggest that it definitely on the table.
The #HVF pattern points to $4800 and with some over performance we are right on that doorstep.
Palladium Daily Squeeze Currently watching a daily squeeze looking to breakout on NYMEX:PA1! (I am trading this via AMEX:PALL ).
Should have a nice move up if this breaks bullishly, with an initial target of $1700.

Hecla Mining (HL) — U.S. Silver Leader with Critical-Mineral TaiCompany Overview
Hecla NYSE:HL is a top North American silver & gold producer, anchored by Greens Creek, delivering sustainable, efficient production and leverage to precious-metals upside.
Key Catalysts
Silver = U.S. Critical Mineral (Nov ’25): Elevates strategic importance amid demand from solar, semis, and electrification; global stockpiling tightens supply.
Scale Advantage: Largest U.S. primary silver producer, positioned to capture policy and industrial tailwinds.
Record Quarter: Q3 ’25 EPS $0.15 (~66% beat) alongside strong output and improved balance sheet metrics.
Growth Pipeline: Exploration approvals progressing; Polaris Project slated to begin development in 2026, supporting future resource expansion.
Why It Wins
Direct play on industrial silver demand + monetary hedge
Domestic supply premium as critical-mineral status reshapes procurement
Visible organic growth from sanctioned projects and exploration
Trading Plan
Bullish above: $14.00–$14.50
Target: $21.00–$22.00 — supported by critical-mineral catalysts, production momentum, and a widening silver demand gap.
📌 HL — prime U.S. silver exposure with policy, industrial, and exploration upside.

TMC a clear RARE EARTHS WINNER!!!TMC is going well so far. Up about 30% since i entered in early November. Some updates:
- CFO Craig Shesky warned short sellers could face “a very bad day” if regulatory approval comes through.
- Critical Minerals in DC is this month. Could easily involve a bullish announcement during that time, though no mention of NASDAQ:TMC at all would be very bearish.
- Trump administration to inject up to $150 million into chip laser startup xLight. This is not related to NASDAQ:TMC at all but it is a favorable headline because it shows the Trump admin is very eager and willing to throw meaningful money at vital tech/companies.
- Like I said before, this is a high-risk binary play that is almost entirely headline driven. If TMC gets regulatory approval or Trump announces investment as a chess move against China, it will quickly 2-3X.
