LINK — Massive $20 Support Zone, Wave 5 Loading?I haven’t seen this much confluence stack in one place for LINK in a long time. The $20–$19 zone is absolutely packed with technical factors, making it a critical level to hold for bullish continuation.
🧩 Confluence at $20–$19
Golden Pocket: $20.19 (0.618) → $19.59 (0.666)
Yearly VWAP: $18.87
21 Weekly EMA/SMA: $19.68 / $18.39
Yearly Open: $20.02
0.666 Fib Speed Fan: aligned with $20 zone
1.0 Trend-Based Fib Extension: at $20 → completion of wave 4
Pitchfork Buy Zone: 0.702–0.75 levels right at $20
Midpoint of 1-Year Trading Range
Anchored VWAP (from $30.94 high, 287 days): $19.55
Daily Level: $19.66
Weekly Level: $19.28
Monthly Level: $19.27
Yearly Level: $19.51
🟢 Long Setup
We’ve already seen a bounce from $20, confirming demand at this zone.
Plan: Buy now and add on retracements if price dips back toward $20/$19.
Stop-Loss: Below 21 SMA weekly at $18.39
TP1 → $30 psychological resistance & prior key high
TP2 → $34.57 (0.618 Fib retracement)
This setup offers an R:R of 1:7+ with a possible yield of +70% if played toward TP2.
Structure Outlook
With this stacked confluence, it looks like wave 4 has completed and LINK could be ready for its next leg up. The $20 zone is make-or-break, and as long as it holds, the case for bullish continuation remains strong.
Indicators used
DriftLine — Pivot Open Zones → For identifying key yearly/monthly/weekly/daily opens that act as major S/R reference points
Multi Timeframe 8x MA Support Resistance Zones → to identify support and resistance zones such as the Weekly 21 EMA/SMA.
➡️ Available for free. You can find it on my profile under “Scripts” and apply it directly to your charts for extra confluence when planning your trades.
_________________________________
💬 If you found this helpful, drop a like and comment!
Precisiontrading

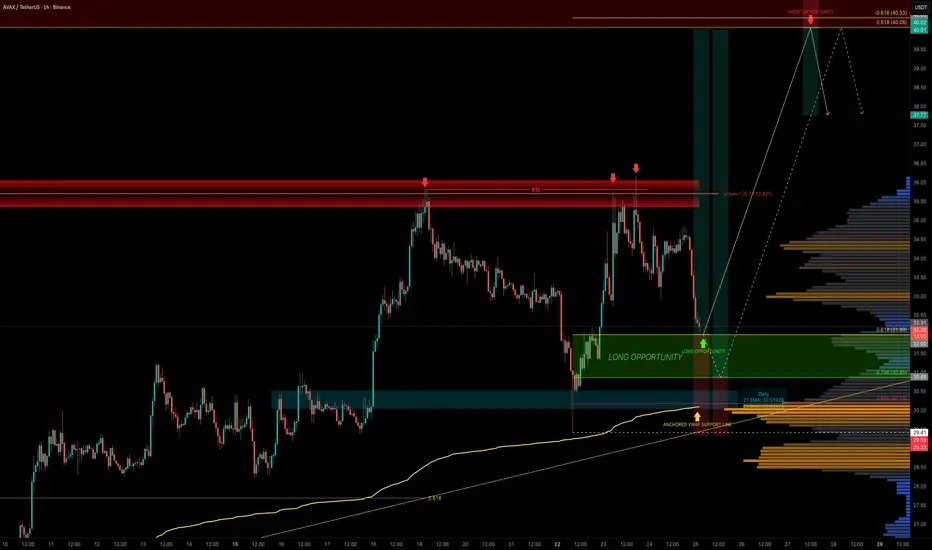
AVAX — Next Stop $40?AVAX has been one of the stronger high-cap performers recently, but the yearly open at $36 has proven to be a tough ceiling. Price has rejected this level three times already, each time offering short opportunities. This level also aligns with the 15B market cap, making it a key resistance zone.
Now, AVAX is retracing into a prime area for long setups, retracing part of the recent 5-wave impulse.
🟢 Long Entry Zone
0.618 Fib retracement: $32 → first bounce zone
0.786 Fib retracement: $30.85 → deeper entry opportunity
0.886 Fib retracement: $30 → highest confluence long entry
Invalidation: Below $29.41 (origin of the impulse)
Confluence at $30
The $30 level is the strongest support cluster, backed by multiple technical factors:
POC of this trading range
0.886 Fib retracement of the impulse
21 EMA/SMA (daily timeframe)
Anchored VWAP support
$30 psychological round number
0.618 Fib speed fan support
This makes laddering entries from $32 down to $30 the most optimal approach.
Targets
First Target: $36 yearly open → retest of major resistance (fourth attempt)
Main Target: $40 resistance cluster → 0.618 Fib retracement, negative -0.618 Fib extension
R:R: 1:3 up to 1:6 depending on entry
Educational Insight
When analysing trades, confluence is king. A single indicator may provide a signal, but when multiple tools align at the same level the probability of that zone holding increases significantly.
The $30 zone for AVAX is a great example of confluence stacking. This doesn’t guarantee success, but it gives traders a defined edge with a clear invalidation point. The same logic applies to resistance: at $40, multiple technical layers align, making it a high-probability take-profit zone.
Quick Take
AVAX is pulling back into a stacked support zone. With solid confluence at $30–$32, this zone sets up the fourth attempt at breaking the $36 yearly open resistance.
And as the saying goes in trading: the 4th touch often breaks. If it does, AVAX could quickly rally toward the $40 resistance cluster, where multiple confluences align.
Indicators used
DriftLine — Pivot Open Zones → For identifying key yearly/monthly/weekly/daily opens that act as major S/R reference points
Multi Timeframe 8x MA Support Resistance Zones → to identify support and resistance zones such as the Daily 21 EMA/SMA.
LuxAlgo — Liquidity Sentiment Profile (Auto-Anchored)
➡️ Available for free. You can find it on my profile under “Scripts” and apply it directly to your charts for extra confluence when planning your trades.
_________________________________
💬 If you found this helpful, drop a like and comment!
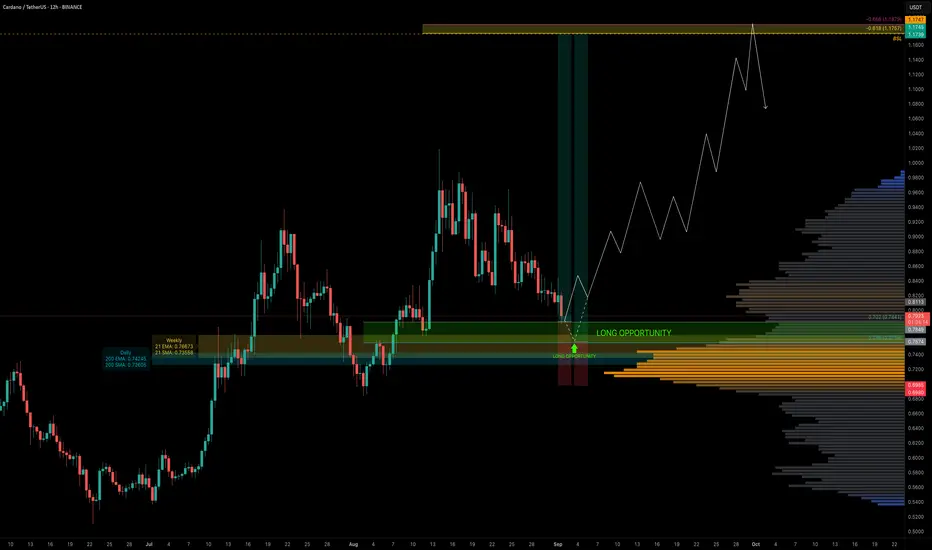
ADA — Fib Harmony With EMA/SMA SupportADA has been in a downtrend for the past 18 days and is now approaching a cluster of key support levels. Today, price tapped the 0.702 Fib retracement ($0.7841) — an optimal area for long entries.
The main focus, however, is the 0.786 Fib retracement, which aligns with a liquidity pocket and multiple layers of confluence, making it the most ideal entry zone.
🧩 Confluence at 0.702–0.786 Fib Zone
0.702–0.786 Fib retracement → prime long entry range
Liquidity pocket → sitting around the 0.786 Fib
200 EM ($0.7424) / 200 SMA ($0.726) (daily)
21 EMA ($0.766) / 21 SMA ($0.735) (weekly)
Pitchfork lower support line → intersecting the zone
0.618/0.666 Fib Speed Fan → adding another support layer
🟢 Long Trade Setup
Entry Zone: 0.702–0.786 Fib retracement
Best Entry: Around the 0.786 Fib
Stop-Loss: Below $0.70 (to be adjusted after seeing more price action)
Target (TP): $1.1757 (–0.618 Fib, in confluence with key high & buy-side liquidity at $1.1747)
Potential Move: +50%
R:R: ~1:4.5 up to 1:7 (depending on entry)
Technical Insight
ADA is testing deeper retracements within its current downtrend, the 0.702–0.786 Fib zone combines structural, dynamic, and liquidity-based confluence.
The added support of the weekly 21 EMA/SMA strengthens this area as a pivotal level for bulls to defend.
If held, this zone could fuel a swing long setup with great upside potential.
The $1.1747–$1.1757 zone is both a high-confluence take-profit area and a potential short opportunity, given the liquidity resting above that level.
🔍 Indicators used
LuxAlgo — Liquidity Sentiment Profile (Auto-Anchored)
Multi Timeframe 8x MA Support Resistance Zones → to identify support and resistance zones such as the weekly 21 EMA/SMA
➡️ Available for free. You can find it on my profile under “Scripts” and apply it directly to your charts for extra confluence when planning your trades.
_________________________________
💬 If you found this helpful, drop a like and comment!
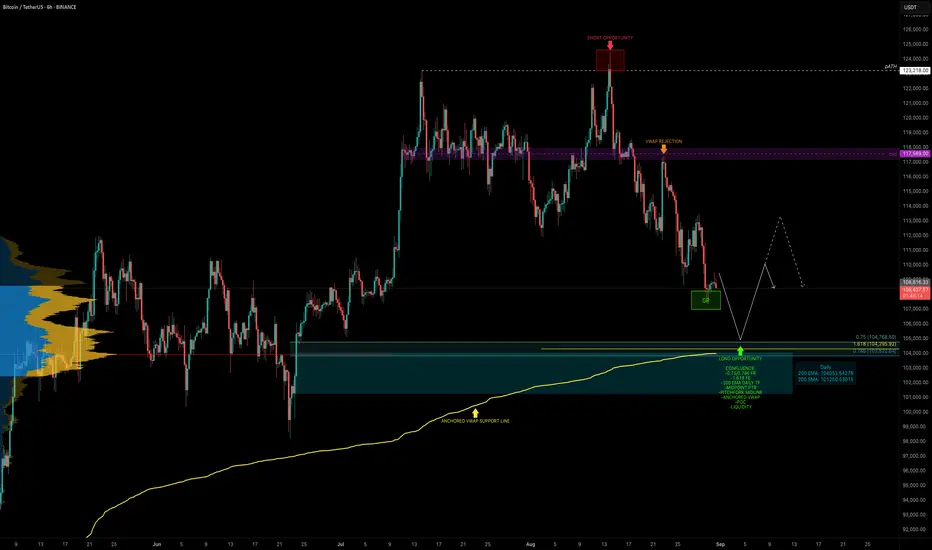
BTC — Identifying High-Probability Long Zone With ConfluenceBTC has been in a 17-day downtrend since the swing failure at the ATH (~$124.5K). That move acted as both a bull trap and the completion of a 5-wave structure, offering an excellent short entry at the highs.
Now the key question: where is BTC heading next, and where is the next high-probability trade setup?
Current Situation
BTC is sitting at the 0.618 Fib retracement ($108,236) of the move from $98.2K → $124.5K. Many traders are already buying this level, which is valid but a deeper zone below offers stronger confluence.
🧩 Confluence Zone: $105K–$104K
POC of the previous trading range → ~$104K
0.75 Fib retracement: $104,768.5
0.786 Fib retracement: $103,823
Anchored VWAP (from swing low $74,508) → just above the 0.786 Fib
Midpoint of the previous 60-day range
Liquidity cluster → positioned around $105K–$104K
1.618 Fib extension target: $104,296
Pitchfork midline → supporting this level
200 EMA (daily) → adding dynamic support at ~$104K
This creates a high-confluence support cluster between $105K–$104K, making it the next strong long setup.
🟢 Long Trade Setup
Entry Zone: $106K–$104K
Stop-Loss: Below $103K
TP: $110K-$114K
R:R Potential: 1:2+
Technical Insight
The ATH rejection confirmed both bullish exhaustion and a completed 5-wave move, triggering the current correction.
While the 0.618 retracement offers valid support, the $105K–$104K zone holds significantly stronger confluence.
This makes it the most attractive high-probability long entry zone in the current structure.
🔍 Indicators used
Multi Timeframe 8x MA Support Resistance Zones → to identify support and resistance zones such as the daily 200 EMA/SMA.
➡️ Available for free. You can find it on my profile under “Scripts” and apply it directly to your charts for extra confluence when planning your trades.
_________________________________
💬 If you found this helpful, drop a like and comment!
LINK — The $20 Pivot ZoneLINK has been in a corrective phase, dropping –21% in the past 10 days. The big question: where is the next high-probability long entry?
Looking at the liquidity, there’s a clear pocket between $21–$20 where many stop-losses are positioned. Let’s break down the confluences.
🧩 Confluence Support Zone ($21–$20)
0.618 Fib retracement of the move: $20.19 → sits right in the liquidity pocket
Yearly Open (yOpen): $20.02 → major confluence
Psychological level: $20 key support
Trend-based Fib extension 1.0: $21.04 → ideal entry zone
Anchored VWAP: ~$20.85 → additional support
55 EMA ($20.835) / 55 SMA ($20.33) (daily): strong dynamic support cluster
0.73 Fib Speed Fan: aligning with the zone
Imbalances (FVG): could be filled here
Together, these create a solid support range between $21–$20 for long positioning.
🟢 Long Trade Setup
Entry Zone: $21–$20
Stop-Loss: Below golden pocket / yearly open
Target (TP): $30.94 (key high + potential short opportunity)
Potential Move: +50%
R:R: 1:5+
🔍 Indicators used
DriftLine — Pivot Open Zones → For identifying key yearly/monthly/weekly/daily opens that act as major S/R reference points
Multi Timeframe 8x MA Support Resistance Zones → to identify support and resistance zones such as the daily 55 EMA/SMA.
➡️ Available for free. You can find it on my profile under “Scripts” and apply it directly to your charts for extra confluence when planning your trades.
_________________________________
💬 If you found this helpful, drop a like and comment!

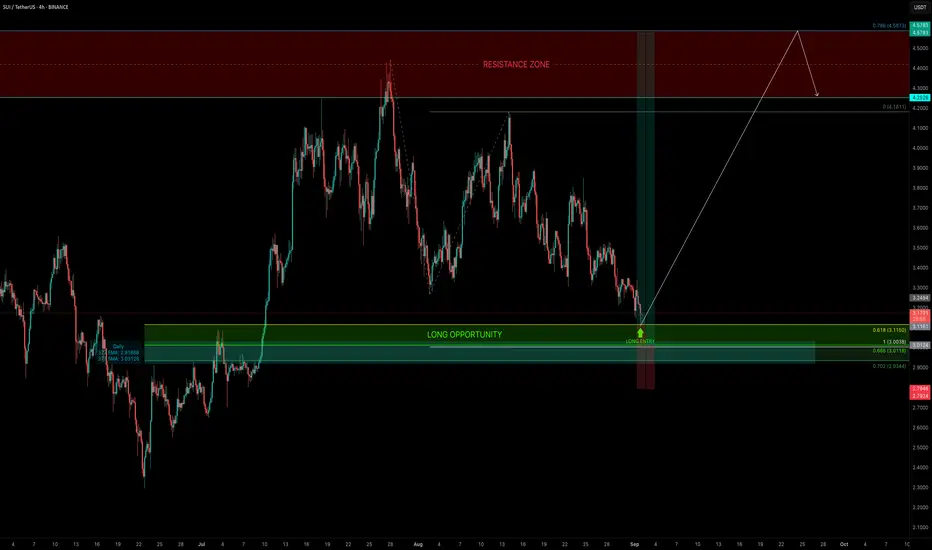
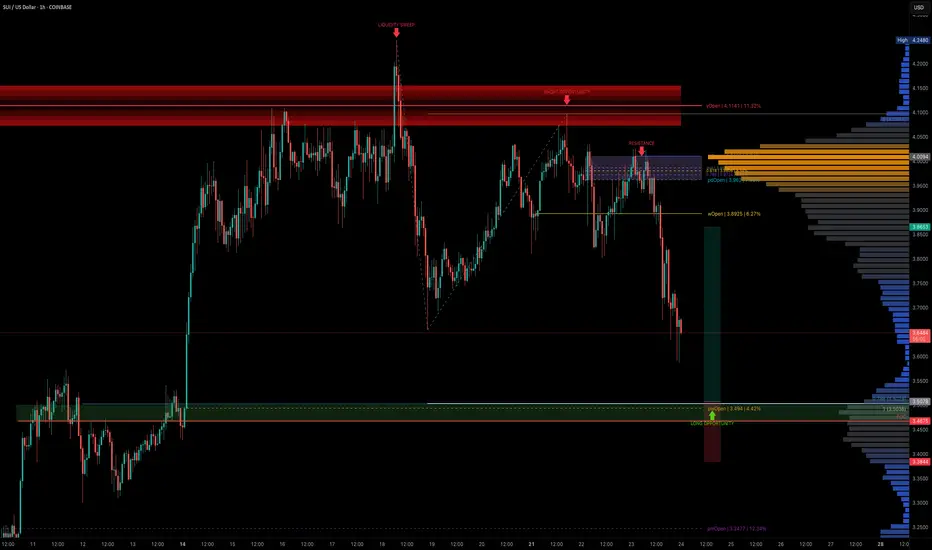
SUI — The $3 Confluence ZoneFor almost 2 months, SUI has been trading sideways in a range between $4 and $3. Today, price tapped the 0.618 Fib retracement ($3.115) of the entire move and bounced, giving a clean long trigger.
Looking ahead, the 1.0 trend-based Fib extension sits at $3.00 → a psychological key level in confluence with the 0.666 Fib retracement, making it the ideal long entry if price sees another drop.
🧩 Confluence Support Zone
0.618–0.702 Fib retracement → primary long entry range
Trend-based Fib extension 1.0: $3.00
0.666 Fib retracement: overlapping $3.00
377 EMA (daily): $2.919
377 SMA (daily): $3.03
🟢 Long Trade Setup
Entry Zone: $3.115 (0.618) → down to $3.00 (extension + retracement confluence)
Best Entry: Around $3.00
Stop-Loss: Below $2.80 (beneath 377 EMA support)
Target: Range highs
Potential Move: +50%
R:R: 1:5+
🔍 Indicators used
Multi Timeframe 8x MA Support Resistance Zones → to identify support and resistance zones such as the weekly 21 EMA/SMA.
➡️ Available for free. You can find it on my profile under “Scripts” and apply it directly to your charts for extra confluence when planning your trades.
_________________________________
💬 If you found this helpful, drop a like and comment!
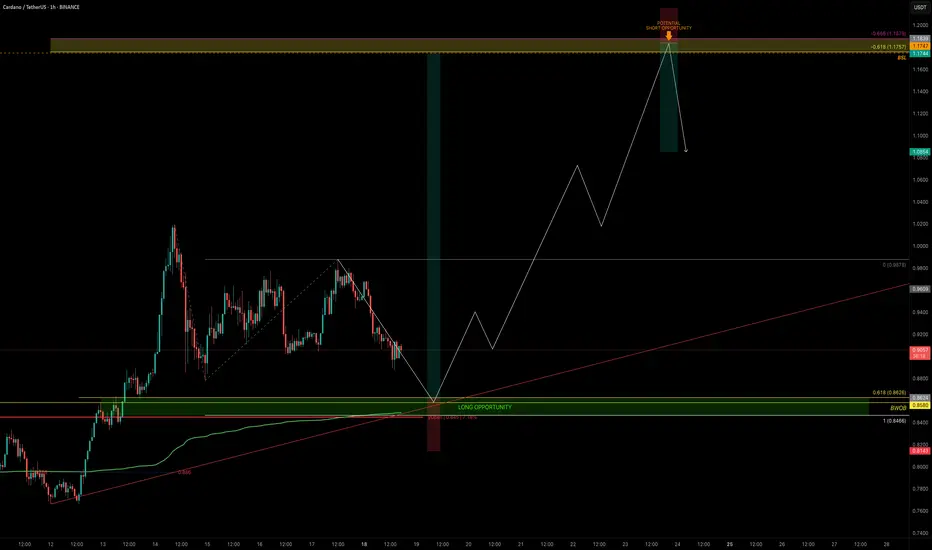
ADA — Is Cardano Ready to Break $1?ADA is coiling just beneath the $1 psychological barrier. The chart is setting up for a decisive move: the high-probability long entry aligns with the yearly open (yOpen), supported by multiple confluences.
🧩 Confluence Factors: 7
Yearly Open (yOpen): $0.845
1.0 Trend-Based Fib Extension: $0.8466 (aligned with yOpen)
Weekly Bullish Order Block: $0.8580
0.618 Fib Retracement: $0.8626
Anchored VWAP (green line): Supporting this zone
Sell-Side Liquidity (SSL): Positioned below recent lows
0.886 Fib Speed Fan: Adding further structural support
🟢 Long Trade Setup
Entry Zone: $0.863 – $0.847
Stop-Loss: Below yOpen (~$0.84)
Take-Profit Zone: $1.1747 (Buy-Side Liquidity sweep)
R:R: 1.6+ depending on SL placement
🔴 Short Opportunity
A secondary setup could arise on a sweep of the key high ($1.1757–$1.1879 BSL zone). This would only be valid with confirmation of rejection.
Entry Zone: After sweep/rejection above $1.1747
Stop-Loss: Above ~$1.20 (post-sweep rejection)
Target: Around $1.10
✍️ Confirmation is critical: the long requires strong defense of the confluence zone, while the short requires a failed breakout and rejection above key high (BSL).
Key Levels to Watch:
Support Zone: $0.863 – $0.847
Resistance / GP Zone: $1.1757 – $1.1879
🔍 Indicators used:
DriftLine — Pivot Open Zones → For identifying key yearly/monthly/weekly/daily opens that act as major S/R reference points
➡️ Available for free. You can find it on my profile under “Scripts” and apply it directly to your charts for extra confluence when planning your trades.
_________________________________
💬 If you found this helpful, drop a like and comment!
HBAR’s ABC Setup — Short-Term Pain, Long-Term Gain?HBAR has been consolidating sideways for the past 30 days, with $0.27 acting as a clear resistance — aligning with the golden pocket (GP). Price failed to sustain above the yearly open (yOpen) at $0.26901, despite multiple attempts. Each breakout attempt lacked follow-through → weakness.
Structurally, HBAR appears to be in a corrective phase after completing five Elliott waves, and is now potentially forming an ABC corrective pattern. Price has also lost the monthly open (mOpen) at $0.25099, which should now act as resistance.
🔴 Short Opportunity
Previous ideal entry: $0.27463 (Golden Pocket) — offered an R:R of ~1:7
Next short zone: Between mOpen ($0.25099) and yOpen ($0.26901)
Target: Around $0.21/$0.2 as take-profit (TP)
🟢 Long Opportunity Zone
➡️ Primary zone: $0.21 – $0.19675
🧩 Confluence factors:
FVG (Fair Value Gap) / imbalance fill
SSL (Support/Stop-Loss liquidity) positioned in the zone
Weekly level: $0.20685
0.55 Fib retracement: $0.20657 (aligned with the weekly level)
0.75 Fib speed resistance fan: Supports this zone if price reaches it between 19 – 25 Aug
1.0 trend-based Fib extension: $0.19675 (projected Wave C target of ABC)
Pitchfork lower support line intersecting with the zone
nPOC & key level: $0.2
With all these aligning, this is the most favourable long setup.
Long Trade Setup Example
Entry: $0.21– $0.19675
Stop Loss: Below $0.19
TP1: ~$0.223
Final target: $0.3+ (swing trade potential)
R:R: 1:6+
🔍 Indicators used:
DriftLine — Pivot Open Zones → For identifying key yearly/monthly/weekly/daily opens that act as major S/R reference points
➡️ Available for free. You can find them on my profile under “Scripts” and apply them directly to your charts for extra confluence when planning your trades.
_________________________________
💬 If you found this helpful, drop a like and comment!

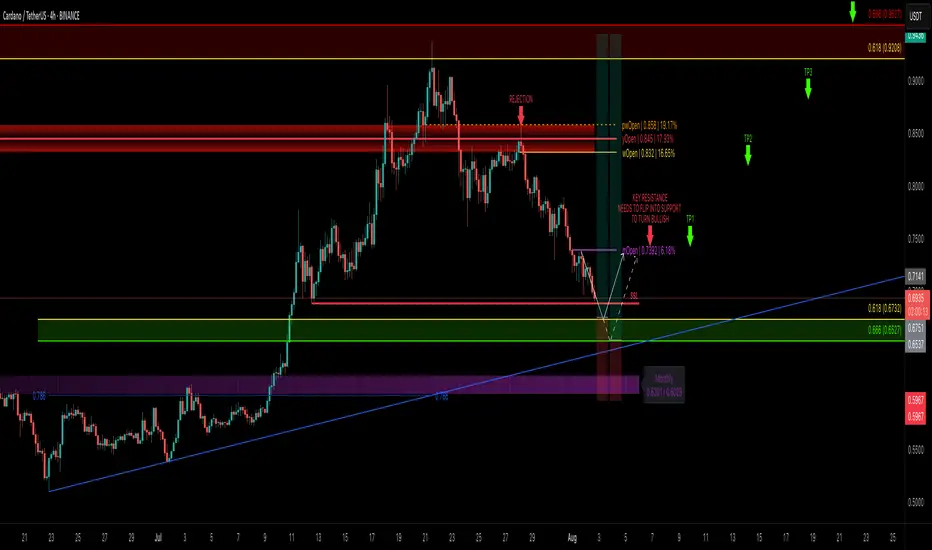
ADA Correction Nearing Completion — Is It Time to Load Up?After tagging the golden pocket resistance zone between $0.9208–$0.9527, ADA completed a clean 5-wave Elliott impulse right into a major resistance. Since then, price has corrected -25%, and we’re now likely nearing the end of an ABC correction — the final wave C.
🧩 Technical Breakdown
➡️ Wave A: 5-wave drop after the peak
➡️ Wave B: Bounce rejected at yearly open (yOpen) — that was a great short opportunity around $0.845
➡️ Wave C: Now working toward completion
🎯 C Wave Target Zone: $0.69–$0.65
This zone has strong confluence:
0.618 Fib retracement of the entire 5-wave move at $0.6732
1.0 TBFE (Trend-Based Fib Extension) aligns perfectly
Sell-side liquidity (SSL)
0.786 Fib Speed Fan support
Monthly 21 EMA/SMA adding a final confluence layer
🟢 Long Setup
Entry Zone: $0.69–$0.65 (ladder in)
Stop Loss: Below the monthly 21 EMA/SMA ($0.6)
Target 1: mOpen key resistance
Target 4: 0.666 Fib at ~$0.95
Risk:Reward: ~1:4+
💡 Educational Insight
After a 5-wave impulsive move, ABC corrections are common. Using the Trend-Based Fib Extension tool to project wave C, especially when paired with liquidity zones, VWAP, or moving averages, helps pinpoint high-probability reversal zones. It’s about confluence and reaction — not prediction.
🔍 Indicators
For this analysis, I’m using my own indicators
DriftLine – Pivot Open Zones and
MFT MA Support/Resistance Zones
both available for free. You can find them on my profile under “Scripts” and apply them directly to your charts for extra confluence when planning your trades.
_________________________________
💬 If you found this helpful, drop a like and comment!
SOL's Golden Pocket: Is This the Bottom?SOL just tapped into the golden pocket zone and swept sell-side liquidity. Creating a high-probability long opportunity.
🟢 Long Setup:
Entry Zone: $156.67 – $151.50
Stop Loss: Below $150 (clear invalidation)
Target: $172
Risk:Reward: solid R:R setup
Why This Zone? Confluence Breakdown:
Golden Pocket retracement (0.618–0.666)
1.272 Trend-Based Fib Extension
Monthly Order Block
0.5 Fib Speed Fan support
Key Level at $154.81
Anchored VWAP support layer
Pitchfork 0.618/0.666 alignment
SSL (Sell-Side Liquidity) swept
nPOC at ~$152 offers a prime entry if we see another leg down
💡 Tip: Ladder in entries within the zone and size up near nPOC if price dips further. Manage risk carefully and watch how price reacts at the zone.
🧠 Educational Insight
Golden pockets (the 0.618–0.666 Fibonacci zone) are some of the most respected levels in trading often acting as key reversal zones, especially when stacked with other tools. In this case, we’ve got a rare confluence: anchored VWAP, nPOC, monthly OB, SSL sweep etc. all lining up with the golden pocket.
When multiple technical factors align, they don’t just increase probability, they give you a tighter invalidation and a better risk-to-reward setup. That’s how professional traders spot sniper entries.
_________________________________
💬 If you found this helpful, drop a like and comment!

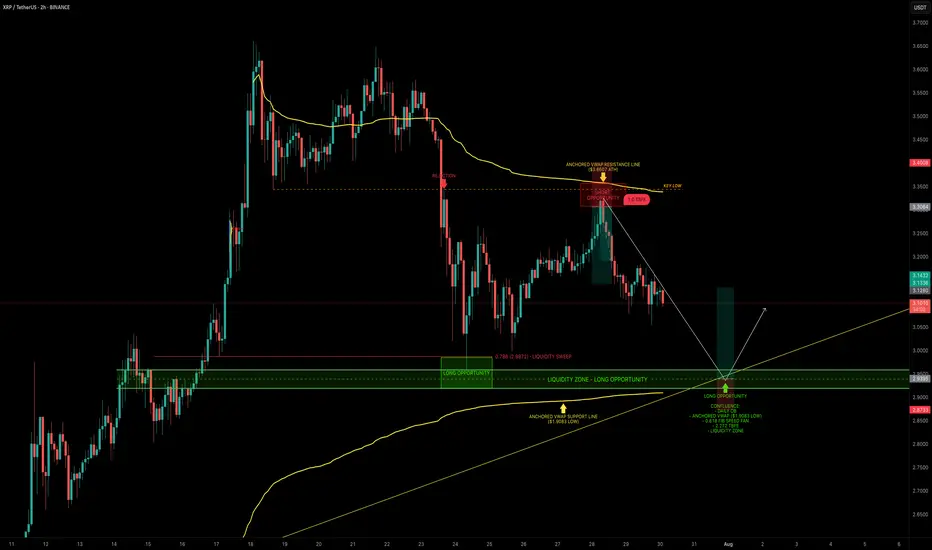
XRP — Mapping Out the Next High-Probability Long SetupXRP continues to respect key levels, delivering clean setups and strong technical reactions.
📉 Recent Price Action Recap
After the flush from $3.65 into the $3.00 support zone, XRP printed a solid bounce back toward the $3.30 resistance area, forming a clean short setup between $3.30–$3.35.
Price is now trading mid-range within the 6-day consolidation.
🟢 Next High-Probability Long Setup
A prime long opportunity lies between $2.96 and $2.9175 sitting within a key daily order block.
Confluence at this zone includes:
Liquidity pool just below the $2.9555 swing low
Anchored VWAP from the $1.9083 swing low resting just under the block
0.618 Fib Speed Fan lining up as dynamic support (July 30 – Aug 2)
2.272 Trend-Based Fib Extension at $2.9297
📈 Long Trade Setup
Entry Zone: $2.96 – $2.9175
Stop Loss: Below anchored VWAP (clear invalidation)
Target: $3.1/$3.13+
R:R: ~1:3+
💡 Educational Insight
This setup is a great example of how multiple tools layered together (like Fibonacci levels, VWAPs, order blocks and liquidity zones) can significantly increase the probability of a trade playing out.
When structure, volume-based tools and time alignment all point to the same area, it creates a high-confluence trade zone. These are the areas where risk is most defined and reward is most favourable, a principle every technical trader should anchor their strategy around.
_________________________________
💬 If you found this helpful, drop a like and comment!
Want breakdowns of other charts? Leave your requests below.
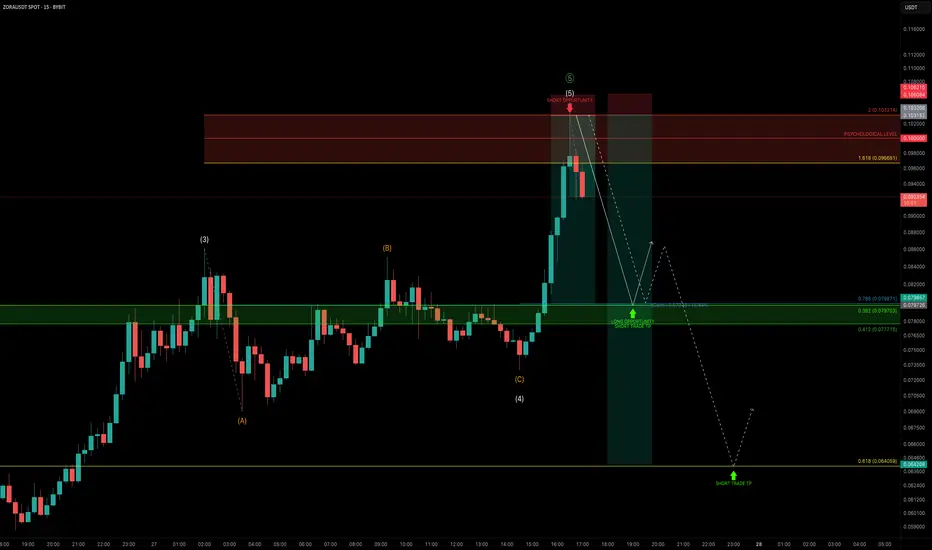
ZORA 5-Wave Completion — 30% Crash Incoming?After exploding +1150% in just 20 days and completing all 5 waves, ZORA is now consolidating — trading sideways just under the $0.10 psychological level for the past 4 days.
📉 Current Market Structure
The current structure shows signs of a developing Head & Shoulders pattern, with price:
Trading below the daily open (dOpen) and weekly open (wOpen) → Bearish signs
Hovering near the prior daily open (pdOpen) → a breakdown here would confirm bearish continuation
🔴 Short Setup - Bearish Scenario
If ZORA breaks below pdOpen, we’re likely heading for:
0.618 Fib retracement at $0.06137 of the final wave 5
Confluence with 1.272 Trend-Based Fib Extension (TBFE) at $0.06148
This zone marks the next high-probability reaction point and a potential long opportunity if price shows a bounce or reversal.
📉 Overall Short Trade Target
The full retracement target sits between $0.0529 and $0.0514, offering multiple layers of confluence:
0.5 Fib retracement of the full 1150% move
0.786 Fib retracement of the final wave 5
Aligned with an old trading range and daily level
This makes it an ideal demand zone for patient bulls but only once price confirms.
💡 Educational Insight
This setup highlights an example of Elliott Wave Theory in action — after a strong 5-wave impulse move, markets often enter a corrective phase. The completion of wave 5, especially near key psychological levels like $0.10, often marks a local top, where price corrects toward key Fibonacci retracement zones.
Combining wave structure with confluence factors like Fib levels, VWAP, and prior trading ranges helps traders identify high-probability reversal zones — allowing for better timing, risk management, and trade planning. Always wait for confirmation before jumping into any trades.
Summary
Bearish continuation confirmed on pdOpen breakdown
First support zone: $0.0613–$0.0614
Final downside target: $0.0529–$0.0514
Look for long opportunities only on reaction + confirmation
_________________________________
💬 If you found this helpful, drop a like and comment!
Want breakdowns of other charts? Leave your requests below.

ZORA — Parabolic Rally Nearing ExhaustionZORA has been on an explosive run, pumping +1239% in just 20 days. But after such a vertical move, the question is:
Is this rally nearing exhaustion?
Let’s dive into the technicals 👇
🧩 Elliott Wave Structure
Looking at price action through the lens of Elliott Wave Theory, ZORA appears to be completing its 5th wave:
➡️ Wave 3–4 zone: Held around the $0.05 trading range
➡️ Wave 5: Now pushing into the $0.097–$0.103 zone
This area aligns with:
The 1.618–2.0 Fib extension pocket — a typical exhaustion zone for wave 5s
The $0.10 psychological level
🔴 Short Trade Setup
This zone between $0.097–$0.103 is the ideal reversal area to consider shorting, with clearly defined targets and confluence:
Entry: $0.097 – $0.103
Stop-Loss: Above the 2.0 Fib Extension
TP1: Around $0.08
TP2: Around $0.064
Confluence: TP1
Daily Open (dOpen)
0.786 Fib of the local move
0.382 Fib of the 5-wave structure
TP2 (Lower Target):
0.618 Fib retracement of the 5-wave move at $0.064
Risk-to-Reward:
TP1 gives an R:R of 1:8
TP2 offers potential 1:13+
Watch for signs of weakness.
_________________________________
💬 If you found this helpful, drop a like and comment!
Want breakdowns of other charts? Leave your requests below.
SUI — Structured Dip Buy Zone You Shouldn't IgnoreSUI has been technically clean, with well-respected Elliott Wave counts and fib levels.
As the broader market dips, it's time to look for sniper long entries and SUI is setting up beautifully for one around the $3.50 zone.
🧩 Key Confluence Zone: $3.50
This level offers a high-probability buy zone, backed by multiple layers of technical confluence:
0.786 Fib Retracement: $3.5029
1.0 Trend-Based Fib Extension: $3.5036
Previous Trading Range POC: $3.4675
Previous Weekly Open (pwOpen): $3.494
🟢 Long Trade Setup
Entry: ~$3.500
Stop-loss: $3.4675
Target (TP): $3.85+
R:R: ~1:3
🛠 Indicator Note
In this analysis I'm using my own indicator:
➡️ DriftLine — Pivot Open Zones
It helps identify key market opens (daily, weekly, prior), which often act as magnet levels and reaction zones.
➡️ You can use it for free — just check out my profile under “Scripts” and apply it to your charts.
💡 Pro Insight: Build Trades Where Tools Agree
A single level is just noise. But when fib retracements, extensions, POCs, opens, and price structure all line up — that’s where conviction trades are made.
The more overlap, the more likely the market reacts — this setup shows just that.
Final Thoughts
SUI is approaching a technically rich zone around $3.50, and this could be one of those low-risk, high-reward long entries if confirmed by price action.
With a clean invalidation and 1:3 R:R, this is the kind of setup you want to plan — not chase.
Set your alerts, stay patient, and trade with structure. 🚀✍️
_________________________________
💬 If you found this helpful, drop a like and comment!
Want breakdowns of other charts? Leave your requests below.
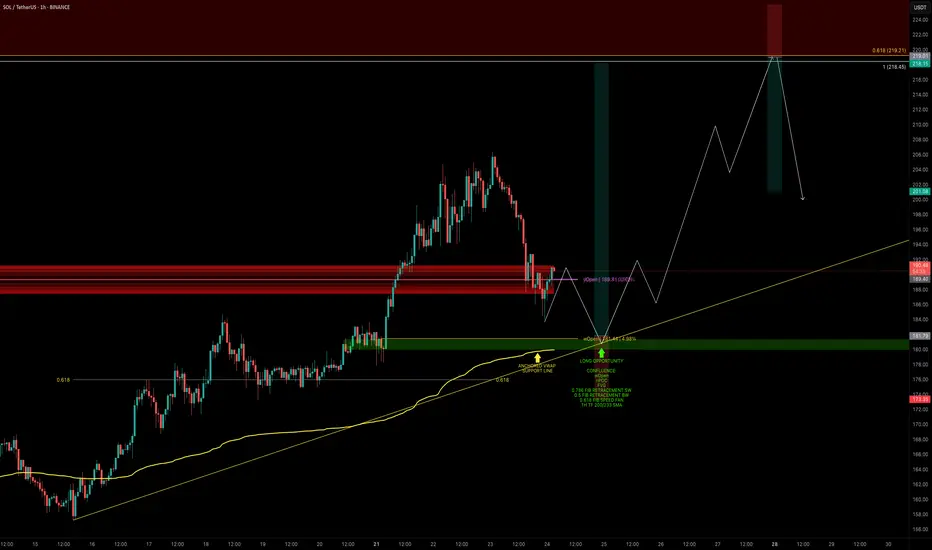
SOL — Bullish Retest in Motion: Time to Strike?SOL has finally broken through the $180 barrier decisively — a key zone it failed to clear back in May.
Now we’re seeing a retest, which may offer one final dip before continuation. Let’s break down the next high-conviction long opportunity.
🧩 Key Retest Zone: $182–$180
➡️ Retesting Prior Resistance as Support
SOL broke above $180 with conviction and is now pulling back.
➡️ First Reaction at $184
A clean bounce occurred at the anchored VWAP, but this might not be the final low.
➡️ Strong Confluence at $180–$182 Zone
This zone is packed with support elements:
Weekly Open (wOpen): $181.44
nPOC: $180.85
Anchored VWAP: ~$179.90
0.5 Fib retracement (of the larger wave)
0.786 Fib retracement (of the smaller wave)
0.618 Fib Speed Fan — projected for tomorrow’s price path
1H 200 & 233 SMAs supporting from below
SOL is currently trading at yOpen — another key pivot level to watch
🟢 Long Trade Setup
Entry: Laddered between $182–$180 (ideal long entry would be at wOpen)
Stop-loss: Invalidation at $173.35
Target (TP): TBFE 1.0: $218.45 / 0.618 Fib retracement: $219.21
R:R: ~1:4.5
Potential Move: ~+20%
🛠 Indicator Used: DriftLine — Pivot Open Zones
For this analysis, I’m using my own published indicator called "DriftLine – Pivot Open Zones " feel free to check it out on my profile.
It helps identify and visualise critical opens (daily, weekly, previous days), providing real-time support/resistance zones.
➡️ You can use it for free — just check my profile under “Scripts” and add it to your chart.
💡 Pro Tip: Support Zones Are Stronger with Confluence
Don’t rely on a single fib or level. When opens, VWAPs, SMAs, and fibs cluster, the probability of a strong reaction increases.
This is how smart traders define clear entries and invalidation.
_________________________________
💬 If you found this helpful, drop a like and comment!
Want breakdowns of other charts? Leave your requests below.
BTC Buy Setup | Sniper Trading System - Reverse Play🚨 BTC Buy Setup | Sniper Trading System™️ Reverse Play Activated
What you’re looking at isn’t luck — it’s Sniper-level execution.
This BTC reversal trade was triggered by my Sniper Trading System™️, which identifies institutional-level liquidity traps, dealer ranges, and timing zones with precision.
🧠 Setup Highlights:
— Liquidity sweep below key support
— RSI confirming reversal from the Fade Zone
— Dealer Range low respected
— Reversal candle + structure shift = high-probability sniper entry
📍 Chart:
This is powered by my Jesus Saves™️ + Fade Reversal Combo, built into the Sniper Trading System Suite™️.

GBPUSDThe last day of the week presents a very interesting day at a technical level and at a fundamental level for London time. According to my analysis, there is a bullish London with a reversal in NY.
My main premise is: "I'm not predicting what the price will do, but rather what the reaction will be to what it shows me."

GBPUSDIn general terms, I can see that the price is in a bearish channel, accumulating a large part of the supply and inducing it to continue selling. I stick with my plan to sell until my psychological point of 1.27772 since in a week that is my breakout of the BOS. Once I get that liquidity point I will be very attentive since it is a greater induction therefore I will take advantage of all that offer and I will join the sharks to buy and take my part. But since the market is present today, it is giving me a beautiful sales opportunity.

EURCHF SELL 2mIf price returns to my point of interest, I'm waiting to see if it will hold and allow for a significant drop.

DXY Analysis Sunday 5/10/2020US Dollar Index could possibly play off the zone of Interest (Box Area); I use the Dollar Index as an indicator for my entries on Forex pairs; Positive and Negative correlation relationships. If DXY confirms on to the upside on lower time frame fractal the AUDUSD-NZDUSD will confirm to the downside at the same TIME on lower time frame Fractals. Which in part have a Negative Correlation with GBPNZD-GBPAUD. Inter-Market Arbitrage.
