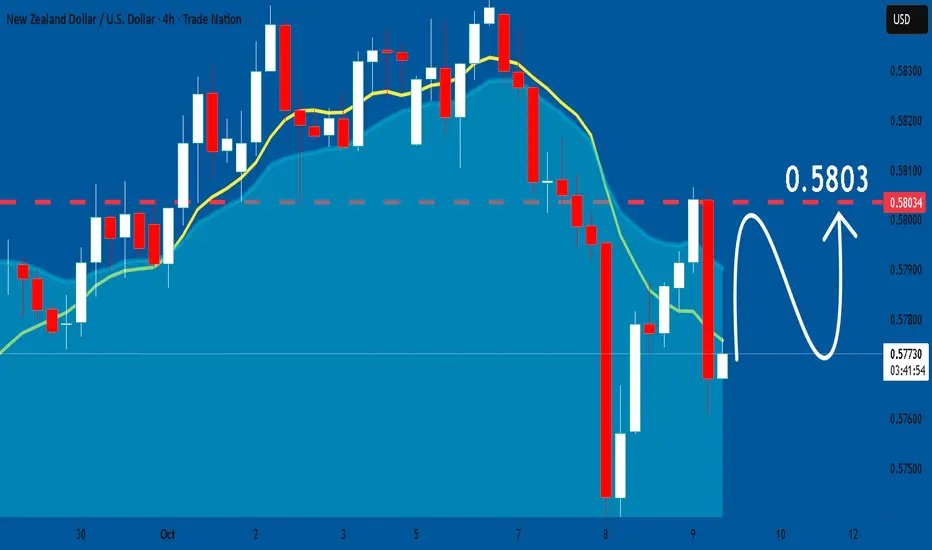
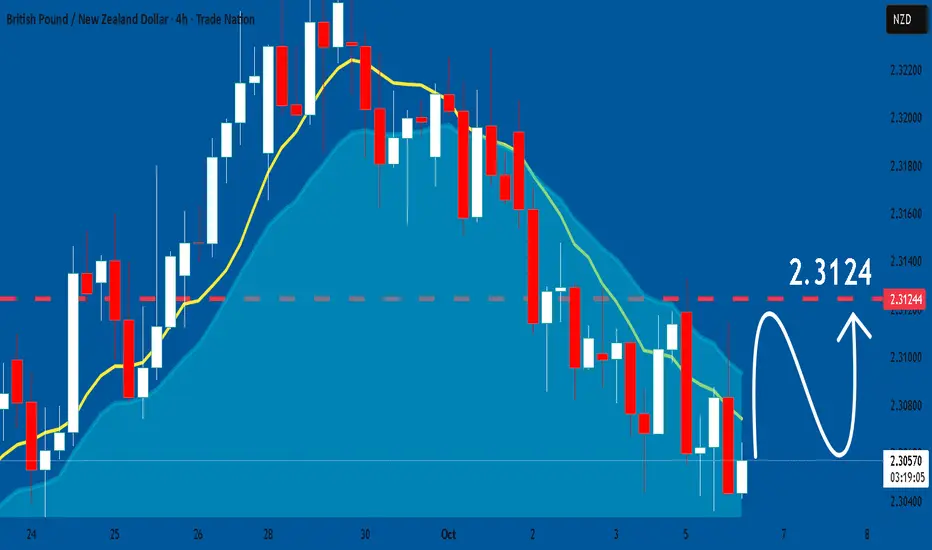
NZDUSD: Market Sentiment & Forecast
Balance of buyers and sellers on the NZDUSD pair, that is best felt when all the timeframes are analyzed properly is shifting in favor of the buyers, therefore is it only natural that we go long on the pair.
Disclosure: I am part of Trade Nation's Influencer program and receive a monthly fee for using their TradingView charts in my analysis.
❤️ Please, support our work with like & comment! ❤️
Prediction
EURUSD: Long Trading Opportunity
EURUSD
- Classic bullish formation
- Our team expects pullback
SUGGESTED TRADE:
Swing Trade
Long EURUSD
Entry - 1.1616
Sl - 1.1604
Tp - 1.1636
Our Risk - 1%
Start protection of your profits from lower levels
Disclosure: I am part of Trade Nation's Influencer program and receive a monthly fee for using their TradingView charts in my analysis.
❤️ Please, support our work with like & comment! ❤️

AUDNZD: Bearish Forecast & Bearish Scenario
The recent price action on the AUDNZD pair was keeping me on the fence, however, my bias is slowly but surely changing into the bearish one and I think we will see the price go down.
Disclosure: I am part of Trade Nation's Influencer program and receive a monthly fee for using their TradingView charts in my analysis.
❤️ Please, support our work with like & comment! ❤️

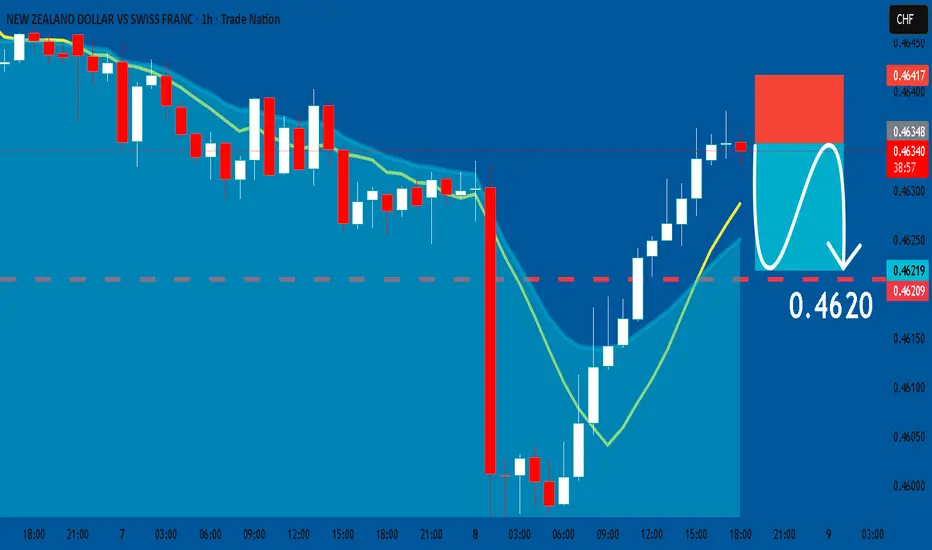
NZDCHF: Short Signal with Entry/SL/TP
NZDCHF
- Classic bearish formation
- Our team expects fall
SUGGESTED TRADE:
Swing Trade
Sell NZDCHF
Entry Level - 0.4634
Sl - 0.4641
Tp - 0.4620
Our Risk - 1%
Start protection of your profits from lower levels
Disclosure: I am part of Trade Nation's Influencer program and receive a monthly fee for using their TradingView charts in my analysis.
❤️ Please, support our work with like & comment! ❤️
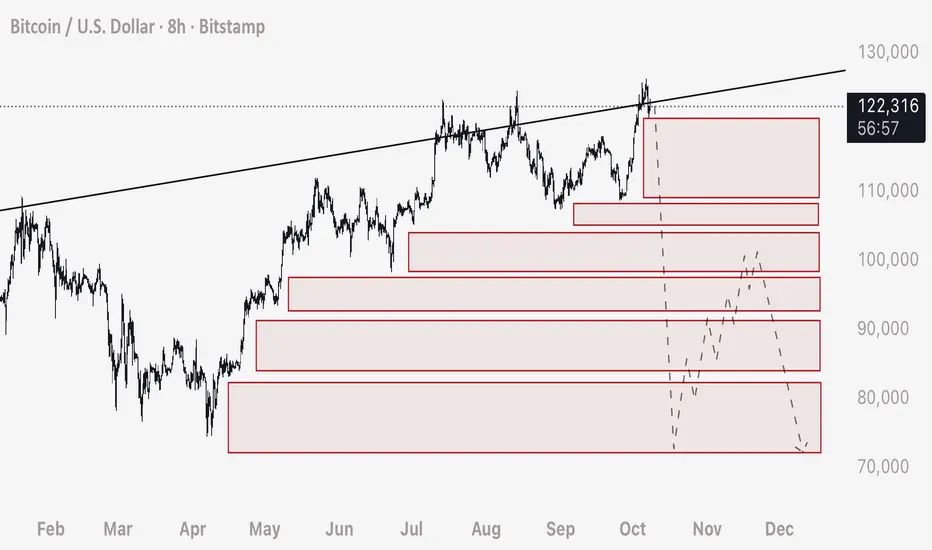
Using Order Blocks to Predict Price Movement on HTFExpanding on my previous post, we can apply this technique to predict price movement on the higher time frames (8 Hour in this case).
Step 1 - Drawing the Boxes
- Fundamentally what we want to do, is look at the price movement and figure out where clusters of stop loss would be contained.
- To do this, we want to look for the areas of upwards (in this example) consolidation that hasn’t dropped down to trigger the orders.
- I have drawn boxes here close to the candle set, and extended them out past where price currently is to prove that these areas have not been reclaimed or had the stop loss orders triggered.
PLEASE NOTE: Stop Loss orders and Liquidation Orders are very unique. Unlike limit orders that will automatically fill if price is above or below, these orders do not fill unless price CROSSES the exact price of the order. In essence, it’s important to understand that looking back on the chart we can understand there are limit orders for sells (in this example) that’s below the current price. If a limit sell order was to be placed at a lower price, it would fill automatically if price is above.
- We can anticipate a take profit (locally in this example) at 74,000. SHORT entry should be where the orders begin to set off to a large degree, in this example, entry would be BELOW where price currently is, at 122,200. We want to make sure that the stop loss orders will be enough to carry the price through these blocks. Stop loss can be places above the local wick high (where the SHORT stop losses have already been filled) at 123,900.
Step 2 - Predicting and Understanding Wick Speed
- To predict how fast the movement will complete, we need only evaluate the amount of TIME allowed for positions to be placed (longs in this example). Very simply because the more time provided to traders in an upwards consolidation, the more positions and consequently stop losses and liquidations will be placed below the price.
- More TIME = More Orders = Faster Wick Speed. To understand this another way, imagine there was 2 scenarios where regular limit buys were placed. Scenario 1 has 100 people placing buy orders, Scenario 2 has 10,000 people placing buy orders. Scenario 2 would move price higher at a faster speed, and to a greater distance. In other words we are predicting VOLUME of STOP LOSS ORDERS.
PLEASE NOTE: Stop Loss orders move price at a greater volume compared to the position entry. If Trader A uses $1,000 to open a Long, and uses a leverage of 10x - his Stop Loss or Liquidation order is to close the entire leveraged position size. While he is injecting $1,000 of liquidity into the market with his order, he is consequently leaving a sell order underneath his entry for $10,000 (leveraged position size).
PLEASE NOTE: The placement and amounts contained in stop losses or liquidations are not available to the public. Exchanges do not need to disclose that information, and you can assume it’s only shared with the market makers or liquidity providers. Heatmap Platforms such as Coinglass have disclaimers that state it’s not based on true date and is only a prediction.
SUMMARY:
I hope this serves you with a practical demonstration of how we can use Stop Loss analysis to predict price movement.
I also hope that you can understand you’re able to do this yourself by developing the vision to quickly see it in the chart. We are blessed in that we simply need to look backwards to see where we will be going next, as the orders that move Bitcoin are previously embedded in the chart.
Yours truly and all the best,
- DD
If you have any questions or want further clarifications - please ask in the comments and I will answer you.
GBPCHF: Bears Will Push Lower
It is essential that we apply multitimeframe technical analysis and there is no better example of why that is the case than the current GBPCHF chart which, if analyzed properly, clearly points in the downward direction.
Disclosure: I am part of Trade Nation's Influencer program and receive a monthly fee for using their TradingView charts in my analysis.
❤️ Please, support our work with like & comment! ❤️

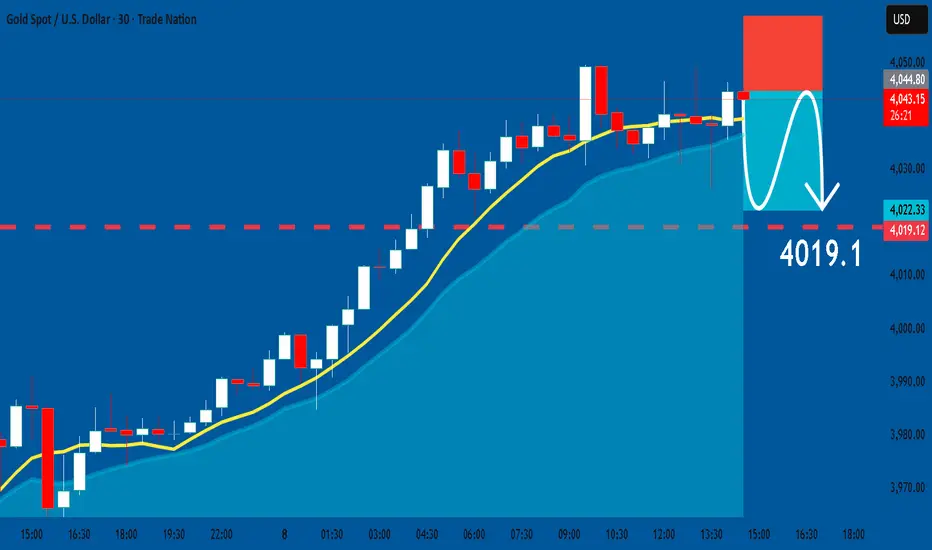
GOLD: Short Trade with Entry/SL/TP
GOLD
- Classic bearish formation
- Our team expects pullback
SUGGESTED TRADE:
Swing Trade
Short GOLD
Entry - 4045.1
Sl - 4058.9
Tp - 4019.1
Our Risk - 1%
Start protection of your profits from lower levels
Disclosure: I am part of Trade Nation's Influencer program and receive a monthly fee for using their TradingView charts in my analysis.
❤️ Please, support our work with like & comment! ❤️
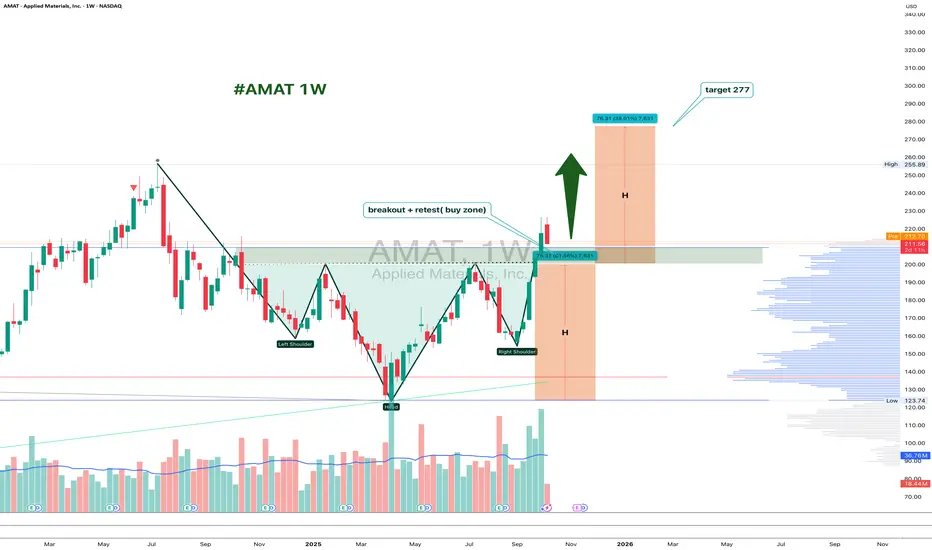
AMAT 1W: Retesting the Neckline Before the Next Move?On the weekly chart, Applied Materials (AMAT) has completed a clean inverted head and shoulders breakout around $226, and is now pulling back to retest the neckline zone near $200–211.
This area acts as strong support. If buyers defend it, the bullish pattern stays valid, with a projected target around $277, matching the 1.618 Fibonacci extension.
From a fundamental perspective, AMAT remains a key semiconductor player, benefiting from ongoing demand for chip-making equipment. The pullback looks more like a healthy pause than weakness - a classic chance for latecomers to re-enter.
Funny enough, the “head and shoulders” pattern, known for signaling tops, is doing the exact opposite here - apparently, even the market likes a good plot twist.
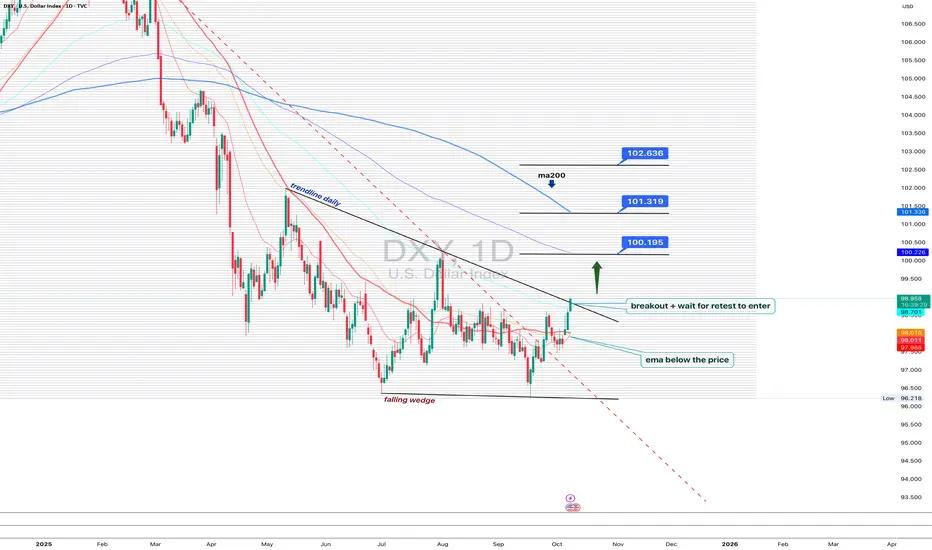
DXY 1D - dollar waking up, but patience is keyOn the daily chart, the US Dollar Index is showing the first signs of recovery: a falling wedge breakout and trendline breach hint that bulls are slowly reclaiming control. Price has moved above the EMA, a short-term bullish signal.
Still, MA200 remains above, reminding us that the broader trend is not yet flipped. The ideal play here - wait for a retest of the breakout trendline to confirm buyers’ strength before jumping in.
If price holds above 99.70, the next upside targets sit around 100.19, 101.31, and 102.63.
But keep in mind - DXY loves to test patience. False breakouts are its favorite sport.
Right now, the dollar looks ready to wake up, but maybe hit the snooze button one last time before the real move begins.
Gold will face heavy rejection from 3,970 zone OANDA:XAUUSD
Short-term correction possible before bulls regain control!
Expecting a drop toward 3,900–3,890 zone before next leg up 📉➡️📈
📍 Entry (Sell Zone) → 3,950–3,960
🎯 Targets → 3,910 / 3,895
⛔ SL → 3,975
Stay patient — retracement could offer the next big long setup!

GBPUSD: Bulls Will Push
The charts are full of distraction, disturbance and are a graveyard of fear and greed which shall not cloud our judgement on the current state of affairs in the GBPUSD pair price action which suggests a high likelihood of a coming move up.
Disclosure: I am part of Trade Nation's Influencer program and receive a monthly fee for using their TradingView charts in my analysis.
❤️ Please, support our work with like & comment! ❤️

GBPCAD: Long Trade with Entry/SL/TP
GBPCAD
- Classic bullish pattern
- Our team expects retracement
SUGGESTED TRADE:
Swing Trade
Buy GBPCAD
Entry - 1.8727
Stop - 1.8708
Take - 1.8764
Our Risk - 1%
Start protection of your profits from lower levels
Disclosure: I am part of Trade Nation's Influencer program and receive a monthly fee for using their TradingView charts in my analysis.
❤️ Please, support our work with like & comment! ❤️

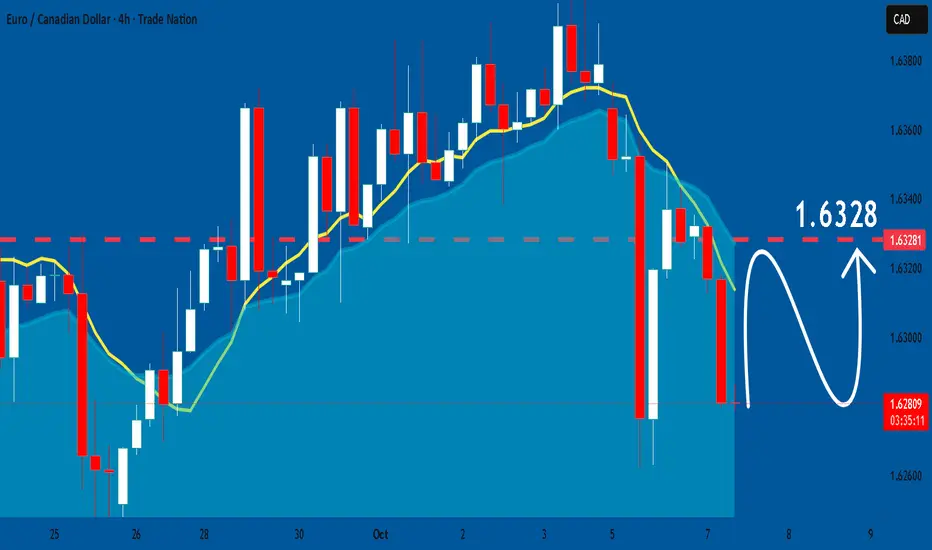
EURCAD: Will Keep Growing! Here is Why:
The price of EURCAD will most likely increase soon enough, due to the demand beginning to exceed supply which we can see by looking at the chart of the pair.
Disclosure: I am part of Trade Nation's Influencer program and receive a monthly fee for using their TradingView charts in my analysis.
❤️ Please, support our work with like & comment! ❤️
EURUSD: Bullish Continuation & Long Trade
EURUSD
- Classic bullish setup
- Our team expects bullish continuation
SUGGESTED TRADE:
Swing Trade
Long EURUSD
Entry Point - 1.1665
Stop Loss - 1.1653
Take Profit - 1.1695
Our Risk - 1%
Start protection of your profits from lower levels
Disclosure: I am part of Trade Nation's Influencer program and receive a monthly fee for using their TradingView charts in my analysis.
❤️ Please, support our work with like & comment! ❤️

GBPNZD: Bullish Continuation is Expected! Here is Why:
Our strategy, polished by years of trial and error has helped us identify what seems to be a great trading opportunity and we are here to share it with you as the time is ripe for us to buy GBPNZD.
Disclosure: I am part of Trade Nation's Influencer program and receive a monthly fee for using their TradingView charts in my analysis.
❤️ Please, support our work with like & comment! ❤️
GBPAUD: Great Trading Opportunity
GBPAUD
- Classic bullish formation
- Our team expects growth
SUGGESTED TRADE:
Swing Trade
Buy GBPAUD
Entry Level - 2.0337
Sl - 2.0322
Tp - 2.0370
Our Risk - 1%
Start protection of your profits from lower levels
Disclosure: I am part of Trade Nation's Influencer program and receive a monthly fee for using their TradingView charts in my analysis.
❤️ Please, support our work with like & comment! ❤️

EURGBP: Growth & Bullish Continuation
The recent price action on the EURGBP pair was keeping me on the fence, however, my bias is slowly but surely changing into the bullish one and I think we will see the price go up.
Disclosure: I am part of Trade Nation's Influencer program and receive a monthly fee for using their TradingView charts in my analysis.
❤️ Please, support our work with like & comment! ❤️

GOLD: Bearish Continuation & Short Signal
GOLD
- Classic bearish pattern
- Our team expects retracement
SUGGESTED TRADE:
Swing Trade
Sell GOLD
Entry - 3940.7
Stop - 3954.8
Take - 3915.7
Our Risk - 1%
Start protection of your profits from lower levels
Disclosure: I am part of Trade Nation's Influencer program and receive a monthly fee for using their TradingView charts in my analysis.
❤️ Please, support our work with like & comment! ❤️

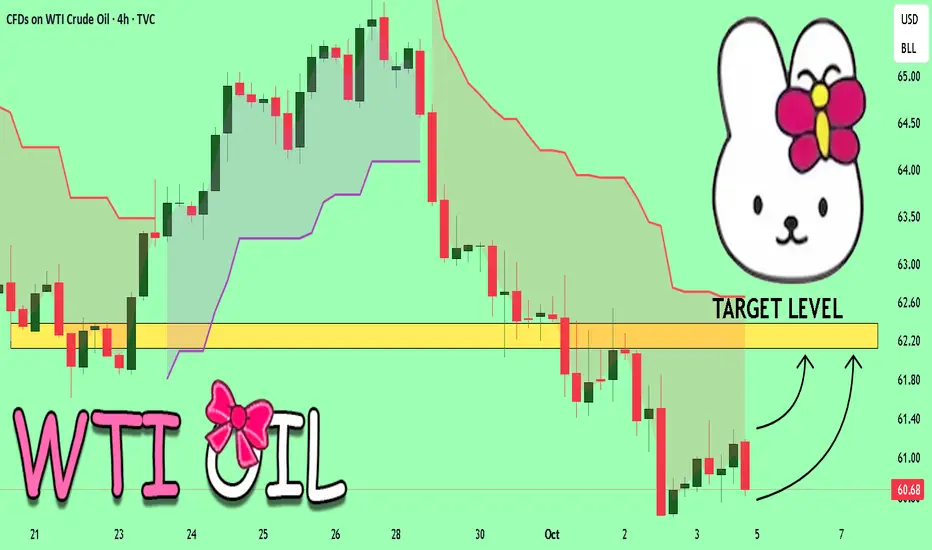
USOIL On The Rise! BUY!
My dear friends,
Please, find my technical outlook for USOIL below:
The instrument tests an important psychological level 60.68
Bias - Bullish
Technical Indicators: Supper Trend gives a precise Bullish
Super-trend indicator is more useful in trending markets where there are clear uptrends and downtrends in price. signal, while Pivot Point HL predicts price changes and potential reversals in the market.
Target - 62.13
About Used Indicators:
Super-trend indicator is more useful in trending markets where there are clear uptrends and downtrends in price.
Disclosure: I am part of Trade Nation's Influencer program and receive a monthly fee for using their TradingView charts in my analysis.
———————————
WISH YOU ALL LUCK
USDCHF: Growth & Bullish Forecast
It is essential that we apply multitimeframe technical analysis and there is no better example of why that is the case than the current USDCHF chart which, if analyzed properly, clearly points in the upward direction.
Disclosure: I am part of Trade Nation's Influencer program and receive a monthly fee for using their TradingView charts in my analysis.
❤️ Please, support our work with like & comment! ❤️

EURUSD: Short Trading Opportunity
EURUSD
- Classic bearish setup
- Our team expects bearish continuation
SUGGESTED TRADE:
Swing Trade
Short EURUSD
Entry Point - 1.1741
Stop Loss - 1.1750
Take Profit - 1.1724
Our Risk - 1%
Start protection of your profits from lower levels
Disclosure: I am part of Trade Nation's Influencer program and receive a monthly fee for using their TradingView charts in my analysis.
❤️ Please, support our work with like & comment! ❤️

AUDNZD: Will Keep Growing! Here is Why:
The analysis of the AUDNZD chart clearly shows us that the pair is finally about to go up due to the rising pressure from the buyers.
❤️ Please, support our work with like & comment! ❤️

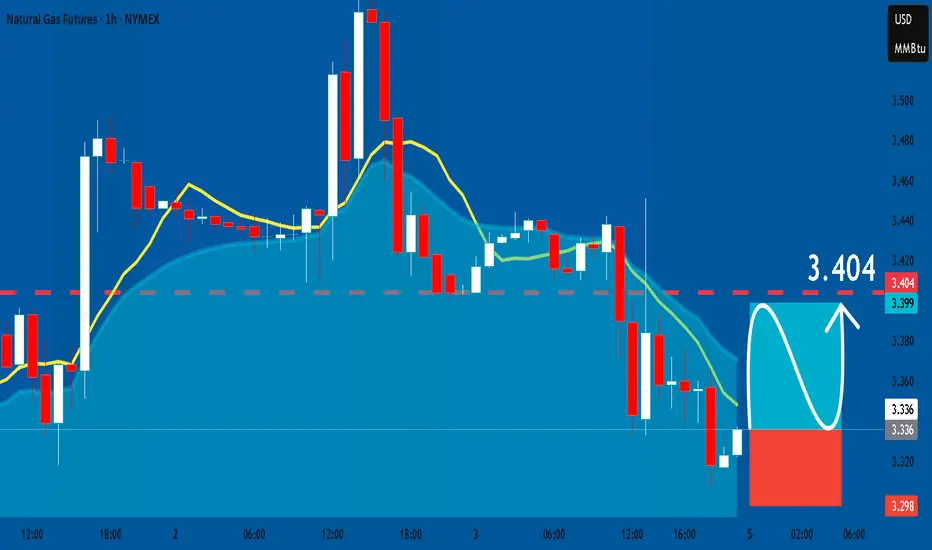
NATGAS: Long Signal Explained
NATGAS
- Classic bullish formation
- Our team expects pullback
SUGGESTED TRADE:
Swing Trade
Long NATGAS
Entry - 3.336
Sl - 3.298
Tp - 3.404
Our Risk - 1%
Start protection of your profits from lower levels
Disclosure: I am part of Trade Nation's Influencer program and receive a monthly fee for using their TradingView charts in my analysis.
❤️ Please, support our work with like & comment! ❤️