Algotrading XTZUSDTPress "Grab this chart", run strategy tester for entire history and make sure that is good time for a long to yellow line
Profitable

GOLD TRADEGold looking to buy will use a buy stop and be in on the trade will try to target obviously visible highs and keep things simple

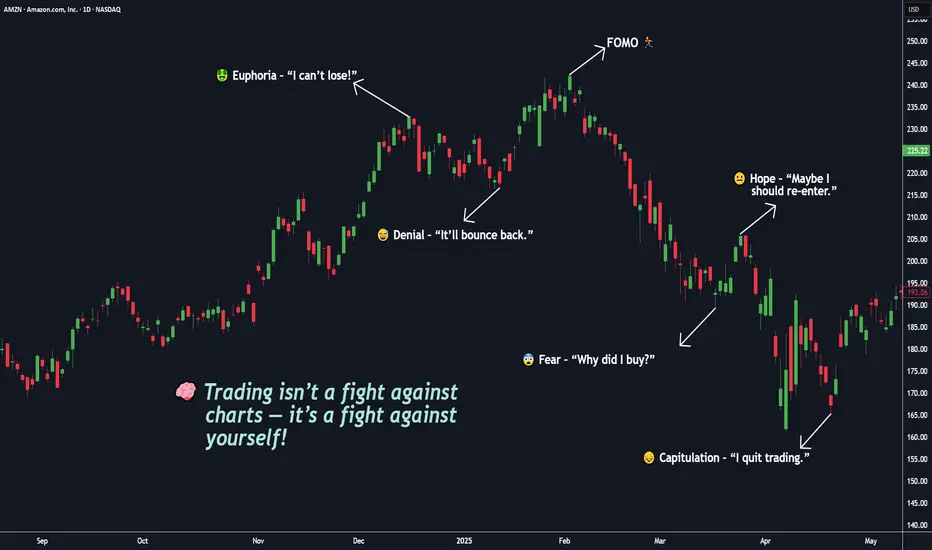
You’re Not Competing With the Market, You’re Competing With Self🧠 Trading isn’t a fight against charts — it’s a fight against yourself.
If you’ve ever told yourself “I’ll just take one more trade”, you already know this battle.
But in truth — the real battle happens inside your mind.
You start your day with discipline: BITSTAMP:BTCUSD , NASDAQ:AMZN , OANDA:XAUUSD , NASDAQ:META
📋 “ Two setups max. 1% risk. No emotions. ”
But then the market shows you something that looks perfect.
Price moves fast. Your pulse jumps. You click “BUY BUY BUY.”
Seconds later , the candle reverses — and suddenly, you chase a candle, break a rule, or move your stop just to “ give it a little more space ,” you’re not losing to the market my friend, You’re losing to your own impulses. ⚔️
You’re not trading the chart anymore — you’re trading your hope. And that’s what makes trading beautiful — it’s not a test of intelligence, it’s a mirror of your self-awareness.
That’s when the market does what it always does: it punishes emotional decisions and rewards patient ones.
💭 Emotionally! You start bargaining with yourself:
“It’ll come back.” ( When you’re greedy → it exposes it. )
“I’ll just move my stop a little.” ( When you’re fearful → it magnifies it. )
“Let me add to average out.” ( When you’re calm → it rewards it. )
The market doesn’t care if you win or lose. It simply amplifies your inner state.
You Digest it or not!, the truth most don’t want to accept:
You can’t control the market.
You can’t control news, indicators, or price spikes.
But you can control your reactions.
The moment you stop reacting and start observing — your trading transforms.
Clarity comes only when emotion leaves. 💎
⚡ Trading isn’t about predicting moves — it’s about managing yourself during those moves.
🎯 Real-Life Example:
Think back to the last time you made money on a random FOMO entry. It felt good, right?
That “instant win” wired your brain to believe impulsiveness works.
But the next time, that same instinct cost you twice as much.
That’s recency bias — one of trading’s silent killers.
Your brain craves the last emotion it felt, not the right decision.
💎 True mastery begins when you stop asking:
“Why did the market do that?”
and start asking:
“Why did I react like that?” ( 👉 “ Am I reacting, or am I responding ?” )
The market has no emotions . It’s just reflecting yours back at you — amplified, delayed, and multiplied by leverage. ⚔️
🧩 Here’s the mindset shift, that changes everything:
You don’t need to win every trade. You need to trade as if you already know yourself.
You don’t need a better indicator. You need a clearer mirror.
The edge isn’t on the screen — it’s inside your head.
When you realize that, trading becomes peaceful and You stop chasing, You start choosing.
Master that single question, and you’ll outperform 90% of traders who never will.
💬 What’s one emotion you think costs you the most trades —
👉 Fear 😨
👉 Greed 🤑
👉 Impatience ⚡
🧩 Drop it below 👇 and let’s talk about how to overcome it — build awareness together as traders, not competitors.
If this Idea gave you a value information then please, Boost it, share your thoughts in comments, and follow for more practical trading!
Happy Trading & Investing!
Team @TradeWithKeshhav
Go LongIm long on XAU, target is last Sunday opening. SL at the 110. May come back to Thurs opening and there is reason to drop farther. My pattern is there I'm long. 'The move is more valuable than the money." The Profitable Loser. See him on YT also Dave teaches fx. No chart is safe!

The real reason you aren't profitable, YETHumble yourself and come to realize that:
1. Nothing is on YOUR time
2. You don't know everything
3. You cannot win every single trade
Most traders struggle in 1 or all of these areas and thus it stops them from actually progressing forward.
Pride cometh before the fall.....

Battle-tested through the ups and downs of Etherium historyA trading strategy that's been battle-tested through the ups and downs of Eth's history. This strategy doesn't blink in the face of market chaos or get swayed by emotions. It's a calculated game plan that knows when to step in and when to step back.
Compare that to emotional investing, where fear and greed call the shots. Imagine making decisions when you're on an emotional rollercoaster—buying high in excitement and selling low in panic. That's a recipe for disaster.
A backtested risk-managed strategy, though, is like a cool-headed coach that sticks to the game plan no matter what. It's about discipline, rules, and consistency. So, do you want to ride the emotional wave or play the long game with a strategy that has been consistently profitable year on year since 2016 (start of Eth - substantiated by backtest data).
Average annual net profit (substantiated by the backtest)
196% (No Leverage) & 661% (3x leverage)
This year (Jan 2023 to Sep/15th/2023) has already generated
45.21% (no leverage) 144.93% (3x leverage) in net profit.
This strategy does Not re-paint, No-look ahead bias. and 100% forward tested. Tradingview has a default caution for strategies that use the multitimeframes data. This does not apply to this strategy as all calculations are based on closed bars.
So how does it work?
Postions are entered based on RSI Divergence on Higher Timeframes and confirmed by the ATR.
Stop Loss and Trailing ATR-based Take Profit:The strategy incorporates a risk management mechanism with a built-in stop loss set at 8%. Additionally, it employs a trailing take profit mechanism based on ATR. This means that as the trade moves in the desired direction, the take profit level adjusts itself based on the current volatility, allowing for gains to be secured as the trend progresses.
SMI-based Re-entry after Stop-out:
Stochastic Momentum Index (SMI) is used as a re-entry signal if the trade is stopped out (i.e., the stop loss is triggered). This re-entry is contingent on higher timeframes and ATR still supporting the original trend, indicating that the initial stop-out may have been a false signal.
Portfolio Reinvestment for Compound Growth:
The strategy allocates 95% of the portfolio's capital to each trade.
This approach maximizes the potential for compound growth, as a significant portion of the available capital is reinvested in each trade, provided that risk management rules are satisfied. This approach is appropriate for this strategy as strict risk management is applied and the winrate is almost 50%
Accounting for Exchange Fees:
Exchange fees, set at 0.1%, are factored into the strategy's calculations.
This ensures that trading decisions take into account the cost of executing trades on the exchange.
Avoiding Lookahead Bias and Repainting:
The strategy is designed to prevent lookahead bias by making calculations based only on closed bars of price data. Lookahead bias occurs when future data is used to make past trading decisions, potentially leading to unrealistic expectations.

NATURAL GAS BEARISH TREND IS ABOUT TO CONTINUEMy analysis for CAPITALCOM:NATURALGAS please BOOST and FOLLOW for more analysis and trading ideas

NATURAL GAS END OF CORRECTION AND TIME TO LET THE BULLS LOOSE!My analysis for CAPITALCOM:NATURALGAS for the week commencing 10/07/2023

Most Profitable (and Realistic) TradingView Strategy In 2022Setting up and checking the performance report of one of the most realistic strategy signals on TradingView.
COINBASE:BTCUSD

Technical Pull back Buy the DIP!The slight gross margin decrease of 4.8% was enough to resume the HS pattern on the chart executing a normal pullback- relative to the "neckline" where HS patterns are confirmed with some other criterion. Despite the quarterly margin contraction, expected cost reductions should start to materialize in 2024. Everything on the income statement is trending in the right direction. If TSLA really does hit the pattern target of HKEX:80 , a 50% further decrease from current SP, which is based on a formula of probabilities for this specific pattern, then it will be 62% undervalued.
At SP of 80, subtracting the 5.14 of Cash per share, and using current TTM, the PE would be 21! Even with a PE of 49 GAAP TTM , the difference to sector is 222% and FWD PE of 50.5. However several different metrics between growth and profitability could easily justify it where its at now. EBITDA growth YoY 3,607% diff to sector,/ FWD 690% diff to sector; Rev Growth Fwd 393%. EV/EBIDTA FWD 180 % diff to sector. Net Income Margin TTM 247% diff to sector. ROC TTM 193 and ROA TTM 289% differences to sector... Easily justified.. Rarely are you able to purchase growth companies at a PE of 21... Buy the DIP!

Trend Pro Live Example: BTC Breakout + AUDCHF Recap 20% Return!Enjoy! Hope you learned something from this analysis using the Trend Pro Strategy. For any questions, please don't hesitate to check my profile or message me. Thanks!

The Best 2023 TradingView Signal Strategy For Profitable TradingSetting up and checking the performance report of one of the most realistic strategy signals on TradingView for Forex, Crypto, and Stocks.

Back from vacation! Going for 8R on bearish AUDCHFHow's everybody doing? Currently trailing profits at about 2.5R on this trade using "High" risk setting on our Trend Pro Strategy. Looking to hit the support level which will net 8R, let's see how it goes. It's been a long vacation and hoping to record a few videos soon!

MATIC : Looking for a 2X Profits Probability?!I dont have much to say about Polygon. It surely is and must be considered as one of the highly rated potential projects.
Fundamental wise it surely did show its strength through out the bear market specially by having a well articulated mainstream media coverage while it collaborate with heavy names in different sectors around the world mostly from the developed nations.
How about the Technical Aspect?
Well, this question surely is dependent on the overall crypto market sentiment. Specially if it is going to be the starting of an alt season #MATIC will be one of the best performers in the market. But what if Bitcoin fails to achieve and continue its strength and go in search of a new lower low. Then it will be a good accumulation opportunity to grab more to our pockets.
For now lets try to hear the chart's heart beat looking a little bit closer. In this post I will just raise three main reasons for saying #Matic is showing a bullish alert at least for the long term.
1/ PATTERN FORMATION : The formation of a major triangle consisting of minor neutral triangles is formed. And it just broke out by the past week and trying to continue the momentum in the North direction. Last week's candle also close above a major resistance area at around $0.93 breaking out from the traingle strongly passing the EMA levels.
2/ Guppy Moving Average: This indicator is showing that a bullish sentiment in the market is already here on the 1D chart and the shorter period EMA's are trying to pass past the longer period EMA's which will be considered bullish as far as they are moving below the current price.
3/ RSI: RSI line is looking in a bullish setup and is in a healthy movement in addition to the fact that it crosses the RSI based MA which is a bullish sign by itself.
This analysis is mainly consider to view from a Mid to Long Term investment opportunity and more or less for hodling for some time.
Accumulation Area : $0.9 - $1.1
Target Area : $2.9+
Mean while, I will give updates on the shorter term sentiments about #Matic.
If you agree with this analysis drop a like and share it to someone whom you think will benefit from it. Otherwise please do consider to drop your comments if you have any disagreement on the idea and lets flow the knowledge and benefit mutually.
Stay safe blessed. Stay Tuned too.

Netflix: Breakout, or Range? My advice... WAIT. Here's why.Here's a free signal from our strategy, yet my advise is to wait for the simply reason that earnings are due this week. As trend traders we try to avoid crazy volatility as much as possible, and simply ride the wave when it comes. Netflix price is at a strong resistance level, and can easily be rejected and form a range bound market.
However! If you wish to take the chance to go long, you are free to do so, as long as you keep your risk at MAXIMUM of 1-2% of your equity. And when you lose, do not revenge trade or fomo into markets... just close the charts for a day or so. Risk management and discipline determine the success of any good trader. So in this indicator, you will see that the recommended stop loss price level always equates to a max of 2% per trade.
Hope you learned something, and as always, trade safely.

Trade recap: Making 3.4R from shorting the US-China DivergenceCapped this short at 3.4R using our strategy as we get significant DXY reversal heading into this week's US Retail Sales and Building Permits news. No trades for now as we patiently sit on our hands for the next signal (preferably non-USD for this week, at least).

Possible OIL bearish continuation on the dollar reboundAs DXY bounces on support levels, OIL may continue it's bearish streak and reach for 67.00 level. Staying neutral while waiting for a signal, otherwise price action may reverse to the upside.

Pro Tip: Trading Ichimoku Signals Confluence on Forex!Here's a great example of a clear uptrend using the Ichimoku cloud indicator. Popularized by the Japanese, I really like the clear trend-following visual that Ichimoku provides especially on the daily and weekly time frames for each it was originally designed by its creator, Goichi Hosoda.
Once you have confirmed trends on the higher time frames via Ichimoku, the next step is to confirm entry timings by zooming in to the lower time frames, using your favorite trend-following signals (mine is Trend Pro). This provides great confluence and extra confidence when entering your trades.

Running 2R on CADCHF as it is breaking through key levelsDowntrend may be overheated as it is in an accumulation zone and may range any time, especially with upcoming high impact news. Trade safely!

NZDCAD continuously bullish going 2 months, may continueTread carefully as this pair may be over extended. Earliest bullish signal caught back in October 19th.

Silver/XAGUSD may be continuously bullish after NFPTrend riders may try take a risk to ride Silver upwards as it breaks previous daily swing high of 23.28235. Watch this space.

Securing 4.7R on USDJPY as bearish divergence continues to rip Taken on moderate setting. Anyone's guess where this downtrend will stop, so we will keep holding.

SHIB : Are we in a real Break OUT? It seems so.Shib is looking very bullish in the 4H chart. We have already gave our insight on the possible breakout of the 1D chart yesterday. We will be updating about this breakout after the close of the current candlestick formation.
