MP Materials:Reversal Structure Developing with Upside Toward 95MP Materials is showing signs of a potential medium-term reversal after reacting strongly from the key $50-52 support zone, where buyers previously stepped in. Price is holding above this area and attempting to break out of the descending structure, forming higher lows on the daily timeframe.
A sustained move above the $60–61 level may signal a shift in short-term momentum in favor of buyers. If price confirms strength above the $62–65 area, upside targets open toward $70-73, followed by $77-79, with a broader objective near the $90-95 supply zone, where profit-taking activity is likely.
As long as price remains above $55, the recovery scenario remains valid. The alternative scenario would activate on a break below $55, increasing the probability of a retest of the $50-52 support zone, which, if broken, would invalidate the bullish reversal structure.
This is not investment advice. Trading decisions should be based on confirmed structure and price reaction.
Profitabletrading

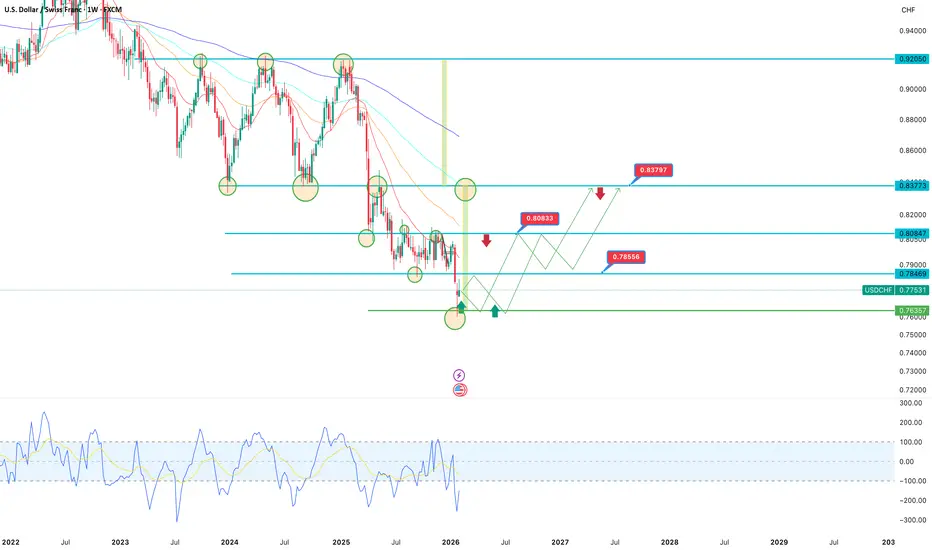
USDCHF: Long-term Bearish Trend Persists Since 2022, the pair has been in a steady downtrend: consistent lower highs and lower lows within a multi-year descending channel from highs near 0.9200-0.9400.
Current price around 0.7753, following a bounce from the multi-year low at 0.76357 (green support zone marked on the chart).
Support:
0.76357 (critical multi-year zone, green line), below - potential extension to 0.7600-0.7550 (channel projection).
Resistance:
0.80833 (intermediate level, 2025 low), higher - 0.83797 and 0.84847 (next Seller Zones).
Long-term downside target: 0.7635-0.7600 (primary buyer zone on weekly), break below opens path toward 0.7400+.
Current structure remains bearish:
after a false upside breakout in 2025, price returned to the channel and is forming lower lows. Volume profile and oscillators indicate fading bullish momentum, with CHF staying strong amid risks and SNB policy.
Primary scenario - continued downside: holding below 0.7850-0.7900 leads to test of
0.7635-0.7600 in the coming months.
Bullish alternative (low probability): strong bounce from 0.7635 with break above 0.80833 targeting 0.83797 - would require sharp CHF weakness or aggressive Fed easing.
Fundamentally, the franc benefits as a safe-haven amid global uncertainty, while the dollar loses ground. Looking for weekly candle close below 0.7700 to confirm stronger bearish conviction.
Your view?
Short from current levels or waiting for a bounce off 0.7635? Share your thoughts in the comments.
XAUUSD Trading Idea: Corrective Buy Gold is showing signs of stabilization after a sharp decline, with price consolidating above the 4880-4900 demand zone. The current price action suggests that the recent pullback is corrective rather than impulsive. A break above the local descending structure supports the bullish correction scenario, while moving averages continue to provide dynamic support. Momentum is improving, indicating that buyers are attempting to push price higher toward key resistance levels.
In the main scenario, long positions are considered from the 4880-4900 range,
targeting 5000-5090 as intermediate resistance levels.
The final bullish target is the 5370-5400 zone. This area is considered a strong resistance, where a potential trend reversal or deeper correction may occur, opening opportunities for short positions if confirmed by price action.
In the larger context, gold remains sensitive to macroeconomic expectations and risk sentiment. Despite the lack of a clear long-term bullish fundamental driver, the technical structure allows for continued upside movement before the market makes its next major directional decision.

UMAC: when unusual machines start printing moneyUnusual Machines operates in a high-risk, niche technology segment driven by speculative demand and rapid capital rotation. Recent attention to the stock has increased sharply due to volume expansion and growing market interest. This is not a value-driven story but a momentum-driven one, where price behavior and liquidity flows dominate decision-making. Such stocks are often used by funds and traders during risk-on phases to accelerate returns through volatility.
Technically, UMAC has broken out from a long accumulation base and confirmed a structural trend shift. Price is holding above the key 0.618 Fibonacci level, signaling strong bullish control. The current structure resembles post-breakout consolidation with continuation potential. The primary scenario targets 26.1 and 39.3 based on Fibonacci extensions, provided price holds above the 17.5–18.0 zone. An alternative scenario allows for a pullback toward 12.8–13.0, which may act as a re-entry support zone. CCI remains in positive territory, confirming sustained momentum.
When markets reward risk, stocks like this do not move quietly. They move fast, and they move without apology.

Long Signal AUDNZDWe have just received a long signal for AUDNZD. This trade has a 80% profitability rate with a average trade profit of 2.8%.

Long Signal EURUSDWe have just received a long signal for EURUSD on 1 Monthly timeframe through our IPS indicator. This has a profitability rate of 48% and average winning trade of 8%. Very low risk trading strategy and safe for leveraged trading.
This trading signal is also paired with a strong buying reaction off 1 month demand zone at 1.00.

LONG ON UJ PART 2Possible push to the upside on UJ
Sell Side Liquidity taken and the high broken right after giving me the impression that big institutions may have forced the SSL in order to enter the market
1;55 rr, may seem far fetched but looks like a good trade to me
Second part of UJ trade i posted with a lightly different point of entry

LONG ON UJPossible push to the upside on UJ
Sell Side Liquidity taken and the high broken right after giving me the impression that big institutions may have forced the SSL in order to enter the market
1;50 rr, may seem far fetched but looks like a good trade to me
possibility to get stopped out because of the tight SL
safer sl would be 153.550

LONG ON NZDCADBOS followed by a grab on SSL(Sell Side Liquidity)
Indicates neeed to go to the upside so liquidity was taken below in the form of SL's from Buy orders and Sell limits/ orders places

SHORT ON GAChanged opinion on GA, upon further analysis the trend shows bearish motion
stop hunts taken after the X symbol heading to break the lows created, possible buys to the area of interest then we sell
Placed a very tight sl of about 10 pips to give me a trade with an over 1;20 rr

LONG ON GAsimilar to the schematic i always use, always looking for a valid Stop hunt this side being on the SSL side which fueled the initial move to break the last high.
This left us with a high probability blueprint of where exactly higher or bigger institutions entered the market.
decent 1;12 rr trade, black line below liquidity was a regular entry but i prefer a more defined OB thus i am entering much lower
Lets wait and see how the trade runs out

Possible long on GUSell side liquidity taken in order to force a break of structure.
this Stop Hunt gives a blueprint of where instituitions entered the market after collecting sell order and stop losses on buys(sell side liquidity).
Using this knowledge i have set pedning buy orders targeting the last major high, analysis done using H4 and H2 timeframes

LONG ON USDJPYSimilar to my last Cadjpy setup
clear motion to go top side
liquidty below to be grabbed first before push to the upside
1;15 rr trade

LONG POSITION ON CADJPYClear push to the upside pending, Liquidity below must be collected first in order to make a push to the upside.
1;10 rr for the first entry
1;20 rr for the second entry
used SMC to analyse with heavy bias on where liquidity is
SEE LIQUIDITY OR BE THE LIQUIDITY

Algotrading DOTUSDTPress "Grab this chart", run strategy tester and make sure that is good time for a long to yellow line

HUGE SPIKE ON BITCOIN - BTCUSDBitcoin has triggered a spike and opened a trade, just as I had seen it and thought it would play out due to its price and recent highs

EURJPY BUYEurjpy small scalp within the trend and will now allow it to trigger us into a trade and scalp to the upside

GOLD UPDATE Gold has been behaving well and it would be best to always close partial profits where necessary to help secure the profits , it has huge potential to the upside to the recent highs

TRADES PROFITABLE EURJPYWe’ve taken back to back trades on Eurjpy and we’ve maintained a good track record of hitting ( TAKE PROFIT )

EURJPY WINING Eurjpy has supported our trading plan by acting accordingly and following what was expected to happen and will keep the same approach to get more trades

BUY EUROYEN EURJPYEurjpy trade idea which is to buy and target the last previous highs and price points

BACK TO BACK PROFITS EURJPY We’ve had back to back trades taken on Eurjpy and we managed to make sure they were all successful, we will keep following what the market shows us and take opportunities when presented to us

HUGE PROFITS EURJPY Eurjpy in huge profits , hitting (TAKE PROFITS) and now will continue to the upside looking to take more trades in future
