Gold at $5k? RSI divergence vs. breakout – which comes first?Gold is just $30 away from the historic $5,000 level, and silver is approaching $100 for the first time ever. But before you chase the breakout, we need to talk about the RSI divergence flashing on multiple timeframes and what it means for the next move.
In this video, we analyse the technical setup as gold approaches the most critical resistance level of this bull run. We explain why the "no safe haven" thesis—with the dollar collapsing on Greenland tensions and the yen crashing past 158 after the BOJ decision—is flooding capital into precious metals. But we also map out the warning signs that suggest $5K could trigger heavy profit-taking.
Key topics :
Measured move complete : The corrective leg projects to 4,930, which we just hit. Similarly, the Elliott Wave net distance (Waves 1-4) also targets the same level—two confluences at resistance.
Accelerated channel : Gold is trading in a parabolic, accelerated channel. As long as we hold 4,680 (61.8% Fib on daily) and 4,770 (61.8% Fib on 4H), the bias remains bullish.
RSI divergence : Weekly, daily, and 4-hour charts all show bearish divergence. Price is making new highs, but momentum is not confirming—classic topping behaviour.
The $5K test : Next upside targets are 5,012, 5,100, and 5,200. But $5K might be where sell orders are stacked. A failure here could trigger a sharp correction to 4,770-4,800.
Risky counter-trend Play : For the brave, a short at $5K with a stop at $5,050 and a target at $4,770 (61.8% support). But remember: "The trend is your friend."
Are you buying the dip or fading the $5K level? Let us know in the comments!
This content is not directed to residents of the EU or UK. Any opinions, news, research, analyses, prices or other information contained on this website is provided as general market commentary and does not constitute investment advice. ThinkMarkets will not accept liability for any loss or damage including, without limitation, to any loss of profit which may arise directly or indirectly from use of or reliance on such information.
Profittaking

Gold crashes 5%! Dead cat bounce or buy-the-dip opportunity?Gold has taken a brutal hit, plunging over 5% from the $4,550 highs down to $4,300 as profit-taking slams the market in thin holiday trade. We are now seeing a bounce toward $4,400, but the big question is: is this just a dead cat bounce before a drop to $4,150?
In this video, we analyse the sharp reversal driven by year-end profit-taking and thin liquidity after an extraordinary ~70% rally in 2025. We then map out the critical Fibonacci retracement zones that will determine whether we see a V-shaped recovery or another leg lower.
Key drivers
Profit-taking & thin liquidity : The 5% drop was fuelled by a lack of buyers to absorb heavy selling in a thin, pre-New Year market. This is classic risk-off behaviour after an extended run.
Dead-cat-bounce risk : Bounces to the 38.2% ($4,400) or 50% ($4,430) Fibonacci levels are typical after violent drops. If price rejects here, the technical structure favours another leg down.
Downside targets : A measured move extension from a rejection at $4,400 points to a target around $4,150, which aligns with the 100% Fibonacci extension and previous support zones.
RSI reset : The 4-hour RSI has swung from overbought to oversold in one go. A bounce to the 50-60 level on the RSI would likely reset momentum for the next wave of selling.
Trade plan Bearish continuation : Sell the rally into $4,400–$4,430, targeting $4,170–$4,180 with a stop above $4,500.
Bullish reversal : Watch for hidden bullish divergence on the RSI or a break above the 61.8% retracement ($4,460) to invalidate the immediate bearish bias.
Are you selling this bounce or waiting for the bottom? Share your plan in the comments, and happy New Year to all traders! See you in 2026.
This content is not directed to residents of the EU or UK. Any opinions, news, research, analyses, prices or other information contained on this website is provided as general market commentary and does not constitute investment advice. ThinkMarkets will not accept liability for any loss or damage including, without limitation, to any loss of profit which may arise directly or indirectly from use of or reliance on such information.

Nasdaq: Sharp tech drop sets up critical support testNasdaq slid 2% yesterday in its sharpest tech-led drop since late summer—are we looking at a healthy correction, or could there be a deeper move ahead?
Caution returned to tech stocks as AI valuations and a handful of Big Tech earnings disappointed. The broader market also retreated, with traders watching for the next move from both the Fed and the earnings calendar.
Key drivers:
AI and semiconductor leaders like Nvidia, AMD, and Palantir led the selloff as investors questioned how much further the AI trade can run.
Hawkish remarks from multiple Fed officials raised doubts about any imminent rate cuts, even after the recent 25bp cut, fuelling profit-taking in volatile growth names.
Top Wall Street banks cautioned about stretched valuations, warning a 10–20% correction was possible as positioning remains crowded in mega caps.
Technically, the Nasdaq is pulling back from historic highs, testing median channel support with RSI retreating toward neutral. Key resistances are near 25500 and 25750, with support showing at 25200 and then under 25k.
Stay nimble and respect the potential range between 25450 and 25870 as pivotal for the next Nasdaq swing. Wait for strong resistance confirmation, but don’t ignore bounce risk if earnings and data surprise to the upside.
This content is not directed to residents of the EU or UK. Any opinions, news, research, analyses, prices or other information contained on this website is provided as general market commentary and does not constitute investment advice. ThinkMarkets will not accept liability for any loss or damage including, without limitation, to any loss of profit which may arise directly or indirectly from use of or reliance on such information.

Why Your Next Trade Means Nothing
🧠 The Notebook Process #2 — Understanding the True Nature of Trading.
Some laws govern everything we do, and trading is no exception, even if it often feels like pure chaos.
Every tick looks random. Every trade feels unique. Yet beneath that noise, a hidden law quietly shapes your results. It’s one of the cornerstones of statistics, and it rules every trading account on Earth: The Central Limit Theorem.
Don’t worry, no math coming your way: just an intuitive truth you can plug directly into your trading mindset.
📖 The Nature of Trading.
Your true profitability, your average win or loss, only begins to emerge and, more importantly, stabilize after a large number of trades.
That’s it. That’s the law.
A single trade? Meaningless. Ten trades? Still noise.
Hundreds of trades? That’s where the truth starts to show. What you see after enough repetitions isn’t randomness anymore: it’s your edge revealing itself.
That’s the Law of Large Numbers and the Central Limit Theorem in motion: pure science.
☑️ What This Means for Traders.
Your system’s real strength, its expectancy, only appears through repetition.
A handful of trades? Still luck. Pure variance, random ups and downs that mean nothing.
A few hundred? Now you’re seeing skill: the signal rising above the noise. In plain English:
“A trading journey can only be evaluated after a large number of trades. That’s why your process matters more than your last result, no matter how good or bad it looked.”
And that’s exactly what The Notebook Process #1 was about: 👉 Evaluate in blocks, not single trades.
💸 Let’s Put the Law to Work:
1️⃣ Take your trading record and compute: Average win, Average loss, and Win rate.
2️⃣ Calculate your expectancy using this simple formula:
(Avg Win × Win Rate) – (Avg Loss × (1 – Win Rate))
3️⃣ That number tells you how much you make (or lose) per trade on average, and more importantly, what you can expect to make in the future.
If it’s positive, you’re trading with an edge. Keep going: reproducibility is what makes it stable.
If it’s negative, stop immediately. The bleeding won’t stop until the math changes.
That’s it. Pure math applied to trading: and believe me, you don’t want to fight this law.
🌍 The Gravity of Trading.
The difference between a trader who understands and one who only tries isn’t talent, it’s focus.
Focus on expectancy, not the win rate, not the reward to risk ratio.
It might seem basic, but so is gravity, and like gravity, it governs you whether you believe in it or not.

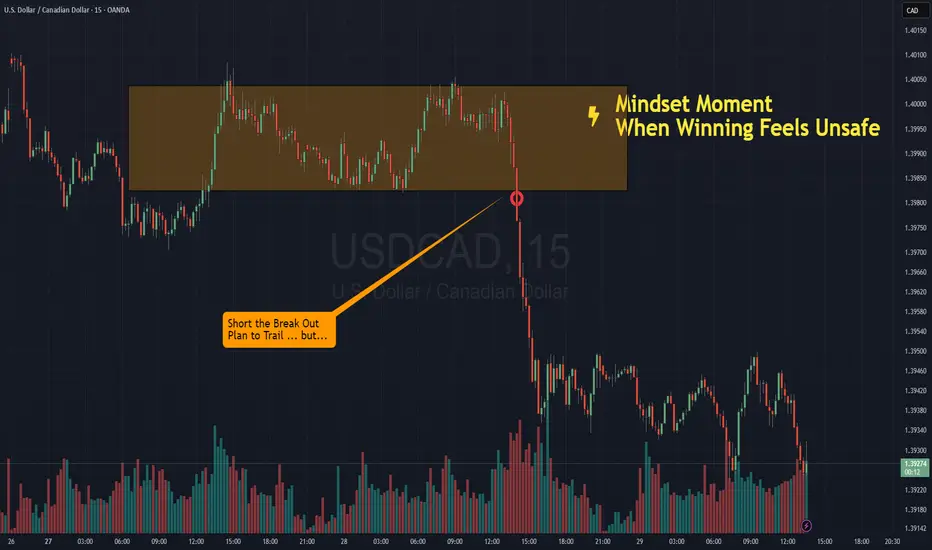
When Winning Feels UnsafeNOTE – This is a post on mindset and emotion. It is not a trade idea or strategy designed to make you money. My intention is to help you preserve your capital, focus, and composure so you can trade your own system with calm and confidence.
You’re in profit.
The trade’s working.
Your system’s doing exactly what it should.
But instead of ease, something tightens.
A flicker of doubt.
You can hear that inner voice: “Don’t mess this up. You wouldn’t want to give this back now would you? How much is enough anyway?”
You scan the chart again.
Check your unrealized PnL.
Move the stop closer.
Start managing… what doesn’t need managing.
Here’s what’s really happening:
Your subconscious is remembering what happened the last time you saw success…
The time you relaxed and it reversed.
The time you felt proud and someone cut you down.
The time you won and it didn’t last.
So even when the market moves in your favour, part of you braces.
Waiting for the other shoe to drop.
So that voice saying, don’t mess this up - is actually a memory trying to protect you.
And in so doing, never really lets you feel safe
The point here is that your work as a trader is to be in the here and now. Not in the past.
Be cognisant to the cues of your memory and body that don’t work in your favour.
So when you notice tension rising,
Take one slow breath. Feel your feet on the floor. And repeat. ‘Right here, right now’.
And then …
Follow your trade plan.
Stay true to your trading plan.
Manage your risk
And let the market do what it does.
Gold suffers biggest crash since 2013: What’s next for metal?Gold just experienced its worst single-day crash since 2013, plunging over 8% from record highs after forming a double top.
What’s behind this dramatic move, and what’s next for gold?
After a strong rally driven by fiscal and trade uncertainty and delayed US economic data, gold suddenly tumbled to the $4,000s. This sharp drop comes amid technical overextension and ahead of a crucial US CPI report due Friday, with the government shutdown still adding to market uncertainty.
Overextended : Gold was heavily overbought on multiple timeframes (4-hour, daily, weekly, monthly), with a double top and weakening RSI signalling a correction was due.
Profit-taking ahead of CPI : Many traders secured profits before Friday’s CPI report, with consensus expecting inflation to tick up, potentially impacting Fed rate expectations and the US dollar.
Trade developments : De-escalation between the US and China, with Trump and Xi set to meet at APEC, reduced some risk premium that had supported gold.
Support and scenarios : Strong support levels remain, with a possible further downside to the 38.2% Fibonacci retracement (~$3,945), but a deeper drop to $3,735 is seen as unlikely unless catalysts turn more bearish.
Volatility is back in the gold market! Will this correction turn into a longer consolidation, or is it just a pause before new highs?
Watch the key levels and upcoming CPI data, and remember—trade smart, respect your risk, and cash out when needed!
This content is not directed to residents of the EU or UK. Any opinions, news, research, analyses, prices or other information contained on this website is provided as general market commentary and does not constitute investment advice. ThinkMarkets will not accept liability for any loss or damage including, without limitation, to any loss of profit which may arise directly or indirectly from use of or reliance on such information.

Master High-Probability Breakouts with the GOLDEN Trading SystemWelcome to the GOLDEN Trading System (GTS) – a custom-designed strategy tailored for traders seeking high-probability breakout opportunities. Built on the foundation of TradingView's powerful indicators, GTS focuses on leveraging Camarilla Pivot Levels (H3-H4 and L3-L4) to spot and act on potential market trends. Whether you're a beginner or an experienced trader, this system simplifies the complexity of technical analysis, giving you an edge in the markets.
Core Elements of the Strategy.
1. Key Levels to Watch:
Green Band (H3-H4):
Represents a resistance zone where bullish breakouts are likely to occur. A confirmed breakout above H4 often leads to a strong upward trend.
Red Band (L3-L4):
Acts as a support zone, signaling potential bearish moves when broken. A confirmed breakdown below L4 generally triggers a downward trend.
2. The Breakout Concept:
When the price crosses either of these bands, it indicates a potential shift in market dynamics:
Bullish Breakout: Price breaks above the Green Band, suggesting buyers have gained control.
Bearish Breakout: Price breaks below the Red Band, signaling sellers have the upper hand.
Why This Strategy Works?
High Probability: Camarilla Pivot Levels are widely respected by traders, making breakouts from these zones more reliable.
Trend Confirmation: The system minimizes false signals by focusing on specific breakout levels instead of broader zones.
Clear Entry/Exit Points: You can easily determine when to enter a trade and set stop-loss or take-profit levels.
How to Use the GOLDEN Trading System?
Identify the Bands: Look for the Green Band (H3-H4) and Red Band (L3-L4) on your chart.
Watch for Breakouts:
Enter a long position when the price closes decisively above the Green Band (H4).
Enter a short position when the price closes decisively below the Red Band (L4).
Manage Your Risk:
Use the opposite band (L3 or H3) as a stop-loss level to protect your trade.
Consider trailing your stop-loss as the trend progresses.
Add Confirmation: For greater accuracy, combine this strategy with other tools such as volume spikes, candlestick patterns, or higher timeframe trend analysis.
Case Study Example:
Take a closer look at the chart provided:
The price broke below the Red Band (L3-L4), confirming a bearish breakout.
Post-breakout, the price continued its downtrend, offering a high-reward opportunity for short-sellers.
By adhering to the system's clear breakout rules, you could have entered the trade early and capitalized on the trend with confidence.
Benefits of the GOLDEN Trading System:
Simplicity: Focuses on straightforward rules, making it beginner-friendly.
Consistency: Reduces emotional trading by adhering to defined breakout zones.
Scalability: Works across multiple timeframes and markets, including indices, stocks, and commodities.
Pro Tip for Advanced Traders:
Combine GTS with volume analysis, RSI divergence, or moving averages to add layers of confirmation to your trades. This helps filter out false breakouts and improves your win rate.
Join the GTS movement and elevate your trading game today! Share your feedback, results, and tweaks to make the strategy even better. Happy trading! 🚀

$1500 in Competition Profits: Strategizing the Sell PointWith $1500 in profit from a recent trading competition, it's time to evaluate the optimal exit strategy. I'll analyze potential sell points based on key resistance levels, current market trends, and any recent price action signals. Additionally, I'll consider both technical indicators and fundamental factors to identify an ideal spot for locking in gains. Follow along as I assess where to take profits and manage risk effectively.
Hashtags: #TradingStrategy #ProfitTaking #TechnicalAnalysis #RiskManagement #CryptoTrading #StockMarket #Forex #TradingCompetition #SellSignal #TradingView

NASDAQ: Push to 22K or Drop to 19K? Key Levels and Profit Zones Evening Traders
NASDAQ is hanging on to the 20,256 level, but if we break lower, we could be looking at a slide down to the 20,000-19,200 range. On the bright side, there’s a ton of support that could push us up to 21-22K. If that happens, it’s a great spot to take some profit before we hit major resistance—or worse, a deep correction.
Let’s dive into the key levels to watch and where to take action before things get bumpy. Will NASDAQ keep climbing, or are we in for a pullback?
If this gave you some insights (or at least made you think twice about your next move), give it a like, drop your thoughts in the comments, and hit follow for more updates. Your support keeps me going
Happy trading
Mindbloome Trader

Price Discount in USD/JPY - Trend ContinuationThe market is a discounting mechanism. When prices rise too high, buyers start taking profits, aiming to buy at lower prices during an uptrend. This behavior sustains the trend.
In USD/JPY, this concept is evident. The swing low at 160.26 attracted strong buyers, pushing the price above the previous high, creating a new higher high. At this peak, buyers no longer saw value and took profits, seeking a discount to buy at a lower price.
Fibonacci retracement is useful in trending markets, as its key ratios indicate potential levels of trader participation. Currently, the price has been discounted to the 76.4% retracement level of the rally. The corrective ABC pattern brought the price from the high to the current discount.
Based on this scenario, we expect more buyers at this higher low, pushing the price above the recent high. Using Fibonacci as a target tool, we anticipate the price reaching at least the 123.6% level of the current rally.
The risk in this trade is if the swing low of 160.26 is broken, buyers won't be profitable, so this level will be our stop loss. The risk/reward ratio for this trade is 7.05.
Always think in probabilities.

Has Apple run out of steam?As a market leader, NASDAQ:AAPL running out of steam should foretell what will happen with the markets as well. They seem tired.

NVDA: What to expect for earnings next week?This huge semiconductor has plenty of clout in terms of popularity with retail investors. HFTs are likely to gap on its earnings news which arrives on 11/21, next week.
Clearly there are many who are confident NASDAQ:NVDA will meet or beat analyst estimates despite setbacks and restrictions.
The run hit resistance and became overextended, so some profit taking is occurring for now. The stock is likely to shift to a tighter consolidation near the high of this platforming range.

$TSLA Down on Over-SpeculationNASDAQ:TSLA reported earnings after market close yesterday. Pro traders took profits before the close as the run became technically overextended. It gapped down today, but not on the extreme volume we'd expect from the usual HFT activity around earnings.
Profit and Operating margins are decreasing quarter over quarter, but revenues and net income are increasing.
This is not so much an onslaught of sellers but profit-taking along with a lack of buyers at this price range. As occurs often for this high-profile yet important EV company, the stock is over-speculated and needs to pattern out the excess. It could test the next support levels, but ultimately it's likely to head sideways as it challenges the resistance from Aug-Oct of last year...barring any surprises from Musk ;)
Dark Pool Buy Zones are in the bottom formation. The question is: will those buy zones be moved up or not?

Time to be cautious on Titan (neutral)We are close to all time high for titan share and a big resistance is out there. I would book profit here and wait for the trend confirmation.
Two big probabilities:
1. Open and close above resistance means long.
2. Open and close below resistance is good chance to short.

Apple easing back from its one-year downtrendI suspect that we are seeing some profit taking in this market ahead of its one-year downtrend. Near term uptrend supports are 165.00 and about 160 but the key support is going to be the 157.38/74 band - the October 2022 high and the February 2023 peak, also found here is the 23.6% retracement of the move higher seen this year.
Disclaimer:
The information posted on Trading View is for informative purposes and is not intended to constitute advice in any form, including but not limited to investment, accounting, tax, legal or regulatory advice. The information therefore has no regard to the specific investment objectives, financial situation or particular needs of any specific recipient. Opinions expressed are our current opinions as of the date appearing on Trading View only. All illustrations, forecasts or hypothetical data are for illustrative purposes only. The Society of Technical Analysts Ltd does not make representation that the information provided is appropriate for use in all jurisdictions or by all Investors or other potential Investors. Parties are therefore responsible for compliance with applicable local laws and regulations. The Society of Technical Analysts will not be held liable for any loss or damage resulting directly or indirectly from the use of any information on this site.

Gold Triple whammy of resistance likely to provoke profit takingIn the gold market, the 2022 high, Fibonacci extension, and top of a 12-year up channel at 2070-2100 are expected to act as strong resistance levels. This could lead to some profit-taking among traders.
The divergence of the daily RSI is already indicating a loss of upside momentum and I would recommend tightening up stop levels.
Disclaimer:
The information posted on Trading View is for informative purposes and is not intended to constitute advice in any form, including but not limited to investment, accounting, tax, legal or regulatory advice. The information therefore has no regard to the specific investment objectives, financial situation or particular needs of any specific recipient. Opinions expressed are our current opinions as of the date appearing on Trading View only. All illustrations, forecasts or hypothetical data are for illustrative purposes only. The Society of Technical Analysts Ltd does not make representation that the information provided is appropriate for use in all jurisdictions or by all Investors or other potential Investors. Parties are therefore responsible for compliance with applicable local laws and regulations. The Society of Technical Analysts will not be held liable for any loss or damage resulting directly or indirectly from the use of any information on this site.

Why I'm Betting Against Bitcoin: Signs Point to a Downturn
Bitcoin has been on a run in recent months. However, with the Ichimoku Cloud, we are seeing signs of potential resistance coming up in the near future. This suggests that a correction or even lower lows could be on the horizon for the popular cryptocurrency.
According to my analysis, Bitcoin has about HKEX:3 ,000 left of price to the upside before it reaches this resistance level. Once it hits this point, we could see a significant pullback in price as investors take profits and the market adjusts. While this doesn't necessarily mean the end of Bitcoin's long-term potential, it does suggest that investors should be cautious and consider taking some profits off the table to mitigate potential losses.

Gold: Anticipate temporary correctionA notable impulsive movement has been observed in the gold market, with the price surging from 1808 to 1831.
My technical analysis suggests that the price has entered a profit-taking zone, which could prompt buyers to offload some of their positions before resuming their purchases. Consequently, there is a possibility that the price could experience a temporary decline to the 1824-1820 range, or possibly lower, before the bullish trend continues.

Strategy Coding E05: Risk Managment (Part 2)Wrapping up from Part 1, I cover the example of taking 1/3rd profits and how that affects your risk in a potentially losing trade.

Strategy Coding E05: Risk Management (Part 1)This is a deep dive into the concepts surrounding "Risk Management" and how to realistically model managing risk.
We will discuss:
Risk Units
Scaling in to positions at a one third risk unit increments
Raising stops
Taking profits
Closing/exiting the position.

The Exit - How to take profitsToday’s content:
1. Why each exit is within 3 months?
2. Why I turn from investing to trading the US markets since Jan 2022 and onwards
If you have been following, today’s is the 6th tutorial in our Trading Series:
1. “The buy strategy”
2. “The sell strategy”
3. “Developing long & short-term view”
4. “Choosing between the time frame”
5. “The entry”
6. “The exit”
Refer to the links below or check the previous 5 videos.
E-Mini Nasdaq Futures
Minimum fluctuation
0.25 point = $5
1 point = $20
10 points = $200
100 points = $2,000
Disclaimer:
• What presented here is not a recommendation, please consult your licensed broker.
• Our mission is to create lateral thinking skills for every investor and trader, knowing when to take a calculated risk with market uncertainty and a bolder risk when opportunity arises.
CME Real-time Market Data help identify trading set-ups in real-time and express my market views. If you have futures in your trading portfolio, you can check out on CME Group data plans available that suit your trading needs www.tradingview.com

Allow for some near term Profit taking in EUR/USD Taking a look at the support and resistance levels on the EUR/USD chart
Disclaimer
The information posted on Trading View is for informative purposes and is not intended to constitute advice in any form, including but not limited to investment, accounting, tax, legal or regulatory advice. The information therefore has no regard to the specific investment objectives, financial situation or particular needs of any specific recipient. Opinions expressed are our current Disclaimer:
opinions as of the date appearing on Trading View only. All illustrations, forecasts or hypothetical data are for illustrative purposes only. The Society of Technical Analysts Ltd does not make representation that the information provided is appropriate for use in all jurisdictions or by all Investors or other potential Investors. Parties are therefore responsible for compliance with applicable local laws and regulations. The Society of Technical Analysts will not be held liable for any loss or damage resulting directly or indirectly from the use of any information on this site.

UPDATE: WING UP 600% after bullish signal 🚀WING pumped 600% after the bullish Supertrend Ninja - Clean signal (green vertical line on the background).
WING broke out of the bullish Zone of the Ichimoku Cloud , which is bullish . The RSI is in the overbought zone at 95. RSI Brown at 133. If we take a look at the Average Directional Index ( ADX DI) its starting to be bearish, as it is pointing downwards. Currently WING is way above its upper Bollinger Band, Band Basis 20 Period SMA . A retrace back within the Bollinger Band is more likely. The risk to reward right now to enter a trade is bad.
Waiting patiently on a bullish Supertrend Ninja signal, before entering a long paid off.
Thank you for reading.
Namasté 🙏
Disclaimer: Ideas are for entertainment purposes only. Not financial advice. Your own due diligence is highly advised before entering trades. Past performance is no guarantee of future returns.
What Indicators Do I Use:
In the chart I am using the "Supertrend Ninja - Clean", which is a trend-following indicator (Green and red vertical lines on the background). When the background of the candlestick closes green (vertical line). It indicates a possible bullish (up)trend. And red for downtrends.
