Projection


Bitcoin/US.DollarBeberapa area yang berkemungkinan menjadi landasan untuk kembali membuat bitcoin terbang


work study experiment - fib circle projection for bitcoinThese fibs were placed way ahead of price action using a method i'm calling fib projection. This is being posted so i can see how this chart plays out over time. I will be making a video down the road on how and why i created this chart and why i think this could be a potential a game changer for calling tops and bottoms way in advance.

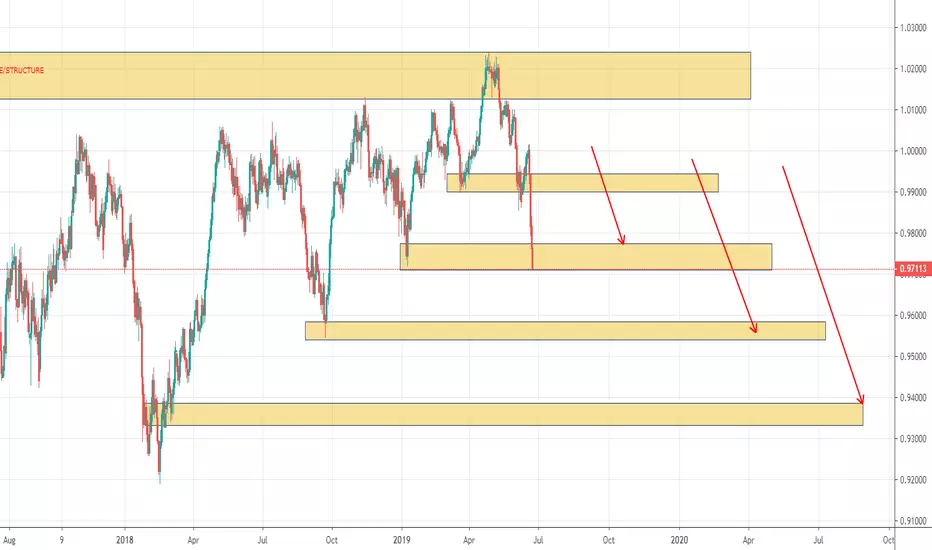
USDCHF SHORT PROJECTION (UPDATE) IF YOU LOOK AT USDCHF YOU CAN SEE THAT THE MOMENTUM HAS BEEN ON THE SELLER SIDE AND THIS PAIR HAS BEEN ON THE MOVE TO THE DOWNSIDE. I HAD MADE A POST LAST WEEK SHOWING THE SIGNIFICANT STRUCTURE LEVELS I THINK THIS PAIR COULD POTENTIALLY VISIT. IT HAS ALREADY HIT 2 OF THOSE LEVELS AND BASED ON MOMENTUM IS LOOKING LIKE IT STILL HAS A WAYS TO GO. KEEP AN EYE ON THIS PAIR AND HOPEFULLY YOU'RE CATCHING OPPORTUNITIES FOR SHORTS ON THE WAY DOWN AS LONG AS MOMENTUM PERMITS YOU TO DO SO. KEEP AN EYE OUT!
CHEERS!
LTC Halving's "sell the news sell-off" Window Approaching.Short!LTC short based on Christian Investment Analysis' (CIADC.co) Special Report: Cryptonomics
During LTC's first Cryptonomics cycle (halving) LTC rallied for 133 days from $1.12 to $8.12.
47 Days before its 1st halving Litecoin tanked 60% in one day from $8.12 to $3.00
Will Litecoin repeat its volatile behavior approaching its 2nd halving?
It may not be as drastic, but we think it will be profitable $$$ here at CIA...

Formations on IWM Leading To Imminent Downward CorrectionThe AMEX:IWM Russell 2000 cap-weighted ETF is showing signs of very imminent downward movement, backed by Elliott Wave Theory, Fibonacci Retracements, and its Relative Strength Index (RSI).
Elliott Wave Theory is a beautiful and fundamental tool for analyzing price action, though it can exhibit many inaccuracies when used to forecast future price movements. In order to determine, in real time, the pivot points at which the wave legs will see a reversal, other indicators and technical studies must be used in conjunction to quantify these price levels.
I have identified (in the past as well) this Elliott Wave Pattern, but too early in the pattern to quantitatively forecast corrective retracements. According to the pattern, we are currently in the fourth leg. To find the point at which price action will look to bounce and continue to finish the overall downward trend (before entering the ABC reversal), I looked at the reversal at point 2. Here, price action perfectly bounced off of the 50% support level and began to form the third leg. (See the point on the chart marked "Bounce off of 50%".) This proved the effectiveness of the cooperative conjunction between Fibonacci Retracements and Elliott Wave Theory.
Using this understanding, I placed the Fibonacci Retracement between points 2, 3, and 4 (what I'm calling 4). At this point (end of day on Monday 6/10/19) IWM is trading at $151.75. This price level is leaning towards a bounce off of the 61.8% level, or $152.05. The RSI on this hourly chart read >70, a sign of overbuying.
If the volatile market paves the way for a news-propelled daily price-action gap (presumably on the upside), we can also expect the fifth leg to form after a bounce off of the 78.5% level, or $153.83.
Summary:
Elliott Wave Theory alone cannot forecast precise price action, but when used in conjunction with Fibonacci Retracements, bounces can be quantitatively projected.
Based on this, we can expect the fifth and final downward leg of IWM to form as a bounce off of the 61.8% retracement level, or $152.05 .
If the daily gap patterns persist (Tuesday opens as a gap up), likely on the upside, price action will presumably find itself combatting with the 78.6% resistance level, or $153.83, before continuing the overall retracement to become the fifth leg of the Elliot Wave pattern.
Especially on these higher time-frames, such broad ETFs are very closely correlated. The ETFs I have in mind are: AMEX:SPY (S&P 500), NASDAQ:QQQ (Nasdaq), and AMEX:IWM (Russell 2000). This means that if the IWM pattern proves correct and is followed, very similar movement will almost certainly occur in these other assets and across asset classes.
Rough and volatile market times: keep your eyes open! Please like, follow, and share.

Prices return to above 21 EMAPrices are targeting the area around 24.11 to regain a foothold above the 21 EMA.


Bitcoin BTCUSD ForecastI could see something like this play out.
Moving averages are the 50 week and 200 week but put on the daily chart (350 bars and 1400 bars)
Daily Chart Coinbase:
Weekly Chart Coinbase:
Bitstamp Weekly Log Chart:
Bitstamp Daily Log Chart:
Let me know your thoughts below!
What is your prediction?


