GOLD could move UP!Hey tradomaniacs,
looks like XAU/USD could continue its way upwards after the previous fakeout to the downside.
LEAVE A LIKE AND A COMMENT - I appreciate every support! =)
Peace and good trades
Irasor
Wanna see more? Don`t forget to follow me.
Any questions? PM me. :-)
Pullbacktrade

AMAZON - BLUE TRENDING LINE NICE LONG ENTRY POINT - AMZN - 30MNAMZN price is following an uptrend at the moment. The blue line being the support of this history happening at the moment.
The gape will be probably filled before observing another push up, the blue line have shown in the past that when the market comes to it, it pullback in other direction. The blue line is probability, therefore, an amazingly interesting entry point for a long direction trade.
Levels, potential and hypothetical are market with respectively straight lines (Red/Green) and dotted lines (Green/Black).
This give you some to work on to prepare your own charts for next week.

LIVE SQUEEZING OUT BUYERS - PULLBACK IMMINENT - ES1! - 30MNThe S&P500 Mini is pushing up and the red top line is showing the expected probable maximum reach before retreat.
The top red line could be a possible great short entry point.
Beware of high volatility and keep an eye always on the US Treasury Bond patterns to validate your entry on the S&P500.

Pullback Day Trade OpportunityBuying on a pullback to retest the hourly ascending trendline in confluence to our 0.618 fib retracement and a previous level of S&R.

NZD/JPY pullback trade NZDJPY is pulling back up towards previous resistance and also the 50MA, this will more than likely push down further. Trade Supported by a downwards sloping moving average.

Potential Retracement SetupExpecting a pullback to retest the respectable ascending trendline and the back of the broken descending trendline in confluence with our 0.618 fib retracement and strong support area of the hourly structure.

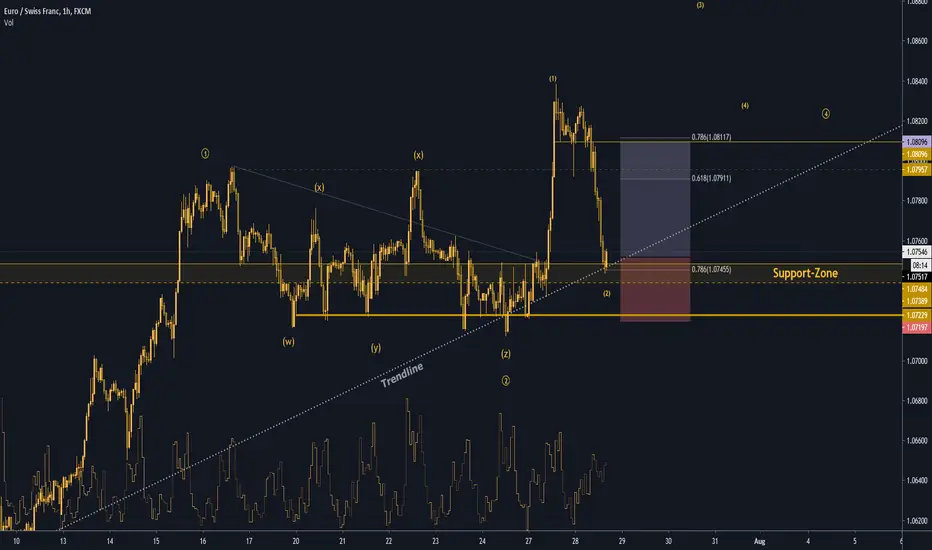
EUR/CHF BUY SIGNAL Hey tradomaniacs,
welcome to a new free trading-setup.
NOTICE: This is meant to be a preparation for you. As always we need to wait for a confirmation!
Market-Buy: 1,07530
Stop-Loss: 1,07195
Take-Profit: 1,08095
Stop-Loss: 33,5 pips
Risk: 0,5 % - 1%
Risk-Reward: 1,81
LEAVE A LIKE AND A COMMENT - I appreciate every support! =)
Peace and good trades
Irasor
Wanna see more? Don`t forget to follow me.
Any questions? PM me. :-)
Golden Pocket Short Setup on PullbackLooking to enter shorts on a pullback to retest the broken ascending trendline and the currently descending trendline in confluence to our 0.618-0.65 fib retracement area, ultimately creating a golden pocket to open our positions from. Furthermore, there is a strong historical S&R zone which can act as a rejection spot for the price.

Intra-day Long & Swing Short SetupIntra-day:
Looking for a pullback to retest the recently broken hourly trendline in confluence to our 0.618 fib retracement and a strong hourly support area.
Swing:
Assuming the intra-day setup plays out in accordance to the plan, a strong short setup is formed on the respectable descending trendline in confluence to the outer 0.618 fib retracement and previous S&R area.

Potential Retracement SetupLooking to enter longs on a pullback to retest the broken descending trendline in confluence to our 0.618 fib retracement and minor support area.

AUD/NZD Pullback to trend line and previous support. Possible Buying opportunity on the AUD/NZD, trend pulling back to previous support. this is supported by an upwards sloping moving average and bullish engulfer on the 1hr chart.

Daily Pullback | Short SetupGBPJPY approaching daily descending trendline in confluence to the 0.618 fib retracement and a potential rejection is possible.

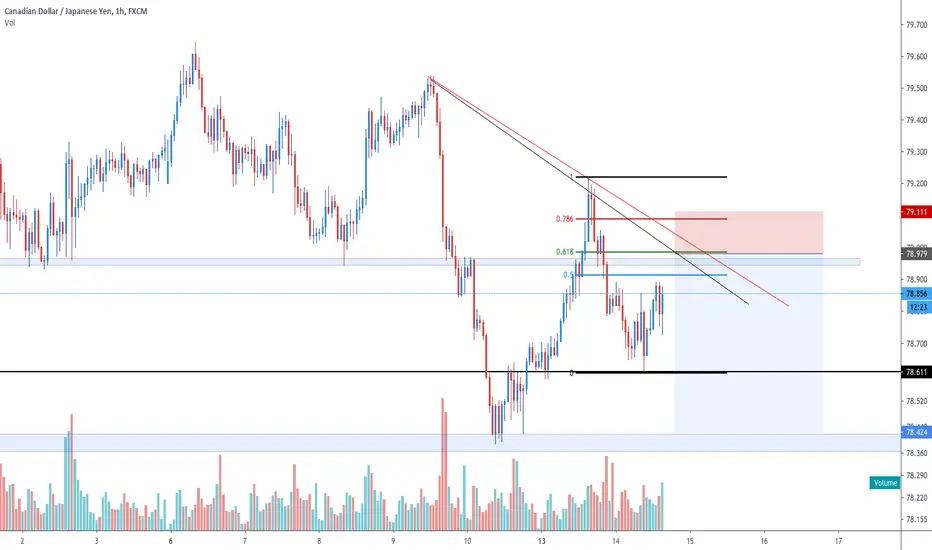
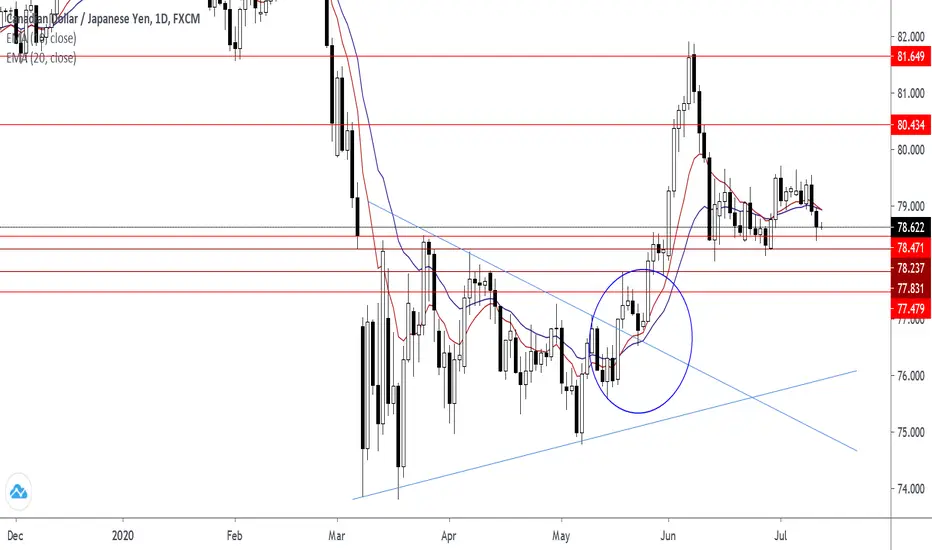
Pullback to Retest Trendline | Daily Short SetupCADJPY slowly approaching to retest the descending daily trendline, which ultimately can experience a rejection from it. Looking to open shorts near the 0.618 fib retracement and previous level of S&R.

Pullback to Retest TrendlinePotential long setups on a pullback retesting the respectable ascending trendline in confluence to the 0.618 fib retracement and previous resistance which is now acting as support.

Trendline Retest | Long SetupLooking for a pullback to retest the respectable ascending trendline. Opening shorts near the 0.618 fib retracement in confluence to the previous level of resistance which is now acting as support.

USD JPY Gameplay for today As you can state,
We can judge and tell easily that the market respect with grace the trend lines,
So you can wait and enter in the reversal patterns and watch out your trade,
In other word wait for the touch by the red line and confirm your buy trade by the volume that will confirm the reversal strategy

Trend Analysis: ROKU - Elliot Wave and C&H PatternNot an expert at EWT , but it's relatively easy to see a wave 4 correction of larger wave 3. I'm targeting a pullback here before earnings to the horizontal white line (which was previous resistance before the recent breakout) and then continuation of wave 5 of 3 to about $210 (2.618 x total length of wave 1 (which is about 80 ($140-$60)). Furthermore, I see the wave 4 correction allowing for a potential handle of a cup n handle pattern. Which takes the chart ultimately to about $260 before the next consolidation phase.

USD JPY FORECAST FOR NEXT WEEKDear all,
I hope that you will react with this idea which was based on the price action supported the most important trend lines to forecast correctly what will gonna happen on Monday,
I think that the market will go up with a huge probability

EUR/NZD SELL SIGNAL Hey tradomaniacs,
welcome to a new free trading-setup.
NOTICE: THis is meant to be a preparation for you. As always we need to wait for a confirmation!
Market-Sell: 1,73875
Stop-Loss: 1,74480
Take Profit: 1,72810
Stop-Loss: 60 Pips
Risk: 1%
Risk-Reward: 1,8
LEAVE A LIKE AND A COMMENT - I appreciate every support! =)
Peace and good trades
Irasor
Wanna see more? Don`t forget to follow me.
Any questions? PM me. :-)

USDCAD | Long on PullbackLooking to open longs on a pullback towards the respectable ascending trendline in confluence to the 0.618 fib retracement and previous area of support.

CADJPY Short on PullbackLooking to sell CADJPY on a pullback to retest the descending trendline in confluence to our 0.618 fib retracement and strong level of previous support now acting as resistance.
Pullback Trade Strategy: Pullbacks To Dynamic Support ResistancePullback Trading Strategy: Pullbacks To Exponential Moving Averages
INDICATORS POINTING DOWN - RANGING - MARKET CHANGE - TVIXF 240MNThank you for your lies and shares, Much appreciated!
__________________________________________________________
The market needed to be looked up with another eye. After the decision of the Credit Suisse company to take down some shares.
Did we notice any change ? No!
Market TVIXF changing in market shape, passing from a descending trend to a ranging lower trend. Is it the results of the company's decision? No!
For the analysis, we can clearly notice that there is a strong resistance illustrated with a green horizontal line, which as been tested several times before. Possibility of an entry short from that point again to be on the wave of a probable pullback down on it.
Furthermore, the lower part of the actual overall horizontal trend marked with the orange line, can probably see the market trying to break it, to evolve at a lower price.
Another idea would be an entry long from that point(bottom orange line)
At the moment, because the market hasn't shown any strong sign of recovery, we would wait and see what is going the happen from next week.
So Wait Few Days to Increase Your Probability Limiting the Risks.
----------------------------------------------------------------------------------------------------------------------------------------
We see more and more people happy taking positions and decisions through our analysis.That's great!
Please beware about this DISCLAIMER: this trading idea and all others published here or on any social network, editorial, media and press, can change at anytime without any notice. Trading is risky and losses or profits are the results of your own decisions and not the result of this analysis. Trading assets on financial markets is very risky and this analysis is to provide another point of view.
T
