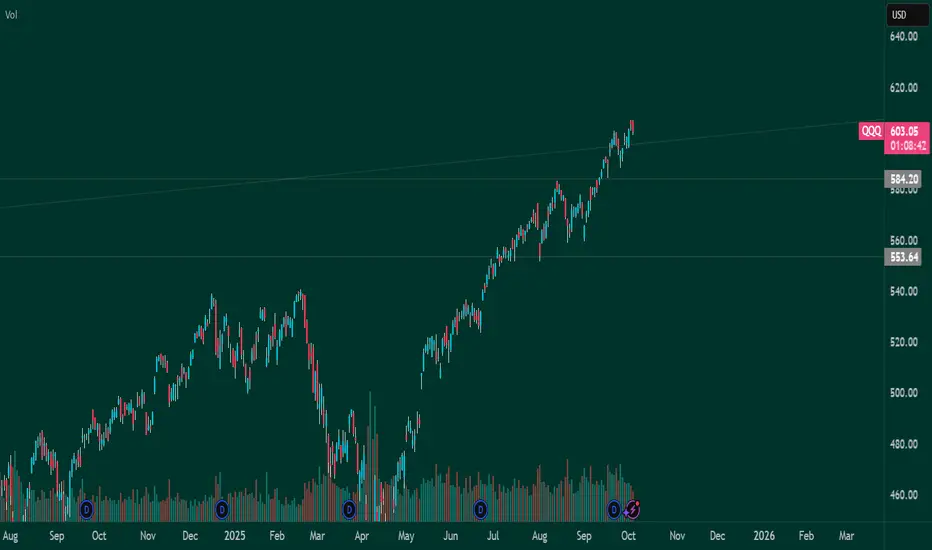
QQQ: Growth & Bullish Continuation
It is essential that we apply multitimeframe technical analysis and there is no better example of why that is the case than the current QQQ chart which, if analyzed properly, clearly points in the upward direction.
Disclosure: I am part of Trade Nation's Influencer program and receive a monthly fee for using their TradingView charts in my analysis.
❤️ Please, support our work with like & comment! ❤️
QQQ
QQQ Resistance - Big pullback or breakout comingAs you can see from the trend lines, we are about to touch resistance. The last two times this happened we got a sizable pullback. During COVID, it was a breakout. QQQ just keeps pushing higher on the AI trade as the bubble just continues to grow. The AI trade is still strong. Right now companies are making massive "deals" (okay, promises) and stocks just keep exploding. It will be interesting to see how this plays out in the next few weeks.

Why traders are losing money? Position Size PurposeWhy traders are losing money
Most traders do not lose because the market is hostile or because entries are bad. They lose because the size of each position is out of sync with account size, with volatility, and with a realistic pain threshold. They also stack correlated exposure until a normal downswing becomes a career ending drawdown. The fix is a repeatable sizing process that keeps losses small, keeps risk per trade constant across regimes, and caps total open risk across the book.
Root causes of loss clustering
Risk per trade that is too large for the real account balance that is available for trading
Stops that ignore volatility so a quiet week and a fast week carry the same unit count while loss size swings wildly
Portfolio heat that compounds across correlated positions in the same theme or factor
Inconsistent exits so a written stop is moved or ignored after the position is open
Scaling rules that add size before the trade earns the right to carry more risk
A review loop that tracks money rather than R so results are not comparable across instruments
One principle to anchor the lesson
Risk lives in the distance between entry and stop. Size lives in how much money you are willing to risk on that distance. Everything else is detail. When you fix these two elements the account stops bleeding from one mistake and the equity curve starts to respect your personal pain limits.
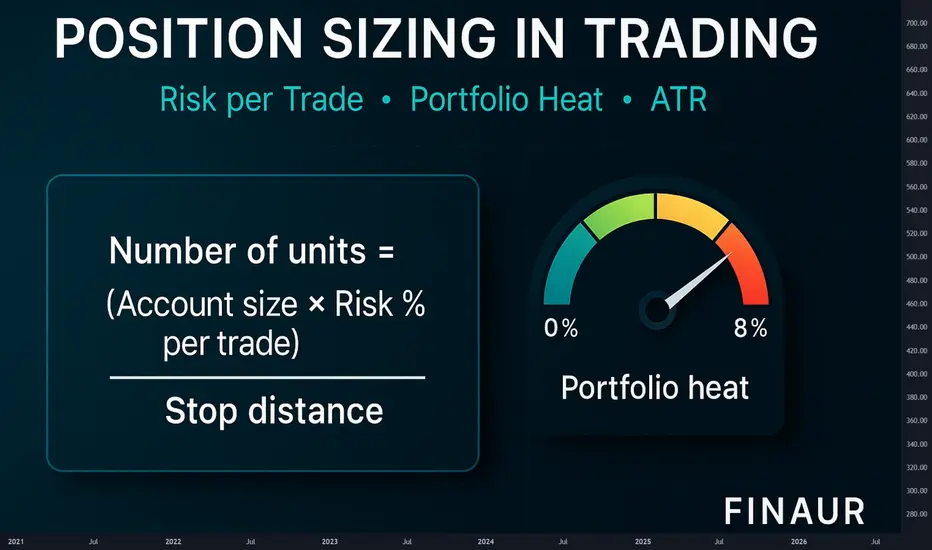
The unit formula in plain words
Units equals Account times Risk percent divided by Stop distance
Stop distance equals Entry minus Stop in price units
For futures or forex convert the distance to money with tick or pip value before you divide
Round the result to the venue step size
Percent risk formula and worked example
Set a realistic risk percent
Pick a range between zero point two five and one point zero percent of account per trade
If you are new stay closer to zero point two five
If you are experienced and you follow rules under pressure stay near zero point five to one point zero
Use only capital that is truly available for trading
Define the stop with intent
You can define a stop by price structure or by volatility. Structure is a level that invalidates the setup. Volatility is a multiple of the average true range. Both work if you keep the rule stable. The aim is not to predict a perfect level. The aim is to measure distance so you can compute size with precision and keep loss per trade constant in money terms.
Volatility aware sizing
When the average true range doubles you must expect larger swings. If you keep the same unit count the same entry to stop distance will cost twice as much. A simple way to neutralise this effect is to tie the stop to a multiple of the average true range and then let the unit count float. When volatility rises the unit count shrinks. When volatility calms the unit count grows. Risk per trade stays constant.
Practice example
Risk money equals one hundred
Stop distance equals three point zero in a calm regime
Units equals one hundred divided by three which is thirty three units rounded
If volatility doubles and the stop distance becomes six point zero the new unit count becomes sixteen units rounded
Loss per trade stays near one hundred in both regimes
Portfolio heat in clear numbers
Portfolio heat is the sum of risk money across all open trades as a percent of account. If you allow the sum to balloon during correlated trends you are betting the entire account on one theme. A simple cap keeps you in business.
Set a heat cap between four and eight percent of account
Count correlated positions as one theme for heat
If a new trade would push heat above the cap you must reduce size or defer the trade
Keep a cash buffer for slippage and gap risk
Heat includes correlated risk. Keep combined open risk under your limit
R multiple as the common unit
R is the unit that equals your risk per trade. If you risk one hundred then one R is one hundred. A two R gain is two hundred. A one R loss is one hundred. Because R normalises money across instruments and timeframes you can compare strategies without confusion. When you review your trades in R the mind stops obsessing about price and starts focusing on process.
Expectancy in words and numbers
Expectancy is the average R result per trade. It depends on win rate and payoff ratio. You do not need equations to grasp it. You can compute it with simple mental math.
Practice example A
Win rate equals forty five percent
Average win equals two point two R
Average loss equals one point zero R
For every ten trades wins contribute nine point nine R and losses subtract five point five R
Expectancy equals four point four R per ten trades or zero point four four R per trade before fees
Practice example B
Win rate equals thirty five percent
Average win equals three point zero R
Average loss equals one point zero R
For every ten trades wins contribute ten point five R and losses subtract six point five R
Expectancy equals four point zero R per ten trades or zero point four R per trade before fees
The shape of expectancy changes when volatility changes. If you keep risk per trade constant and let the unit count respond to stop distance expectancy measured in R will be more stable across regimes. That stability translates into better position control and calmer decision making.
Why money management fails in practice
Traders set a risk percent but do not compute units from entry and stop before the order
They move the stop after position entry and invalidate the size calculation
They add to losers because the entry feels almost right and average down risk with no plan
They never reduce size after a loss streak so the book enters a feedback loop where a normal downswing becomes a spiral
They treat wins as proof of skill and losses as anomalies rather than counting both in R and accepting variance
A position sizing workflow you can follow every time
Write the setup and the trigger in one line
Define the stop with a structure rule or with a multiple of the average true range
Measure the stop distance in price units
Select the risk percent that fits your current equity and your mental state
Convert the stop distance to money if the instrument uses ticks or pips
Compute units as Account times Risk percent divided by Stop distance
Round to the venue step size and check that the notional fits practical constraints
Place the order only after the number of units is in the ticket and the stop is written
Scaling with intent
Scaling is not a trick to force a trade to work. Scaling is a way to stage risk through time. The rule is simple. Add size only after the trade earns the right to carry more risk. Reduce risk when momentum fades or when volatility rises.
One simple scale plan
Enter half size when volatility is rising or when the theme is crowded
Add the second half only after the trade moves one R in your favour
Move the stop to reduce open risk when the second half is added
Do not exceed the heat cap across the book after the add
Compute size. Check heat. Execute only if rules align
Comparator versus buy and hold
Buy and hold does not respect a personal pain limit. It lets drawdown float with price. A sized trade fixes the maximum loss in money terms at the start. The difference is not ideology. The difference is the choice to survive.
Practice scenario
Price falls ten percent after entry in a fast regime
A buy and hold position shows a ten percent account drawdown if one position equals the entire account
A sized trade with one percent risk shows a one percent account drawdown by design
The sized trade can take many attempts because capital is preserved for the next signal
Kelly fraction and optimal f cautions
Kelly and optimal f are powerful in theory. They aim to maximise growth for a known edge. Real trading edges drift and sample sizes are small. Full Kelly creates deep drawdowns and can trigger a behavioural spiral. If you decide to use these methods treat the fraction as a ceiling rather than a target and remain near half Kelly or less. Always measure drawdown in R and reduce size after a loss streak.
Loss streak protocol
Loss streaks are part of variance. A simple protocol keeps them from damaging your decision cycle.
After four consecutive losses reduce risk per trade by half
Freeze adds and focus on clean entries only
Review the last ten trades in R and tag any rule violations
Return to the base risk percent only after a new equity high or after a full week of clean execution
Heat management across themes
The book is a living system. A theme can be a sector a factor a style or a macro driver. If four positions express the same theme treat them as one for heat. The market does not care that the tickers differ. Correlation in stress is the rule. The heat cap is your defence against that correlation.
Fees and slippage discipline
Small edges die from friction. If your average win is near one R and your average loss is near one R you must protect that edge by keeping fees and slippage small. Choose venues with adequate liquidity. Avoid market orders during news bursts. Use limit orders to control entry and exit where practical. Assume a realistic round trip fee in your backtests so that live results match expectations.
Journaling that actually helps
Your journal should capture rules and numbers rather than emotions alone. Use a compact template.
Setup name and trigger
Entry price and stop price
Risk money and unit count
Reason for the stop placement
Exit reason and realized R
Any deviation from the plan
Practice drills to build fluency
Speed matters during live markets. These drills train your sizing reflexes.
Drill one. Percent risk to units
Account equals twenty thousand
Risk equals one percent which is two hundred
Stop distance equals zero point eight
Units equals two hundred divided by zero point eight which is two hundred fifty units
Drill two. Volatility step change
Risk equals one hundred fifty
Stop at two average true range equals three point two which gives forty six units rounded
If the average true range rises by fifty percent the stop becomes four point eight and units become thirty one rounded
Loss per trade remains near one hundred fifty
Drill three. Futures or forex conversion
Risk equals three hundred
Stop equals twenty ticks
Tick value equals twelve point five
Stop distance in money equals two hundred fifty
Contracts equals three hundred divided by two hundred fifty which is one contract with a small buffer for slippage
Drill four. Heat check
Four open trades at one percent risk each looks like four percent heat
If three of them are the same theme treat them as one for heat
Effective heat is closer to three percent and a new trade in that theme should be deferred
Checklist before every order
Is the setup valid according to the written rule
Is the stop defined by structure or by a multiple of the average true range
Have you measured the stop distance correctly
Is the risk percent chosen and written on the ticket
Are units computed from Account times Risk percent divided by Stop distance
Does the book stay under the heat cap after this order
Are you in a loss streak that requires reduced size
Common myths to retire
Myth. Bigger size proves conviction. Reality. Bigger size proves you have abandoned process
Myth. A tight stop is always better. Reality. A stop that ignores volatility will be hit by noise
Myth. Averaging down improves price. Reality. Averaging down expands risk without proof that the idea is valid
Myth. A few big winners will save the month. Reality. A few big losers can end the year
How to adapt across timeframes
The rules above are timeframe agnostic. Shorter timeframes require tighter execution and more attention to fees. Longer timeframes require more patience and a wider cash buffer for gaps. In both cases the math does not change. You measure distance. You set risk money. You compute units. You respect the heat cap. You review in R.
Edge drift and regime change
Edges do not vanish overnight. They drift when the crowd learns the pattern or when macro drivers shift. Your sizing process makes you resilient to drift. Because risk per trade is fixed a flat or negative edge bleeds slowly and gives you time to notice and step back. If you see expectancy in R slide over a thirty or fifty trade sample reduce size and review the rule set before you push the gas again.
Putting it all together
A trader who sizes by feel can enjoy a series of quick gains and then give it back in one week. A trader who sizes by rule can be wrong half the time and still grow steadily. The difference is not superior prediction. The difference is the choice to define loss before entry to respect volatility and to cap heat so a cluster of normal losers does not become a personal crisis.
A compact template you can copy
Setup name and timeframe
Entry trigger in one sentence
Stop rule. Structure or two average true range or another clearly written rule
Account and risk percent
Stop distance in price units and in money
Units computed and rounded to step size
Heat check across the book and across the theme
Planned targets in R and exit rules
Bottom line
Risk per trade must be small and stable
Stops must respect volatility
Portfolio heat must remain inside a hard cap
Review results in R and adjust size after loss streaks
Let the unit count float with volatility so risk money per trade remains constant
Education
Education and analytics only. Not investment advice. Test every rule with historical data before risking capital. The lesson below is theory with practice drills you can apply to any liquid instrument and any timeframe.
TSLA BULLISH OCT 9 2025There is a lot of bullish momentum in Tesla at current price. Price action is always superior .
If you dont understand a trade then dont enter in it trusting me or any stranger as this is your hard earned money. Missing a trade is not the end of the world.
Its a trade so,
STOP LOSS means Stop my loss
Trade:
Entry- curren price
SL-$416 close
Target-$460 min

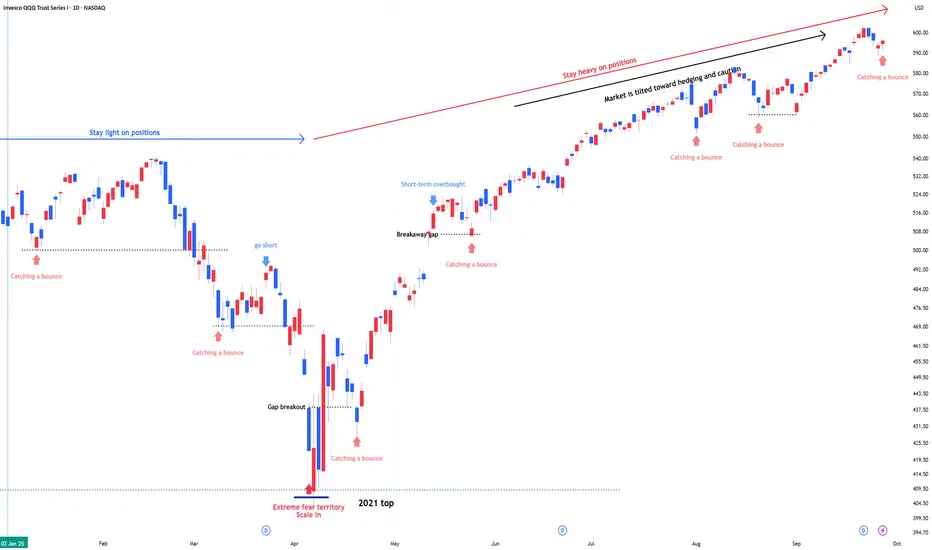
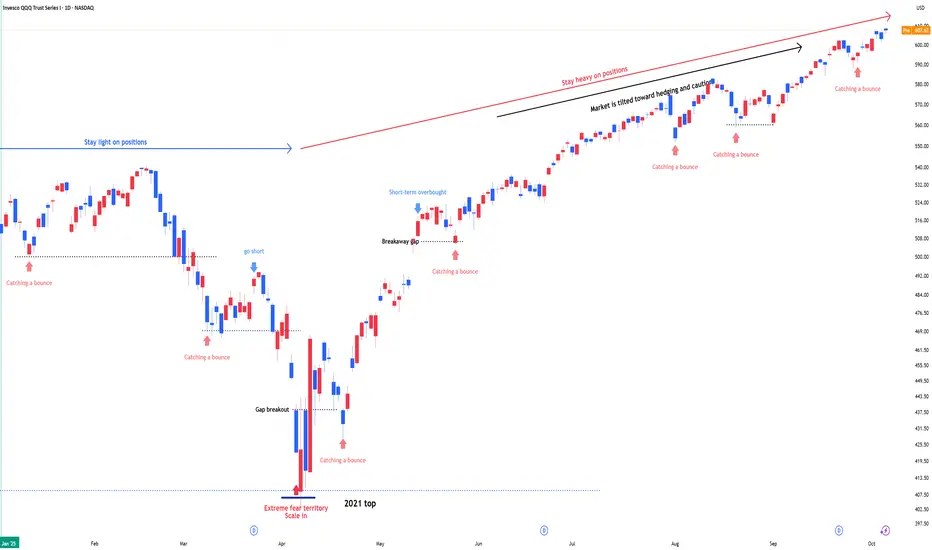
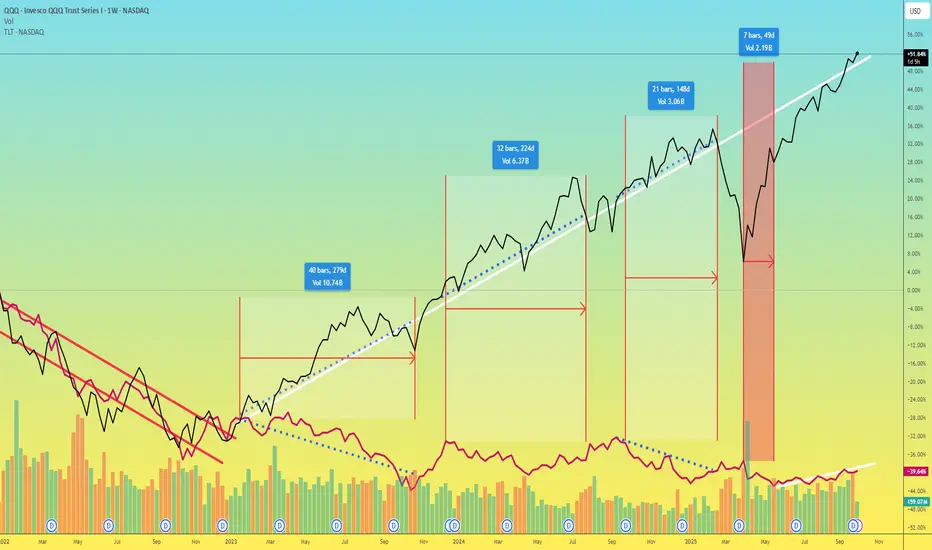
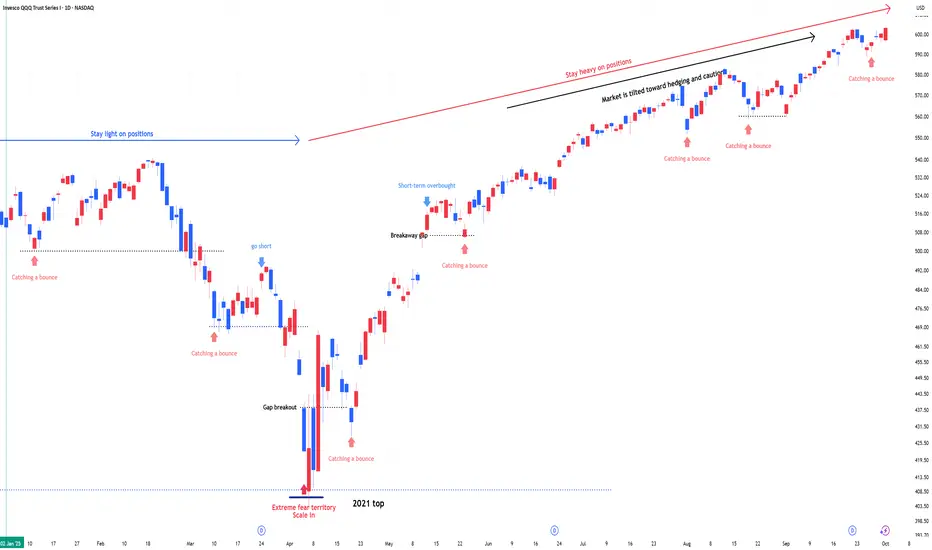
QQQ : Stay heavy on positionsQQQ : Stay heavy on positions (QLD, TQQQ)
Entering a risk-on, high-volatility zone.
In stay light on positions zones, I hold QQQ and reduce exposure.
In stay heavy on positions zones, I increase allocation using a mix of QLD and TQQQ.
** This analysis is based solely on the quantification of crowd psychology.
It does not incorporate price action, trading volume, or macroeconomic indicators.
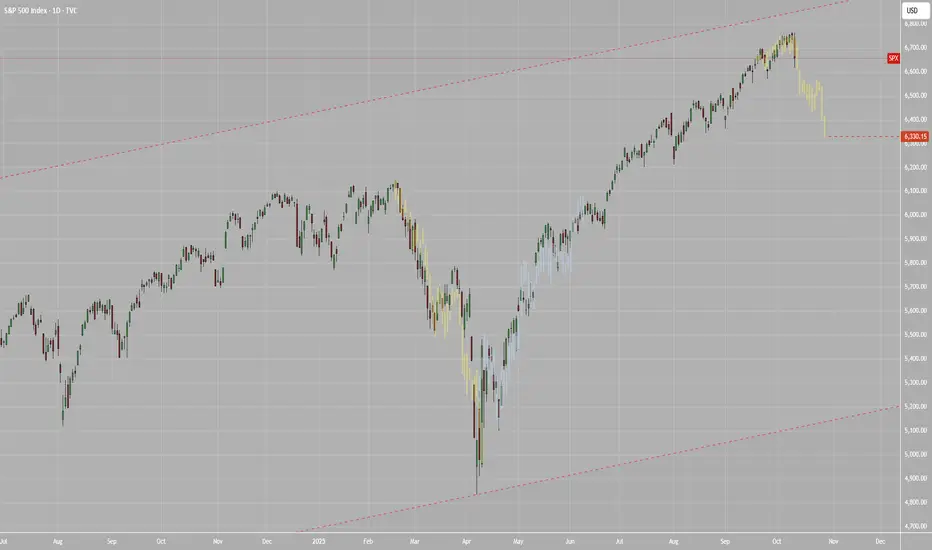
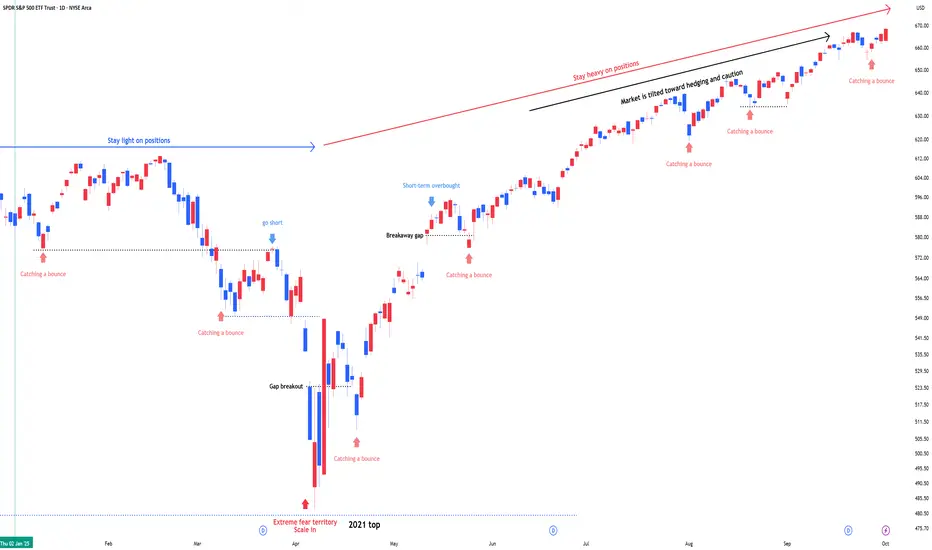
SPY : Stay heavy on positionsSPY : Stay heavy on positions (2x leverage)
Entering a risk-on, high-volatility zone.
In stay light on positions zones, I hold SPY(+QQQ) and reduce exposure.
In stay heavy on positions zones, I increase allocation using a mix of SSO(+QLD) and TQQQ.
** This analysis is based solely on the quantification of crowd psychology.
It does not incorporate price action, trading volume, or macroeconomic indicators.

Applovin Craters...Is Robinhood next? APP fell sharply intraday today after announcement came late into the session about an SEC probe into the company.
The SEC loves to do this with new S&P500 stocks.
Applovin was one of the strongest stocks in the market recently and its finally been knocked back down to earth.
You have to wonder if HOOD will be the next SEC probe.
Robinhoods controversial NFL prediction markets could a big controversy.

AMD Best Level to BUY/HOLD 300% gains SWING TRADE🔸Hello traders, today let's review recent price chart for AMD.
Well defined swings in progress, expecting further downside before
the tide finally turns for AMD bulls. Currently it's recommended to stay out.
🔸AMD is trailing behind NVDA massively, so eventually AMD will to the
mean reversion trade and start to catch up with NVDA, however currently
pullback/correction mode in progress.
🔸Well defined swings - 160 to 58 65% correction, then 58 to 210 280% gains,
210 to 75 represents 65% correction, 75 to 290 is a 280% pump.
🔸Recommended strategy bulls: Bulls wait for correction to complete at/near 75 usd in January 2025 and get ready to BUY/HOLD low, this is a swing trade setup, so will take longer to hit target, patience required. final TP is 290 USD, 280% upside off the expected lows. good luck traders!
🎁Please hit the like button and
🎁Leave a comment to support our team!
RISK DISCLAIMER:
Trading Futures , Forex, CFDs and Stocks involves a risk of loss.
Please consider carefully if such trading is appropriate for you.
Past performance is not indicative of future results.
Always limit your leverage and use tight stop loss.

Will AMD recover and catch up with NVDA? updated/Revised Outlook🔸Hello traders, today let's review 2days/candle price chart for AMD.
Price contained within bullish channel since 2021, however currently
pullback/correction in progress.
🔸65% correction in progress, based on previous swings expected to complete at/near 88/90 USD in Q1 2025. Until then it's recommended to stay out.
🔸Once we bottom out near 90 USD in Q1 2025, expecting bullish swing 265% gains off the lows, so projected high is 310/320 USD.
🔸Recommended strategy bulls: Bulls wait for correction to complete at/near 85 usd in Q1 2025 and get ready to BUY/HOLD. Bullish impulse / reversal off the lows price target based on measured move projection is 310/320 USD. patience required, do not expect miracle/overnight gains in this market. good luck!
🎁Please hit the like button and
🎁Leave a comment to support our team!
RISK DISCLAIMER:
Trading Futures , Forex, CFDs and Stocks involves a risk of loss.
Please consider carefully if such trading is appropriate for you.
Past performance is not indicative of future results.
Always limit your leverage and use tight stop loss.

TESLA PRICE ACTION 5th OCTOBER 2025Price action for Tesla is here. I have clearly explained my plan on how to trade tesla considering every factor in market.
NOTE: OPTION WILL BURN YOUR CAPITAL

$NDX $SPX $BTC All Close at Weekly ATHPretty cool to see ₿itcoin, S&P 500 and Nasdaq all close the week at new ATH 🥳
And now we have $325B about to be dumped into the US economy in FY26Q1 along with more rate cuts on the way.
Next time you speak to a bear, reply with FU HIGHER 🚀

Stock Market Forecast | TSLA NVDA AAPL AMZN META MSFTStock Market Forecast | CME_MINI:NQ1! SP:SPX NASDAQ:NDX CME_MINI:ES1!
Mag 7 | TSLA NVDA AAPL AMZN META MSFT GOOGL

NASDAQ 100 Technical Analysis & ForecastNASDAQ 100 (NAS100) Technical Analysis & Forecast
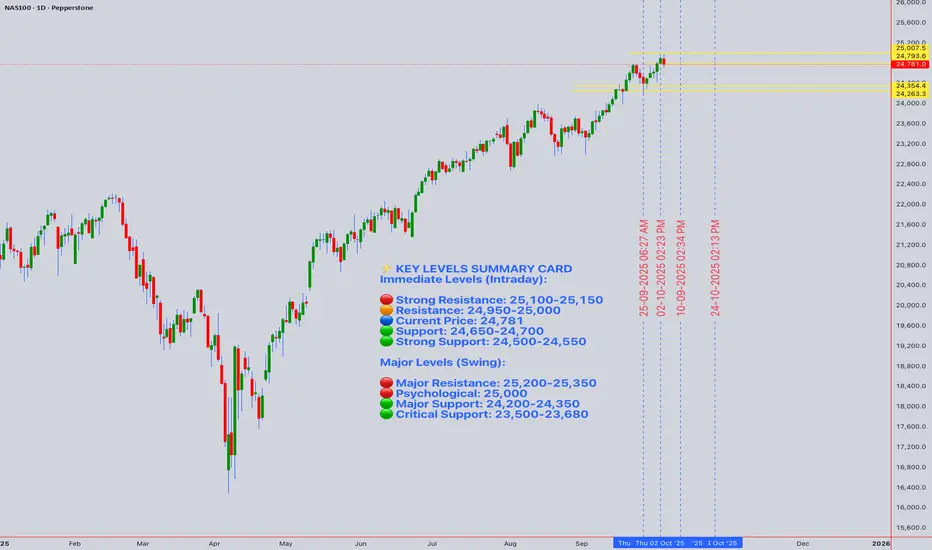
Current Price: 24,781.00 | Date: October 4, 2025, 12:54 AM UTC+4
📊 EXECUTIVE SUMMARY
The NASDAQ 100 is currently trading at 24,781.00, showing resilience near all-time highs. This comprehensive analysis integrates multiple technical frameworks to provide actionable insights for both intraday and swing traders navigating the tech-heavy index.
Key Takeaway: NAS100 exhibits a cautious bullish bias with critical support at 24,650 and resistance at 25,100. Traders should monitor for potential consolidation before the next directional move.
🔍 MULTI-TIMEFRAME TECHNICAL ANALYSIS
Monthly & Weekly Outlook (Swing Trading Perspective)
Long-term Trend Assessment:
Primary Trend: Bullish structure remains intact with higher highs and higher lows established since Q4 2024
Elliott Wave Count: The index appears to be in Wave 5 of a larger impulse structure from the 2022 lows, suggesting a mature bull cycle
Ichimoku Cloud (Weekly): Price trading above the cloud with Tenkan-sen (9-period) above Kijun-sen (26-period), confirming bullish momentum
Key Weekly Levels:
Major Resistance: 25,200 - 25,350 (psychological level and prior consolidation zone)
Major Support: 24,200 - 24,350 (former resistance turned support, 20-week EMA)
Critical Support: 23,500 (50-week EMA, must hold for bull trend continuation)
Gann Analysis:
Square of 9 calculation from recent lows suggests the next significant price target at 25,088 (45° angle)
Time cycle analysis indicates potential volatility window October 8-12, 2025
Price-time squaring suggests equilibrium at current levels, with break expected by mid-October
Daily Chart Analysis (Swing & Position Trading)
Trend & Momentum:
50-day SMA: 24,420 (acting as dynamic support)
200-day SMA: 23,680 (long-term trend anchor)
RSI (14): Currently at 64, showing bullish momentum without overbought conditions
MACD: Positive histogram with signal line above zero, indicating upward momentum
Chart Patterns Identified:
Ascending Triangle Formation: Consolidation between 24,650 support and 25,100 resistance suggests a bullish continuation pattern
Wyckoff Analysis: Signs of re-accumulation phase (Trading Range) after the spring rally, indicating smart money positioning
Harmonic Patterns:
Potential Bullish Bat pattern completing near 24,650, with PRZ (Potential Reversal Zone) offering strong support
Fibonacci retracement from recent swing shows 61.8% level at 24,580, aligning with multiple support factors
Volume Profile:
VWAP (Anchored from Sept 1): 24,695 - price maintaining above VWAP indicates institutional buying
Volume Analysis: Above-average volume on up days suggests strong bullish participation
High Volume Node (HVN): 24,750-24,800 represents fair value area
4-Hour Chart (Transitional Timeframe)
Technical Indicators:
Bollinger Bands: Price trading in upper band (24,950), suggesting near-term overbought conditions but strong trend
RSI (14): 68 - approaching overbought but no bearish divergence yet
Stochastic Oscillator: %K at 82, %D at 76 - overbought territory, watch for crossover
Ichimoku System:
Price above cloud (bullish)
Lagging span above price (confirming bullish sentiment)
Cloud ahead is thin, suggesting potential resistance at 25,050-25,100
Support & Resistance:
Immediate Resistance: 24,950 → 25,100 (psychological and technical confluence)
Immediate Support: 24,650 → 24,500 (previous consolidation and EMA cluster)
1-Hour Chart (Intraday Swing Reference)
Short-term Momentum:
20 EMA: 24,745
50 EMA: 24,680
100 EMA: 24,620
Price trading above all key EMAs indicates short-term bullish control
Candlestick Patterns:
Recent formation of bullish engulfing patterns on hourly suggests buying pressure
No immediate reversal patterns detected
Warning Signs:
Potential Bear Trap: If price briefly breaks below 24,650 with low volume, expect quick recovery (trap for shorts)
Bull Trap Risk: Break above 25,100 without volume confirmation could reverse quickly
📈 INTRADAY TRADING STRATEGY (Week of October 4-11, 2025)
15-Minute & 30-Minute Chart Focus
Monday-Tuesday Bias: Consolidation expected between 24,650-24,950
Long Entry Strategies:
Setup 1: Support Bounce Play
Entry Zone: 24,650-24,700
Stop Loss: 24,580 (below harmonic PRZ)
Target 1: 24,850 (Risk:Reward 1:2)
Target 2: 24,950 (Risk:Reward 1:3.5)
Confirmation: RSI (15-min) oversold below 30, bullish candlestick reversal pattern
Setup 2: Breakout Play
Entry: Break and retest of 24,950 with volume
Stop Loss: 24,870
Target 1: 25,050
Target 2: 25,150 (ascending triangle measured move)
Confirmation: Volume 20% above average, 15-min candle close above 24,950
Setup 3: VWAP Reversion
Entry: Price touches VWAP (currently ~24,695) from above on 5-min chart
Stop Loss: 24,650
Target: 24,800-24,850
Confirmation: Volume spike on touch, bullish divergence on 5-min RSI
Short Entry Strategies:
Setup 1: Resistance Rejection
Entry Zone: 25,050-25,100
Stop Loss: 25,150
Target 1: 24,850
Target 2: 24,700
Confirmation: Bearish engulfing or shooting star on 15-min chart, RSI divergence
Setup 2: Failed Breakout (Bull Trap)
Entry: Price breaks 25,100 but closes back below within 2 candles (15-min)
Stop Loss: 25,130
Target: 24,800
Confirmation: High volume on breakout but no follow-through
🎯 SWING TRADING STRATEGY (October-November 2025)
Bullish Scenario (60% Probability)
Primary Strategy: Ascending Triangle Breakout
Entry Plan:
Aggressive Entry: Current levels (24,780) with tight risk management
Conservative Entry: Pullback to 24,500-24,650 support zone
Breakout Entry: Confirmed break above 25,100 with volume
Position Sizing:
Risk 1-2% of capital per trade
Scale in: 50% at first entry, 30% on confirmation, 20% on continuation
Price Targets:
Target 1: 25,350 (measured move from triangle)
Target 2: 25,800 (Fibonacci extension 1.618)
Target 3: 26,200 (psychological and Gann Square of 9 target)
Stop Loss Management:
Initial Stop: Below 24,500
Trail Stop: Move to breakeven once Target 1 is reached
Final Stop: Trail with 4-hour 20 EMA
Time Horizon: 3-6 weeks
Bearish Scenario (40% Probability)
Invalidation Triggers:
Break below 24,500 on daily close
Head and Shoulders pattern develops (left shoulder at 25,200, head forming now, right shoulder anticipated)
MACD bearish crossover on daily chart
Short Strategy (Swing):
Entry Conditions:
Daily close below 24,500
RSI breaks below 50 on daily
Death cross forming (50 SMA crossing below 200 SMA - currently not present)
Targets:
Target 1: 24,200 (weekly support)
Target 2: 23,850 (50-day SMA)
Target 3: 23,500 (major support and 50-week EMA)
Stop Loss: Above 24,800
📉 RISK FACTORS & MARKET CONTEXT
Technical Risk Factors:
Overextension: Weekly RSI approaching 70 suggests limited upside without consolidation
Volume Divergence: If breakout occurs with declining volume, suspect false move
Elliott Wave: If in Wave 5, expect exhaustion and correction before new highs
External Market Considerations:
Macroeconomic Factors to Monitor:
Federal Reserve policy statements (October FOMC meeting expectations)
Q3 2025 earnings season for mega-cap tech (starting mid-October)
Geopolitical tensions and their impact on risk sentiment
US Dollar strength affecting multinational tech companies
Sector-Specific Catalysts:
AI technology developments and adoption rates
Semiconductor supply chain updates
Regulatory environment for big tech
Interest rate trajectory impacts on growth stocks
🛡️ RISK MANAGEMENT RULES
For All Trading Timeframes:
Position Sizing: Never risk more than 2% of capital on single trade
Stop Loss: Mandatory on every trade, no exceptions
Take Profits: Scale out at predetermined levels (50% at T1, 30% at T2, 20% at T3)
Maximum Daily Loss: Stop trading if down 4% in single day
Correlation Risk: NAS100 correlates with QQQ, SPX, and major tech stocks - monitor for divergences
Trading Journal Requirements:
Document all entries with screenshots
Record reasoning and technical setup
Track hit rate and average risk:reward
Weekly performance review and strategy adjustment
📅 WEEKLY INTRADAY ROADMAP
Monday, October 7:
Bias: Neutral to slightly bullish
Key Level: 24,750 (Friday's close area)
Strategy: Wait for direction after Asian/European session
Action: If holds above 24,700, look for longs on 15-min pullbacks
Tuesday, October 8:
Bias: Testing resistance at 24,950
Gann Time Cycle: Potential volatility day
Strategy: Breakout or rejection trades
Action: High-probability setups at extremes
Wednesday, October 9:
Bias: Continuation or reversal confirmation day
Strategy: Follow Tuesday's direction with momentum
Action: Trail stops on profitable positions
Thursday, October 10:
Bias: Mid-week profit-taking possible
Strategy: Mean reversion trades if overextended
Action: Watch for VWAP reversion setups
Friday, October 11:
Bias: Week-end positioning, reduced size
Strategy: Close most intraday positions before weekend
Action: Only high-conviction swing trades held over weekend
🎓 INDICATOR CONFLUENCE SUMMARY
Bullish Signals (Current):
✅ Price above 50-day, 100-day, and 200-day SMAs
✅ Ichimoku cloud bullish on daily and weekly
✅ MACD positive on multiple timeframes
✅ Volume profile shows accumulation
✅ Ascending triangle continuation pattern
✅ Gann angles supporting upward trajectory
Bearish Warnings:
⚠️ RSI approaching overbought on 4-hour
⚠️ Potential Elliott Wave 5 exhaustion
⚠️ Bollinger Bands showing overextension
⚠️ Stochastic overbought on shorter timeframes
Neutral/Watch:
🔍 Volume needs to increase on breakout attempts
🔍 Wyckoff accumulation phase requires confirmation
🔍 Head and Shoulders pattern could develop if resistance holds
🎯 FINAL TRADING RECOMMENDATIONS
For Intraday Traders:
Focus on the 24,650-25,100 range for the next week. Best opportunities exist at range extremes with clear risk management. Favor long setups given the broader bullish context, but remain nimble and respect stop losses.
Best Intraday Timeframes: 5-min for entries, 15-min for trend confirmation, 1-hour for bias
For Swing Traders:
The ascending triangle offers an excellent risk:reward setup. Consider building positions on pullbacks to 24,500-24,650 with stops below 24,450. Target the 25,350-25,800 zone over the next 4-6 weeks. Monitor daily candle closes for trend confirmation.
Best Swing Timeframes: Daily for entries, 4-hour for momentum, weekly for trend validation
⚡ KEY LEVELS SUMMARY CARD
Immediate Levels (Intraday):
🔴 Strong Resistance: 25,100-25,150
🟠 Resistance: 24,950-25,000
🔵 Current Price: 24,781
🟢 Support: 24,650-24,700
🟢 Strong Support: 24,500-24,550
Major Levels (Swing):
🔴 Major Resistance: 25,200-25,350
🔴 Psychological: 25,000
🟢 Major Support: 24,200-24,350
🟢 Critical Support: 23,500-23,680
📝 DISCLAIMER
This analysis is for educational and informational purposes only. Trading financial instruments carries substantial risk and may not be suitable for all investors. Past performance does not guarantee future results. Always conduct your own research and consult with licensed financial advisors before making trading decisions. The author is not responsible for any trading losses incurred based on this analysis.
Next Update: October 11, 2025
Analysis Valid Through: October 18, 2025
Prepared using advanced technical analysis incorporating Wyckoff, Elliott Wave, Gann, Harmonic Patterns, Ichimoku, and modern momentum indicators.RetryClaude can make mistakes. Please double-check responses.
Small Correction 5-10% ?Looks like we will have a small correction hopefully not more than 10%. It could be a good time to buy the dip in nvda, orcl, crwd etc.
Happy trading !!
Not a financial advice.
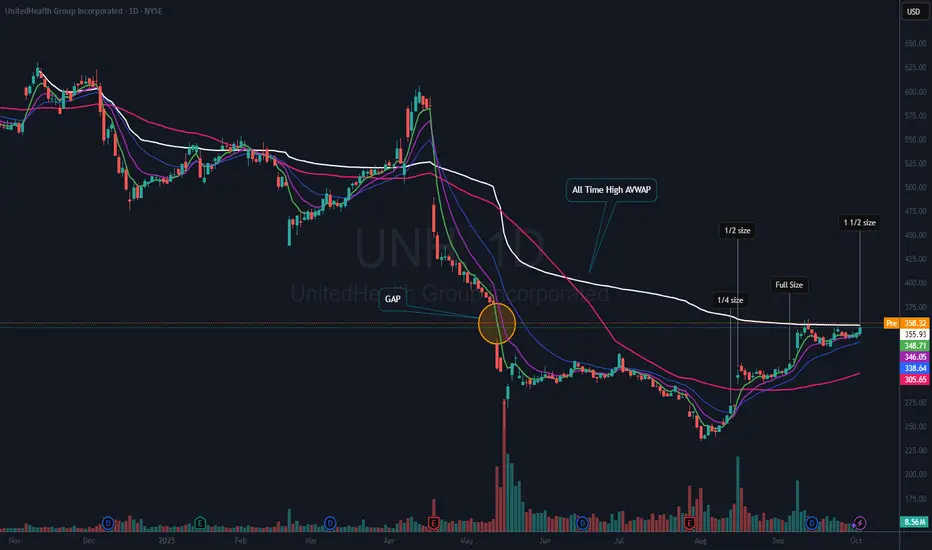
$UNH Testing All-Time High AVWAPNYSE:UNH is currently testing its All-Time High Anchored Volume Weighted Average Price (ATH AVWAP), while simultaneously forming what appears to be a flat base. In pre-market trading today, the stock price has moved above the AVWAP, potentially indicating reduced overhead resistance and the possibility for continued upward momentum.
Position and Strategy
I initiated a position in NYSE:UNH on August 13th and have steadily increased my holdings up to and including yesterday. As the stock approaches a critical juncture, there is potential for it to continue rallying, especially with earnings scheduled to be announced in 25 days.
Analyst Ratings and Price Targets
The consensus among analysts is generally positive for NYSE:UNH , with 16 rating it as a buy or strong buy, 7 assigning a hold rating, and 3 recommending a sell. The highest 12-month price target currently stands at $440.
Future Plans
If NYSE:UNH can move above the $362 level, I plan to further increase my already oversized position, as this would present a compelling opportunity to at least fill the gap.
QQQ : Stay heavy on positionsQQQ : Stay heavy on positions (QLD, TQQQ)
Entering a risk-on, high-volatility zone.
In stay light on positions zones, I hold QQQ and reduce exposure.
In stay heavy on positions zones, I increase allocation using a mix of QLD and TQQQ.
** This analysis is based solely on the quantification of crowd psychology.
It does not incorporate price action, trading volume, or macroeconomic indicators.
SPY : Stay heavy on positionsSPY : Stay heavy on positions (2x leverage)
Entering a risk-on, high-volatility zone.
In stay light on positions zones, I hold SPY(+QQQ) and reduce exposure.
In stay heavy on positions zones, I increase allocation using a mix of SSO(+QLD) and TQQQ.
** This analysis is based solely on the quantification of crowd psychology.
It does not incorporate price action, trading volume, or macroeconomic indicators.
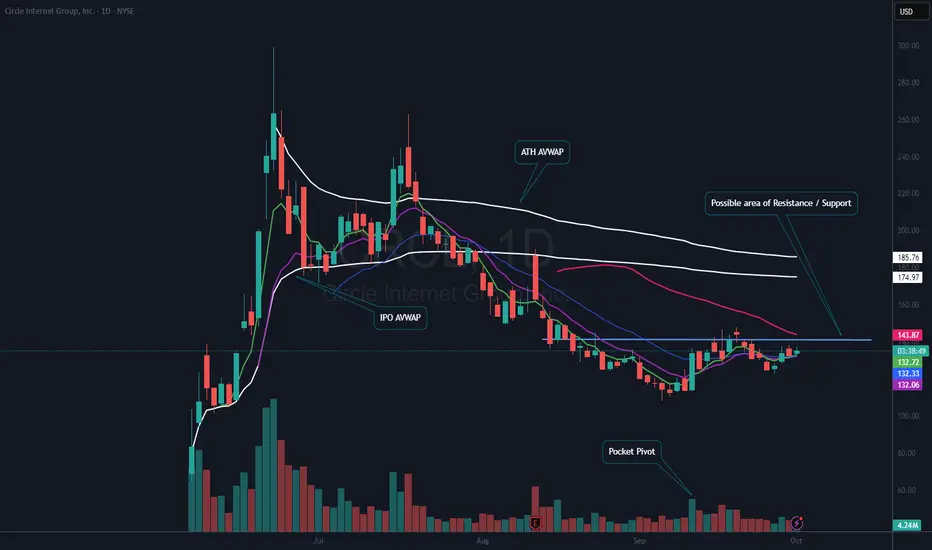
$CRCL IPO AnalysisOverview of NYSE:CRCL
NYSE:CRCL is a recent initial public offering (IPO) within the digital currency and blockchain payment industry. The company presents itself as the “World’s Largest Regulated” stablecoin provider in the global financial sector.
Trade Entry and Rationale
On September 11th, I initiated a position in NYSE:CRCL for $128. The entry was prompted by a notable pocket pivot and the stock’s ability to reclaim the 21-day exponential moving average (EMA), indicated in green on my charts. To manage risk, I set a stop loss just below the low of the entry day, which has not been triggered. Since entering the trade, the position has appreciated by just over 7%.
Current Position and Strategy
I am closely monitoring an identified area of resistance, where I have set an alert. If the stock can surpass this resistance level, I intend to add to my existing position.
Risks and Technical Considerations
Despite positive short-term movement, this remains a risky trade. While NYSE:CRCL is trading above all its shorter-term moving averages, it remains below the 50-day moving average (DMA), shown in red. Additionally, the stock is trading below both the IPO Anchored Volume Weighted Average Price (AVWAP) and the All-Time-High AVWAP. These technical levels may represent points where selling pressure could emerge, which is important to consider if you were to initiate a position.
Conclusion
Given its current setup, NYSE:CRCL may be a candidate for your watchlist.
SPY trend Broken? Use this Long / Short StrategyLast week was a choppy sell off in the markets.
We did see the bulls defend price later into the week by bouncing the main indices very nicely.
We discuss the simple support / resistance where you should be watching.
Using the daily 7MA as resistance can be shorted however if we recapture and close above, then the markets remain a long to new highs.
The trend of higher lows is still in tact signaling bullish strength... can we search for a new higher high?

Are We About To See A HUGE Change In The Market...Stock Market Forecast | QQQ SPY CME_MINI:NQ1! CME_MINI:ES1! SP:SPX NASDAQ:NDX
Mag 7 | TSLA NVDA AAPL AMZN META MSFT GOOGL

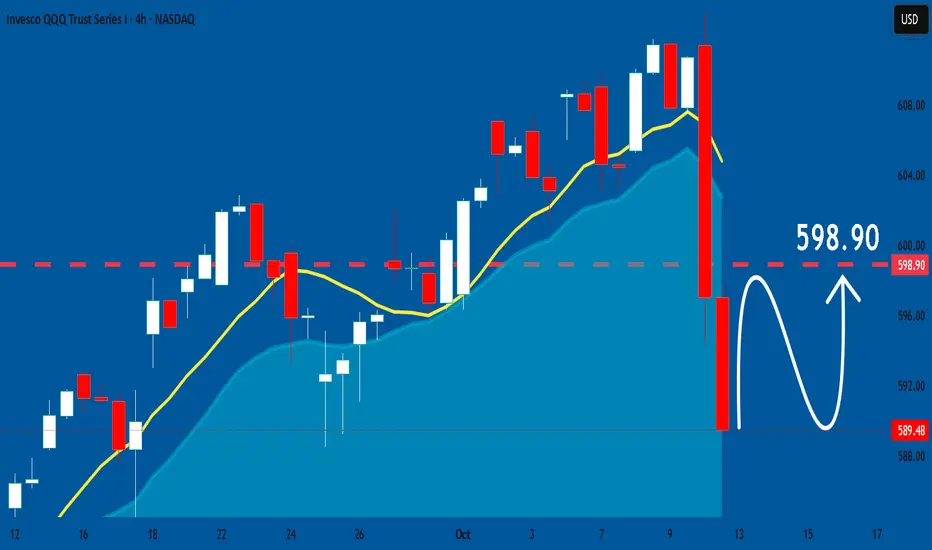
QQQ : Stay heavy on positionsQQQ : Stay heavy on positions (QLD, TQQQ)
Entering a risk-on, high-volatility zone.
A signal for catching a bounce has emerged.
In stay light on positions zones, I hold QQQ and reduce exposure.
In stay heavy on positions zones, I increase allocation using a mix of QLD and TQQQ.
** This analysis is based solely on the quantification of crowd psychology.
It does not incorporate price action, trading volume, or macroeconomic indicators.