Long Idea on Natural Gas (NG1!)Based on :
- Quantitative analysis
- Propietary temperature shock european model
- Vp and Avwap
Quantitativeanalysis

Short Idea on Crude Oil (CL1!)Based on :
- avwap and vp levels
- Bond yield spikes
- quantitative analysis
- 2 supply zones for potential entries

Short Idea On US30 (Dow Jones)Based on :
-quantitative analysis
- vp and avwap levels
- correlations misprice model
- IV deviation bands models

Long Idea On Canola (RS1!)Based on :
- Cot commercial extremes
- Volume profile,avwap and 2 demand zones

EUR/USD: Sellers Defending Value — Breakdown or Continuation HigEUR/USD is showing clear seller presence after a strong rejection at the HVN, confirming that this area remains a key supply zone.
However, price is still holding above the dynamic support, suggesting that the next move will be decided by whether this level breaks or attracts fresh buyers.
📊 What the chart is telling us:
HVN rejection → sellers active at value
A break below the support area could trigger strong momentum toward 1.1540
👉 What’s your take — support breakdown and continuation lower, or buyers step in for another push higher?
Based on:
- Fundamental analysis
- HVN & Volume Profile levels
- Quantitative analysis

Nasdaq : 24,000 Holds Strong — Next Stop 25,800?Price action on the Nasdaq 100 is telling a clear story: 24,000 (AVWAP + HVN confluence + Round number) is acting like a magnet for institutional buyers.
This suggests that accumulation is happening at these levels, positioning for a potential run toward 25,800 if momentum holds.
Are we front-running a breakout, or should we wait for confirmation above 25,000 first?

USDCAD: Buyers Defend Support — Recovery Ahead?USDCAD is reacting firmly inside a high-value support pocket, where the channel baseline, prior demand, and heavy volume clustering align — a classic area where sentiment often shifts.
Despite the market already pricing in December Fed rate cuts, short-term price behavior on this pair remains resilient. The latest bounce suggests that buyers are stepping back in, keeping my near-term outlook tilted to the upside, with room for a rotation toward the 1.4080 zone if momentum continues to build. However, if price breaks below the current support zone, USDCAD could slide even further, opening the door to a deeper corrective leg.
The real question now is:
Are we witnessing the beginning of a genuine recovery leg, or just a temporary relief move before direction resets?
Based on :
- fundamental analysis
- volume and quantitative analysis

Re-entry Long idea on ETHUSDBased on :
-quantitative analysis
-Volume analysis
-Option flow analysis

MSFT: The “Top Pick” Trap? Or Real Breakout Fuel?Microsoft is testing a critical support zone — and with Morgan Stanley just naming it a top pick in tech, buyers may be gearing up for control. 📈
Quantitative stats back the setup: Sortino Ratio of 0.42 and 90% win rate on this pattern.
👉 What’s your call — breakout to new highs… or one more dip before the rally?

ETH/USD – Bulls Ready for the Next Leg Up?Ethereum is showing a clean retrace into the rising trendline and POC/ VWAP zone — classic setup for a continuation move.
As long as price holds above $3,950, bulls remain in control with targets at $4,733 and beyond.
Momentum is cooling but structure stays bullish. Is this just the calm before the next breakout? 👀
💬 What’s your plan here — riding the trend or waiting for confirmation?

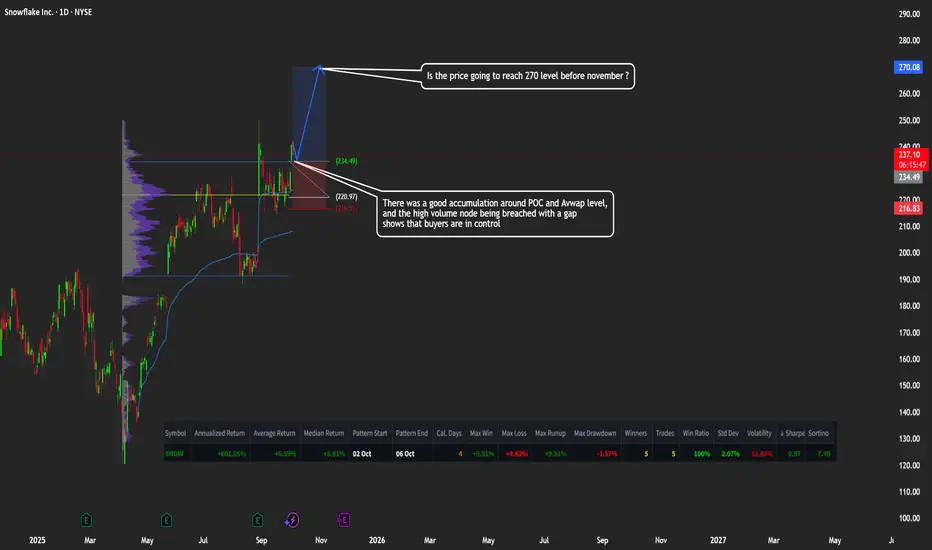
SNOW: Snowflake Headed to $270?🚀 Snowflake Ready for Takeoff? $270 Before November?
Caption:
SNOW has shown strong accumulation around the POC and VWAP levels, with buyers taking control after breaking through the high-volume node with a gap. 📈
Momentum could push the price toward $270 in the coming weeks.
👉 What do you think — is $270 realistic, or will we see a pullback first?
SOFI: Buyers in Control? Heading Toward $31?SOFI is showing strength as AVWAP and HVN hold as key support — a clear sign that buyers are in control. 📊
If momentum continues, we could see a push toward the $31 target zone in the coming weeks.
👉 What’s your take — breakout incoming or another retest of support first?
Based on :
- Fundamental analysis
- Avwap and HVN levels
- Quantitative analysis

Gold at $4,000: A Major Milestone — or the Start of a Pullback?Gold just hit the $4,000 mark — a massive psychological level after one of the strongest rallies in years 🚀
Fueled by Middle East conflicts, the metal’s performance has been insane: +278% from the 2015 low and +130% from the 2022 correction low.
Now, with a ceasefire announcement in play, institutions might start taking profits. Could this be the pivot point before a short-term bearish move?
What do you think — will gold keep climbing to new highs, or is it time for a correction?
Drop your thoughts below 👇

EUR/JPY: Could This Demand Zone Spark the Next Bullish Move ?Price is testing a high-volume node at 173.450, where:
The AVWAP is acting as dynamic support
The Volume Profile shows strong accumulation
According to pattern analysis (based on historical data), similar setups delivered:
→ 8 wins out of 10 trades (80% win rate)
Not a guarantee — just a signal worth watching.
This is not financial advice. Past performance ≠ future results.


From Mystery to Mastery: Trading EssentialsIntroduction: Why Trading Feels Like a Mystery
For many aspiring traders, the markets appear as a mysterious puzzle. Prices move in ways that often feel unpredictable, charts are filled with patterns that seem random, and every strategy seems to work until it suddenly doesn’t. This is why trading so often feels like a mystery: it blends human behavior, technical structures, and ever-changing fundamentals into one living system.
Yet behind this apparent chaos lies a logic. The transition from “mystery” to “mastery” begins with understanding that trading is not about luck, but about process. Just like a scientist doesn’t guess but instead forms hypotheses, tests them, and adapts based on evidence, traders must approach the markets with discipline and structure.
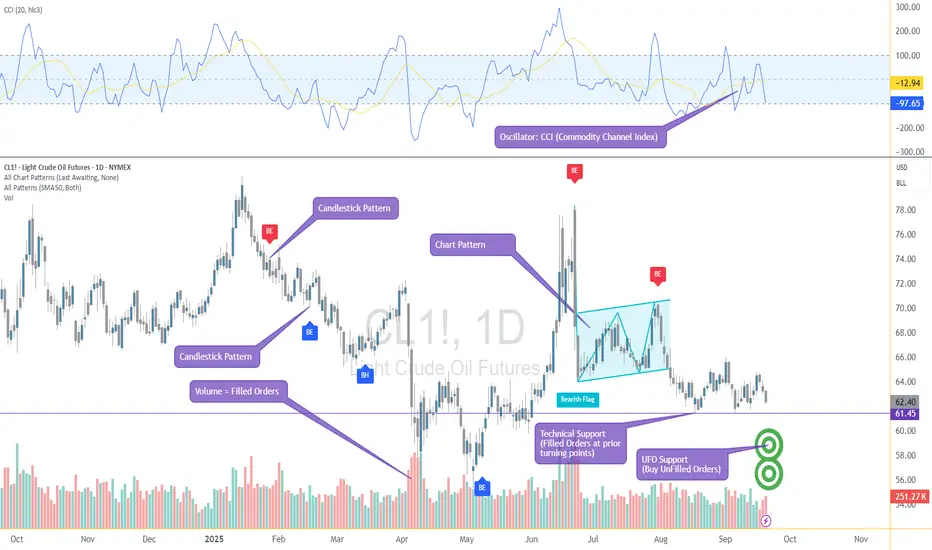
The main chart attached to this article is a good reminder of this. At first glance, it looks overwhelming: candlestick patterns, oscillators, UFO support and resistance zones, chart patterns, and volume data all layered together. But this is not noise — it’s information. Each element highlights a different aspect of market behavior. Once organized and understood, these tools stop being mysterious and instead form the building blocks of trading mastery.
In this guide, we’ll walk step by step through those building blocks: how markets are structured, how trades are placed, how risk is managed, how strategies are built, and how psychology influences decisions. Along the way, you’ll see how these concepts work together to transform confusion into clarity.
Trading mastery doesn’t come overnight, but the journey begins the moment you stop chasing secrets and start building a foundation.
Understanding Market Types
Not all markets are created equal. Before diving into strategies and chart patterns, it’s important to recognize that different markets operate under different structures. Knowing where you are trading — and how those markets function — can be the difference between confidence and confusion.
Exchange-Traded Markets
In exchange-traded markets such as futures or stocks, trading takes place on centralized venues. This means:
Prices are transparent, with all participants seeing the same quotes.
Orders are matched through a regulated system, reducing counterparty risk.
Clearing houses guarantee performance, ensuring that when one side of a trade wins, the other side’s obligations are met.
This structure creates confidence, especially for leveraged instruments like futures, where position sizes can be large.
Over-the-Counter (OTC) Markets
On the other side, forex, crypto and many other derivatives are traded over-the-counter. Here, there is no central exchange — trades are made directly between counterparties, such as banks or brokers.
Prices can vary slightly between providers.
Liquidity depends on the institution offering quotes.
Most importantly, there is counterparty risk — the risk that the other side may not honor the trade.
While OTC markets can be deep and liquid, traders must understand the role of intermediaries and the risk they take on when choosing where and how to trade.
Why It Matters
The choice between exchange-traded and OTC instruments affects everything: order execution, spreads, transparency, and even regulation. Many professional traders favor exchange-traded products for their transparency and reliability, but OTC instruments remain popular due to accessibility and flexibility.
Whether you’re trading futures on the CME or currency pairs in the OTC forex market, the principle is the same: know your marketplace, because the rules of engagement define the playing field.
The Mechanics of Trading
Once you know where you’re trading, the next step is to understand how trades are actually placed. This is where many traders feel overwhelmed, because order types, execution rules, and volume data can feel like a different language. But when broken down, the mechanics are straightforward.
Order Types: The Building Blocks
Market Orders: Execute immediately at the best available price. Fast, but can suffer from slippage in fast-moving markets.
Limit Orders: Specify the maximum price you’re willing to pay (buy) or the minimum price you’ll accept (sell). Excellent for controlling entry, but no guarantee of execution.
Stop Orders: Triggered once price hits a certain level, commonly used for stop-losses.
Bracket Orders: Automating Discipline
One of the most practical tools for managing trades is the bracket order. Instead of placing just an entry, a bracket order automatically places:
A stop-loss order to protect against adverse moves.
A profit-taking order to lock in gains.
This setup creates a “bracket” around your trade, ensuring that risk and reward are defined from the start. It shifts the trader’s mindset from hoping to managing.
Volume: The Footprint of Filled Orders
Volume is more than a number at the bottom of a chart — it’s the record of filled orders. When volume surges at a level, it shows where buyers and sellers agreed most aggressively. Combined with support/resistance or UFO zones, volume can help traders identify which levels have strong institutional participation.
Execution Matters
Bid-ask spreads, commissions, and slippage all impact profitability. A great strategy can still fail if execution costs aren’t managed. This is why many traders choose more liquid products — deeper liquidity usually means tighter spreads and better fills.
By mastering these mechanics — order types, brackets, and the interpretation of volume — traders gain the ability to structure trades with precision instead of improvisation.
Core Principles of Risk Management
If there’s one constant across all successful traders, it’s this: they never risk their capital blindly. Strategies may differ, but the principles of risk management remain universal.
Risk per Trade
A common practice is to limit the risk of any single trade to a small percentage of account equity — often 1–2%. This way, even a series of losing trades doesn’t wipe out a portfolio.
Position Sizing
Lot size isn’t just about ambition, it’s about survival. Position sizing must reflect both account size and volatility of the instrument. A highly volatile product like crude oil futures demands a smaller size than a low-volatility product like Treasury futures, even if account equity is the same.
Reward-to-Risk Ratio
Before placing a trade, the potential reward should always justify the risk. For example, risking 10 points to potentially gain 30 points gives a 3:1 reward-to-risk ratio — meaning you can be wrong more often than right and still be profitable over time.
Support, Resistance, and UFO Levels
Risk management becomes more effective when combined with technical reference points. Placing a stop-loss just beyond a well-defined support or UFO zone means that if price breaks through, the trade’s premise is invalidated. Similarly, setting profit targets near resistance zones allows traders to exit before momentum fades.
The Role of Discipline
None of these rules matter without discipline. A trader who moves stops, doubles down on losers, or takes oversized positions is effectively abandoning their edge. Consistency, not heroics, is what keeps traders in the game long enough to grow.
By embedding risk management into every decision, traders shift from chasing trades to controlling outcomes. The market will always be uncertain, but risk can always be defined.
Strategy Frameworks
While no strategy works all the time, every successful trader operates within a clear framework. Frameworks provide structure, helping traders decide when to engage the market and how to manage trades once they’re in.
Trend Following
The principle: “the trend is your friend.”
Traders look for higher highs and higher lows in an uptrend, or lower highs and lower lows in a downtrend.
Tools: moving averages, trendlines, and momentum indicators help confirm direction.
Mean Reversion
The assumption: prices oscillate around a fair value.
Traders buy when prices move far below the average and sell when they stretch too far above.
Tools: oscillators such as RSI or Stochastics signal overbought/oversold conditions.
Breakout Trading
Focused on capturing momentum when price escapes a range.
Traders identify consolidation zones and look for strong volume when price breaks through support or resistance.
Tools: candlestick patterns and chart patterns (triangles, rectangles, flags) often mark breakout points.
Volatility-Based Trading
Markets don’t just move in one direction; they expand and contract in volatility cycles.
Volatility traders adapt position size, target levels, and even strategy choice depending on whether the market is calm or turbulent.
The Role of Confirmation
Frameworks are strengthened when multiple signals align. For example, a breakout confirmed by a candlestick pattern and supported by volume at a UFO level carries more weight than a breakout without confirmation.
By mastering these strategy families, traders learn to adapt their approach to different environments instead of forcing one method onto all markets. Flexibility, not rigidity, is the true hallmark of mastery.
The Trader’s Process as a Scientific Method
The biggest difference between beginners and professionals isn’t the chart setup — it’s the process. Professionals treat trading as a science, not a game.
Step 1: Form a Hypothesis
Just like in a laboratory, the process begins with a hypothesis: “If price breaks above resistance with strong volume, then it is likely to continue higher.” The hypothesis defines what you expect and under what conditions.
Step 2: Backtest the Hypothesis
Rather than risking money immediately, traders test their idea against historical data. The goal is not to prove the trade will work, but to see whether it has worked consistently under similar conditions.
Step 3: Evaluate the Results
If backtesting shows inconsistent outcomes, the hypothesis must be refined or discarded. If results show positive expectancy, the door opens to the next stage.
Step 4: Trade Small in Live Markets
Even a strong backtest doesn’t guarantee success in the real world. Execution, slippage, and emotions enter the equation. That’s why traders begin with small size in live markets to confirm that performance holds.
Step 5: Scale with Confidence
Only after a hypothesis survives both backtesting and live verification should size be increased. At this point, the trader has turned uncertainty into structured probability.
By approaching the market scientifically, traders avoid gambling behavior. Instead of chasing tips or hunches, they move step by step, letting data guide decisions. In doing so, they transform trading from a mysterious guessing game into a disciplined pursuit of mastery.
Psychology of Trading
Even with a solid strategy and risk plan, many traders still struggle — not because the markets beat them, but because their own minds do. Psychology is the silent force that shapes every decision.
Discipline Over Impulse
The temptation to move stops, double down on losing trades, or exit winners too early is constant. Without discipline, even the best strategy collapses under emotional pressure.
Common Biases
• Recency bias: believing that the most recent outcome will repeat.
• Loss aversion: cutting winners short while letting losers run.
• Confirmation bias: searching for information that supports your existing view while ignoring evidence against it.
Emotional Cycles
Traders often swing between fear and greed. Fear prevents them from taking valid setups, while greed leads them to overtrade or oversize. Recognizing these emotional cycles is the first step toward controlling them.
The Power of Journaling
A trading journal records not just trades, but also the reasoning and emotions behind them. Over time, it becomes a mirror that reveals behavioral patterns — both strengths and weaknesses.
Process > Outcome
Individual trade results are largely random. Mastery comes from focusing on process rather than outcome. Following the plan consistently matters more than whether the next trade wins or loses.
By understanding and managing psychology, traders learn to master themselves first. The market will always test patience and conviction, but the disciplined trader treats emotions as signals to be managed — not instructions to follow.
Case Study: A Structured Trade Example
Theory becomes powerful only when applied in practice. Let’s walk through a trade example using the below chart attached.
Setup
The market is trending upward, confirmed by the SMA ribbon sloping higher.
A UFO support zone aligns with prior price action, creating a logical area where buyers may step in again.
A candlestick wick test into this zone provides confirmation of demand.
Trade Execution
Entry: Buy as price approaches the UFO support zone, in line with the trend.
Bracket Order: Place both a stop-loss and a profit target automatically.
(Stop-Loss: Positioned just below the UFO support zone. If price breaks down through support, the trade’s hypothesis is invalid. | Target: Set at the next UFO resistance zone, where prior sellers are likely to appear.)
Risk-to-Reward Balance
The defined stop ensures risk is limited.
The distance from entry to target is significantly larger than the distance to the stop, producing a favorable reward-to-risk ratio.
Outcome
Whether this trade wins or loses is secondary — the key is that it was structured with:
A clear hypothesis.
A defined entry, stop, and target.
Proper use of a bracket order.
Risk contained and reward potential aligned.
This is what separates structured trading from guesswork. Each element — support, UFOs, moving averages, and volume — works together as part of a process-driven decision, not an emotional one.
Conclusion: From Mystery to Mastery
For many traders, the markets begin as a blur of candles and numbers — a mystery that seems impossible to solve. But as we’ve seen, mastery doesn’t come from secrets or shortcuts. It comes from building a structured foundation:
Knowing the market type you’re trading, and whether it’s exchange-traded or over-the-counter.
Understanding the mechanics of orders, brackets, and volume.
Applying risk management principles that define losses before they happen.
Using strategy frameworks to adapt to different conditions.
Following a scientific process that tests hypotheses before scaling them.
Developing the psychological discipline to follow the plan consistently.
Executing trades with structure, where every element — entry, stop, and target — has a reason.
Trading mastery is not about eliminating uncertainty. It’s about controlling what you can — risk, process, discipline — and allowing the market to do the rest. The mystery never fully disappears, but with the right approach, it becomes manageable, even profitable.
This article is the first step in our From Mystery to Mastery series. Here, we’ve laid the foundation for trading in general. From here, we’ll expand into the specialized worlds of futures and options, where leverage, diversification, and advanced strategies open even more doors.
The journey continues — but the path is now clearer.
From Mystery to Mastery trilogy:
When studying markets, it’s important to remember that chart data can sometimes be delayed. This article has presented concepts that apply broadly to trading across all asset classes. The chart examples used here happen to feature products listed on exchanges operated by the CME Group. For traders who follow these products closely and wish to access real-time market data, TradingView offers a dedicated CME Group real-time data plan: www.tradingview.com . This is particularly relevant for shorter-term traders who depend on precise price action, though longer-term participants may find delayed data sufficient for their needs.
General Disclaimer:
The trade ideas presented herein are solely for illustrative purposes forming a part of a case study intended to demonstrate key principles in risk management within the context of the specific market scenarios discussed. These ideas are not to be interpreted as investment recommendations or financial advice. They do not endorse or promote any specific trading strategies, financial products, or services. The information provided is based on data believed to be reliable; however, its accuracy or completeness cannot be guaranteed. Trading in financial markets involves risks, including the potential loss of principal. Each individual should conduct their own research and consult with professional financial advisors before making any investment decisions. The author or publisher of this content bears no responsibility for any actions taken based on the information provided or for any resultant financial or other losses.
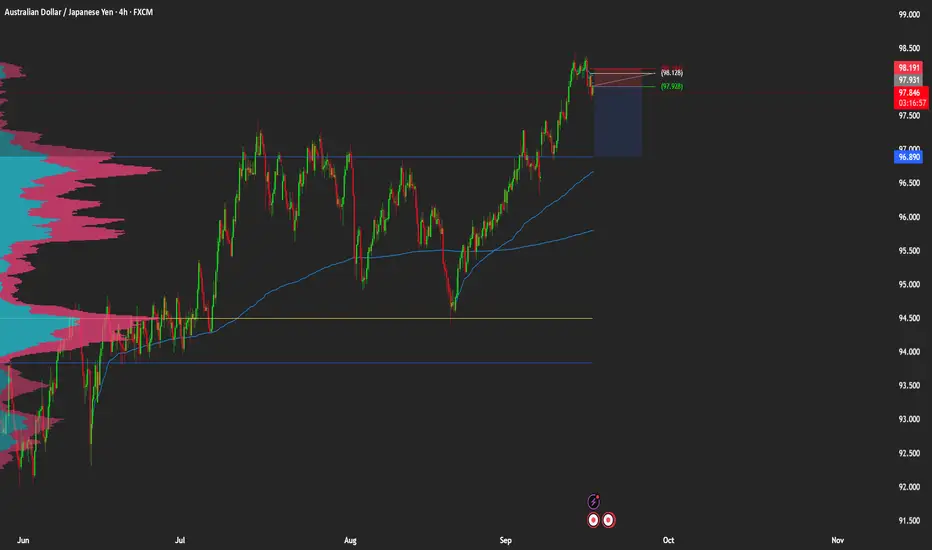
Short Idea On AUDJPYBased on :
- Supply zone and weekly avwap as entry level
- VP target 4rr
- Cot Analysis
- Quantitative Analysis
Short term idea Nikkei (JPN225)Based on -
- overvalued conditions (it need to retrace a little bit after a huge rally like the past days)
- supply zone
- voulme profile analysis

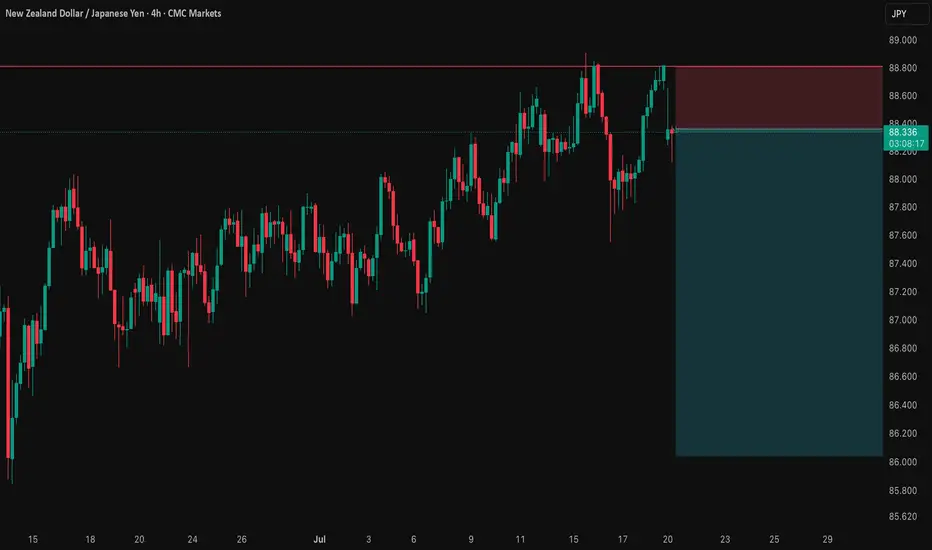
NZD/JPY: A Data-Driven Short SignalBefore I post a trade, I put it through a rigorous, multi-step analysis. Here’s exactly what I did for this NZD/JPY setup to build a data-driven case.
I Started with the 'Why': The Fundamental Story 📰
First, I identified the powerful divergence between the dovish RBNZ and the hawkish BoJ. This gave me my core bearish thesis for the pair.
I Challenged My Idea with Data: The Stress Test 🧠
A good story isn't enough. So, I ran this bearish idea through my mathematical models . My goal was to find any hidden risks and see if the hard data supported my fundamental view.
What My Analysis Revealed: A Warning and a Confirmation ⚠️
The data came back with two critical insights:
Confirmation: The models strongly validated the bearish direction with a high degree of mathematical probability.
Warning: They exposed a hidden danger—a standard entry had a very high probability of getting stopped out in the current market.
I Engineered the Solution: The Optimized Plan 🛠️
This is the most important step. I used these data insights to build a new trade plan from the ground up. The entry, stop loss, and take profit below are not guesses; they are the output of my analysis, specifically designed to navigate the risk the data uncovered.
The result is a trade with a huge 5.15-to-1 Risk-to-Reward ratio , where my fundamental view is now backed by a data-driven execution strategy. Let's get into it. 👇
The Complete Trade Plan
Strategy & Trade Parameters ✅
📉 Pair: NZD/JPY
👉 Direction: Short
⛔️ Entry: 88.35800
🎯 Take Profit: 86.04347
🛡️ Stop Loss: 88.80723
⚖️ Risk-Reward: 5.15
This setup represents my ideal trading approach: forming a strong fundamental thesis and then using disciplined, mathematical analysis to define the execution. The result is a plan where the direction is clear and the risk is precisely managed. Trade safe.
USD/JPY: The 150.00 Rejection SignalThe chart for USD/JPY looks like a simple one-way street going up. But underneath the surface, my quantitative models are in a state of conflict, and that's a high-clarity signal that something is about to change.
This isn't a signal to short right now. This is a signal to be patient and watch for a very specific setup that the "smart money" models are anticipating.
The Quant Conflict 🤖
My analysis involves several different mathematical models. Here's the situation:
One model, which is great at tracking trends, is still signaling BUY , following the obvious upward momentum.
However, two other, more complex models that analyze the relationships between economic data are now flashing a SELL signal. They are detecting underlying weakness that the price chart isn't showing yet.
When the simple trend model and the complex structural models disagree, it often means a major turning point is near. We are siding with the smarter models, but we need price action to confirm their warning.
The Game Plan 📊
We will use the 150.00 level as our "line in the sand." We are waiting for the market to fail at this level and then break down, which would confirm the bearish quant signal. This is our high-probability entry trigger.
Here is the exact setup we are waiting for:
📉 THE SETUP: A patient short position, waiting for confirmation of a breakdown.
👉 ENTRY: We enter only on a confirmed daily close below 148.00.
⛔️ STOP LOSS: Place the stop just above the psychological wall at 150.25.
🎯 TAKE PROFIT: Our primary target is the major support level at 145.00.
This is a setup where patience pays. We are letting the market do the hard work and show its hand before we commit. Let's watch this one closely.

AUD/USD: Short Setup to 0.6450This trade idea is rooted in a data-driven approach, leveraging a rare asymmetry in the economic calendar and specific quantitative models to identify a high-clarity opportunity.
📊 The Thesis by the Numbers
My model assigns clear probabilities to the potential scenarios for this week, based on the scheduled U.S. data releases.
60% Probability: Base Case (USD Strength). Triggered by a U.S. Core CPI reading at or above 0.3% MoM.
30% Probability: Alternative Case (USD Weakness).
10% Probability: Wildcard Scenario (Risk-On Rally).
🧠 The Data-Driven Rationale
This setup scored a -5 on my quantitative thesis model, indicating a strong bearish conviction. The core of this is the one-sided event risk. With Australia's calendar completely empty, the AUD is a sitting duck. Meanwhile, a volley of tier-one U.S. data (CPI, PPI, Retail Sales) is expected to confirm a robust economy. This fundamental divergence, combined with a technical picture of price coiling below long-term resistance, creates the conditions for a catalyst-driven drop.
⛓️ Intermarket & Statistical Edge
Further analysis of market correlations and forward-looking models reinforces the bearish bias.
🌐 Correlations: The positive correlation of AUD/USD with equities (SPY: +0.31) suggests that a strong USD report, which could pressure stocks, would create a direct headwind for the Aussie.
🎲 Monte Carlo Simulation: While the mean outcome is neutral, the model's 5th percentile for price is down at 0.6503 , highlighting the statistical risk of a significant downside move if the catalyst fires.
✅ The Trade Setup
📉 Bias: Bearish / Short
👉 Entry: Watch for a bearish reversal pattern on the 1H or 4H chart within the $0.6550 resistance zone.
⛔️ Stop Loss: A decisive daily close above the 0.6622 resistance level.
🎯 Target: 0.6458 (June low-day close).
Good luck, and trade safe.

Quantitative Trading Models in Forex: A Deep DiveQuantitative Trading Models in Forex: A Deep Dive
Quantitative trading in forex harnesses advanced algorithms and statistical models to decode market dynamics, offering traders a sophisticated approach to currency trading. This article delves into the various quantitative trading models, their implementation, and their challenges, providing insights for traders looking to navigate the forex market with a data-driven approach.
Understanding Quantitative Trading in Forex
Quantitative trading, also known as quant trading, in the forex market involves using sophisticated quantitative trading systems that leverage complex mathematical and statistical methods to analyse market data and execute trades. These systems are designed to identify patterns, trends, and potential opportunities in currency movements that might be invisible to the naked eye.
At the heart of these systems are quantitative trading strategies and models, which are algorithmic procedures developed to determine market behaviour and make informed decisions. These strategies incorporate a variety of approaches, from historical data analysis to predictive modelling, which should ensure a comprehensive assessment of market dynamics. Notably, in quantitative trading, Python and similar data-oriented programming languages are often used to build models.
In essence, quantitative systems help decipher the intricate relationships between different currency pairs, economic indicators, and global events, potentially enabling traders to execute trades with higher precision and efficiency.
Key Types of Quantitative Models
Quantitative trading, spanning diverse markets such as forex, stocks, and cryptocurrencies*, utilises complex quantitative trading algorithms to make informed decisions. While it's prominently applied in quantitative stock trading, its principles and models are particularly significant in the forex market. These models are underpinned by quantitative analysis, derivative modelling, and trading strategies, which involve mathematical analysis of market movements and risk assessment to potentially optimise trading outcomes.
Trend Following Models
Trend-following systems are designed to identify and capitalise on market trends. Using historical price data, they may determine the direction and strength of market movements, helping traders to align themselves with the prevailing upward or downward trend. Indicators like the Average Directional Index or Parabolic SAR can assist in developing trend-following models.
Mean Reversion Models
Operating on the principle that prices eventually move back towards their mean or average, mean reversion systems look for overextended price movements in the forex market. Traders use mean reversion strategies to determine when a currency pair is likely to revert to its historical average.
High-Frequency Trading (HFT) Models
Involving the execution of a large number of orders at breakneck speeds, HFT models are used to capitalise on tiny price movements. They’re less about determining market direction and more about exploiting market inefficiencies at micro-level time frames.
Sentiment Analysis Models
These models analyse market sentiment data, such as news headlines, social media buzz, and economic reports, to gauge the market's mood. This information can be pivotal in defining short-term movements in the forex market, though this model is becoming increasingly popular for quantitative trading in crypto*.
Machine Learning Models
These systems continuously learn and adapt to new market data by incorporating AI and machine learning, identifying complex patterns and relationships that might elude traditional models. They are particularly adept at processing large volumes of data and making predictive analyses.
Hypothesis-Based Models
These models test specific hypotheses about market behaviour. For example, a theory might posit that certain economic indicators lead to predictable responses in currency markets. They’re then backtested and refined based on historical data to validate or refute the hypotheses.
Each model offers a unique lens through which forex traders can analyse the market, offering diverse approaches to tackle the complexities of currency trading.
Quantitative vs Algorithmic Trading
While quant and algorithmic trading are often used interchangeably and do overlap, there are notable differences between the two approaches.
Algorithmic Trading
Focus: Emphasises automating processes, often using technical indicators for decision-making.
Methodology: Relies on predefined rules based on historical data, often without the depth of quantitative analysis.
Execution: Prioritises automated execution of trades, often at high speed.
Application: Used widely for efficiency in executing repetitive, rule-based tasks.
Quantitative Trading
Focus: Utilises advanced mathematical and statistical models to determine market movements.
Methodology: Involves complex computations and data analysis and often incorporates economic theories.
Execution: May or may not automate trade execution; focuses on strategy formulation.
Application: Common in risk management and strategic trade planning.
Implementation and Challenges
Implementing quantitative models in forex begins with the development of a robust strategy involving the selection of appropriate models and algorithms. This phase includes rigorous backtesting against historical data to validate their effectiveness. Following this, traders often engage in forward testing in live market conditions to evaluate real-world performance.
Challenges in this realm are multifaceted. Key among them is the quality and relevance of the data used. Models can be rendered ineffective if based on inaccurate or outdated data. Overfitting remains a significant concern, where systems too closely tailored to historical data may fail to adapt to evolving market dynamics. Another challenge is the constant need to monitor and update models to keep pace with market changes, requiring a blend of technical expertise and market acumen.
The Bottom Line
In this deep dive into quantitative trading in forex, we've uncovered the potency of diverse models, each tailored to navigate the complex currency markets with precision. These strategies, rooted in data-driven analysis, may offer traders an edge in decision-making.
*Important: At FXOpen UK, Cryptocurrency trading via CFDs is only available to our Professional clients. They are not available for trading by Retail clients. To find out more information about how this may affect you, please get in touch with our team.
This article represents the opinion of the Companies operating under the FXOpen brand only. It is not to be construed as an offer, solicitation, or recommendation with respect to products and services provided by the Companies operating under the FXOpen brand, nor is it to be considered financial advice.

Buy idea on AMAZON (AMZN)Based On :
- Presidential cycle and quinquennial cycle
- quantitative data
- strong demand zone covered by weekly and 2w as well
- divergence on Poiv (open interest from Nq) and Progo
- Undervalued conditions on weekly timeframe
