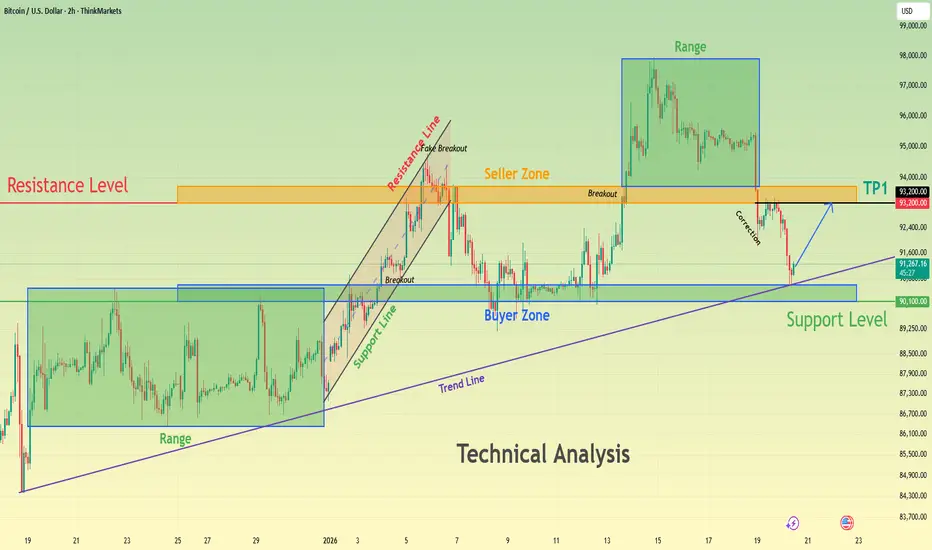
BTCUSD Holds Above Demand - Next Move Toward 93,200 ResistanceHello traders! Here’s my technical outlook on BTCUSD (2H) based on the current chart structure. Bitcoin is trading within a clear bullish environment after transitioning from a prolonged consolidation phase into an impulsive upward move. Earlier on the chart, price was moving inside a well-defined range, indicating balance between buyers and sellers and a period of accumulation. This range was eventually resolved to the upside, confirming a shift in market control in favor of buyers. Following the breakout, BTCUSD accelerated higher and successfully established acceptance above the former range highs. Currently, price is trading above the Support Level around the 90,100 area, which aligns with a clearly defined Buyer Zone and a previous structural level. This area is now acting as a key demand zone after the breakout and is reinforced by the rising trend line, strengthening its importance. The recent pullback into this support appears corrective rather than impulsive, suggesting healthy profit-taking instead of aggressive selling pressure. Buyers are actively defending this zone, keeping the bullish structure intact as long as price remains above support. If buyers continue to defend the 90,100 Buyer Zone, BTCUSD could resume its upward move toward the 93,200 Resistance Level, which serves as the next key objective. A clean continuation and acceptance above this resistance would confirm further upside momentum and open the door for continuation toward higher targets (TP1 and beyond). However, a decisive breakdown and acceptance below the support zone and rising trend line would signal a deeper correction and weaken the bullish setup. For now, the overall structure favors buyers while price respects support. Please share this idea with your friends and click Boost 🚀
Range
XAUUSD: Holds Key Support - Buyers Aim for $4,720 ResistanceHello everyone, here is my breakdown of the current XAUUSD setup.
Market Analysis
XAUUSD is trading within a broader bullish market structure, supported by a rising trend line that has guided price action from the recent swing lows. Earlier in the move, gold advanced inside a well-defined upward channel, confirming strong buyer control with consistent higher highs and higher lows. This bullish leg eventually led to a breakout attempt near the upper boundary of the channel, after which price experienced a sharp corrective move and transitioned into a consolidation phase. Following the correction, XAUUSD formed a range, where price moved sideways as buyers and sellers reached temporary equilibrium. This range acted as an accumulation zone before the next directional move. Price eventually broke out of the range to the upside, signaling renewed bullish momentum. However, shortly after the breakout, a fake breakout occurred on the downside, where price briefly dipped below support but was quickly reclaimed by buyers, reinforcing demand strength.
Currently, price is holding above a clearly defined Support Zone around 4,650, which aligns with the former range high and a key structural level. This area is now acting as demand after the successful breakout and retest. On the upside, XAUUSD is approaching a major Resistance Zone near 4,720, where selling pressure has previously emerged. The recent price action shows controlled consolidation above support, suggesting continuation rather than distribution.
My Scenario & Strategy
My primary scenario remains bullish as long as XAUUSD holds above the 4,650 Support Zone and continues to respect the rising trend line. In this case, I expect buyers to remain in control and attempt another push toward the 4,720 Resistance Zone (TP1). A clean breakout and acceptance above this resistance would confirm bullish continuation and open the door for further upside expansion.
However, a strong rejection from resistance followed by a decisive breakdown below the 4,650 support would weaken the bullish bias and signal a deeper corrective move. Until that happens, the overall structure favors buyers, and pullbacks into support are viewed as potential continuation opportunities.
That’s the setup I’m tracking. Thank you for your attention, and always manage your risk.

XAUUSD Long: Uptrend Holds as Price Respects Rising Trend LineHello traders! Here’s a clear technical breakdown of XAUUSD (1H) based on the current chart structure. Gold is trading within a well-defined bullish structure after forming a clear pivot low earlier on the chart. From this pivot point, a rising trend line has been established, highlighting consistent buyer participation and a gradual shift in market control toward the upside. This trend line has been respected multiple times, confirming it as a key dynamic support guiding the bullish move. Following the pivot, price advanced and broke above a descending supply line, signaling a structural change from corrective pressure to bullish continuation. This breakout was impulsive, indicating strong demand entering the market. After the breakout, XAUUSD transitioned into a consolidation range, where price moved sideways as buyers and sellers reached temporary equilibrium. This range acted as a continuation structure rather than distribution.
Currently, price eventually broke out of the range to the upside, confirming renewed bullish momentum. After the breakout, gold pulled back and successfully retested the former resistance area, which is now acting as a Demand Zone around 4,700. This retest appears corrective, not impulsive, suggesting healthy price action and continued buyer dominance rather than trend exhaustion. On the upside, the next key level is the Supply Zone near 4,770, where previous selling pressure is expected to reappear. The current structure shows higher highs and higher lows, and price remains firmly above both horizontal demand and the rising trend line, keeping the bullish bias intact.
My scenario: as long as XAUUSD holds above the 4,700 Demand Zone and continues to respect the ascending trend line, the bullish structure remains valid. I expect buyers to defend this area and potentially push price toward the 4,770 Supply Zone (TP1). A clean breakout and acceptance above this level would confirm further bullish continuation. However, a decisive breakdown below the demand zone and trend line would weaken the bullish bias and signal a deeper corrective move. For now, market structure clearly favors buyers. Manage your risk!

BTCUSDT Long: Rising Trend Line and Demand Supports Bullish BiasHello traders! Here’s a clear technical breakdown of BTCUSDT (2H) based on the current chart structure. Bitcoin is trading within a developing bullish structure after forming a clear pivot low, from which a rising trend line has been established. This trend line reflects increasing buyer participation and gradual strength returning to the market. Following the pivot, price moved higher and transitioned from consolidation into an impulsive bullish leg, confirming a structural shift. After the upside move, BTC reached a clearly defined Supply zone around 94,500, where selling pressure stepped in. This reaction led to a range formation just below supply, indicating temporary consolidation after the impulsive rally. This range reflects short-term equilibrium rather than a trend reversal, as price remains structurally supported.
Currently, BTC is reacting from a strong Demand zone around 91,900, which aligns closely with the rising trend line. This confluence between horizontal demand and dynamic support strengthens the level. The recent pullback into demand appears corrective rather than impulsive, suggesting that sellers are losing momentum and buyers continue to defend structure.
My scenario: as long as BTCUSDT holds above the 91,900 demand zone and respects the ascending trend line, the market structure remains bullish. A sustained reaction from demand could lead to another attempt toward the 94,500 supply zone, and a confirmed breakout above this level would open the door for further upside continuation. A decisive breakdown and acceptance below demand would invalidate the bullish bias and shift focus toward deeper corrective levels. For now, price remains compressed between demand and supply, with buyers maintaining structural control. Manage your risk!

EURUSD Descending Channel Points to Further Downside To 1.1560Hello traders! Here’s a clear technical breakdown of EURUSD (3H) based on the chart structure shown in the screenshot. EURUSD initially traded inside a well-defined ascending channel, confirming a bullish recovery phase after forming a base from the prior decline. Price respected the rising support line and produced higher highs and higher lows, showing strong buyer control. During this bullish phase, the market experienced several breakouts and fake breakouts near the upper boundary of the channel, signaling increasing volatility and early signs of exhaustion. As price approached the upper resistance area, buying momentum weakened, and the market failed to sustain acceptance above the highs. Near the top of the structure, EURUSD formed a clear turnaround and distribution phase, followed by a loss of bullish momentum. Price then broke below the ascending channel, confirming a structural shift. After this breakdown, the market transitioned into a descending channel, where price is now forming lower highs and lower lows. This confirms that sellers have taken short-term control, and bullish moves are now corrective in nature. A key Seller Zone / Resistance Level around 1.1680 was tested multiple times after the breakdown. Each attempt to reclaim this area resulted in rejection, reinforcing it as a strong supply zone. Recent price action shows continued respect of the descending channel resistance, with pullbacks failing and momentum favoring the downside. Currently, EURUSD is trading below resistance and is moving toward the Buyer Zone and Support Level around 1.1560, which aligns with previous structure and demand. This area represents the next key reaction zone and the primary downside objective (TP1). A reaction or temporary pause may occur there, but structurally it remains a bearish continuation zone unless buyers regain control. My scenario: as long as EURUSD stays below the 1.1680 Resistance / Seller Zone and continues to respect the descending channel, the bearish bias remains valid. I expect sellers to push price toward the 1.1560 Support / Buyer Zone (TP1). A clean breakdown and acceptance below this level would open the door for a deeper bearish continuation. However, a strong bullish breakout and acceptance back above 1.1680 would invalidate the short scenario and suggest a shift back toward consolidation or recovery. For now, market structure clearly favors sellers. Please share this idea with your friends and click Boost 🚀

EURUSD: A Pullback to 1.1680 is Planned Before Further GrowthHello everyone, here is my breakdown of the current EURUSD setup.
Market Analysis
EURUSD previously traded within a well-defined upward channel, confirming a bullish recovery phase with higher highs and higher lows. During this advance, price respected the rising support line and produced several breakout attempts, showing strong buyer control at that stage. However, as the pair approached the upper boundary of the structure and the broader Resistance Zone around 1.1735–1.1740, bullish momentum began to weaken. Near this resistance area, EURUSD formed multiple fake breakouts, signaling seller absorption and exhaustion at the highs. Price failed to achieve acceptance above resistance and subsequently lost upward momentum. This failure marked a structural shift, as EURUSD broke below the rising channel support and transitioned into a clearly defined descending channel. From that point, price started forming lower highs and lower lows, confirming that sellers have taken control in the short to medium term. After the breakdown, EURUSD continued to respect the downward channel, with pullbacks acting as corrective moves rather than impulsive bullish legs.
Currently, price broke above the short-term descending channel support, triggering a corrective bounce. This move, however, appears to be a retracement into prior resistance, not a trend reversal. The current rally is testing the Resistance Zone near 1.1735–1.1740, which also aligns with previous support turned resistance and the upper boundary of the bearish structure. On the downside, a key Support Zone / Buyer Zone around 1.1680 remains critical. This level has acted as a reaction area multiple times and represents the next downside objective if sellers regain control.
My Scenario & Strategy
My primary scenario remains bearish as long as EURUSD stays below the 1.1735–1.1740 Resistance Zone and fails to gain acceptance above it. I expect sellers to defend this area and push price back toward the 1.1680 Support Zone (TP1). A clean rejection from resistance would confirm continuation within the broader bearish structure. If price breaks and holds below 1.1680, it would open the door for a deeper bearish continuation toward lower support levels.
However, a strong bullish breakout and acceptance above 1.1740 would invalidate the short setup and suggest a shift back toward consolidation or renewed bullish recovery. For now, the market structure favors sellers, and the current move looks corrective within a broader bearish phase.
That’s the setup I’m tracking. Thank you for your attention, and always manage your risk.

EURUSD Short: Supply Holds, Bears in Control, Move To 1.1550Hello traders! Here’s a clear technical breakdown of EURUSD (3H) based on the current chart structure. EURUSD initially traded within a consolidation range, where price moved sideways after a prior decline, indicating temporary equilibrium between buyers and sellers. This range acted as a base for the next directional move. A confirmed breakout from the range triggered a bullish recovery, shifting short-term control to buyers. Following the breakout, price developed a well-defined ascending channel, marked by consistent higher highs and higher lows. Pullbacks during this phase were corrective and respected the channel structure, confirming sustained bullish momentum. However, as EURUSD approached the upper boundary of the channel, upside strength began to fade. A fake breakout above channel resistance signaled buyer exhaustion and increasing sell-side pressure at higher prices. Near the highs, price formed a clear rounding top pattern around a key pivot point, reflecting a gradual loss of bullish momentum rather than an impulsive reversal. This topping structure was followed by a breakdown below internal support, confirming a short-term shift in market control. After losing the ascending structure, EURUSD transitioned into a descending channel, establishing a bearish corrective phase characterized by lower highs and lower lows.
Currently, EURUSD is trading within the descending channel and moving toward a key Demand Zone around 1.1550, which aligns with previous structural support and historical reactions. This zone represents the next important area where selling momentum may slow and buyers could attempt a defensive response.
My primary scenario remains bearish as long as EURUSD stays below the 1.1680 Supply Zone and continues to respect the descending channel structure. Pullbacks into supply that show rejection can be viewed as potential continuation opportunities, with 1.1550 Demand Zone acting as the first downside target (TP1). A clean breakdown and acceptance below 1.1550 would open the door for a deeper bearish continuation toward lower demand levels. However, a strong bullish breakout and sustained acceptance above 1.1680 would invalidate the short bias and signal a possible transition back into consolidation or bullish recovery. Until such a breakout occurs, market structure favors sellers, and upside moves are considered corrective. Manage your risk!

BTCUSDT: Buyers Defends, Preparing for Breakout Above $96.5KHello everyone, here is my breakdown of the current BTCUSDT setup.
Market Analysis
BTCUSDT is trading within a well-defined ascending channel, confirming a strong bullish market structure. After a prolonged consolidation phase earlier on the chart, price successfully broke out to the upside and began forming higher highs and higher lows, signaling renewed buyer strength. Following the breakout, BTC rallied aggressively toward a key Resistance Zone around 96,500, where selling pressure became evident. Multiple tests of this resistance area failed to produce a clean continuation higher, leading price into a range formation just below resistance. This range reflects temporary equilibrium between buyers and sellers after the impulsive move up.
Currently, on the downside, price is being supported by a clearly defined Support Zone around 94,000, which previously acted as a breakout level and is now serving as demand. The market recently tested this support and reacted positively, indicating that buyers are still active and defending the level. Structurally, BTC remains above both the channel support and the horizontal support zone, keeping the broader bullish bias intact. The presence of a descending triangle resistance line within the range highlights short-term compression, suggesting that a volatility expansion may follow once price decisively breaks out of the current structure.
My Scenario & Strategy
My primary scenario remains bullish as long as BTCUSDT holds above the 94,000 Support Zone and respects the ascending channel structure. In this case, I expect price to continue consolidating briefly before attempting another move toward the 96,500 Resistance Zone, with a potential breakout opening the way for further upside continuation.
However, a clean breakdown and acceptance below 94,000 would invalidate the bullish setup and signal a deeper corrective move within the channel, possibly toward lower support levels. Until that happens, the market structure favors buyers, and pullbacks into support are viewed as potential long opportunities, while resistance remains the key level to watch for confirmation.
That’s the setup I’m tracking. Thank you for your attention, and always manage your risk.

XAUUSD Ascending Channel Holds, Upside Toward $4,950Hello traders! Here’s my technical outlook on XAUUSD (1H) based on the current chart structure. Gold is trading within a well-defined bullish structure, supported by a rising price channel formed after a clear shift in market control from sellers to buyers. Earlier on the chart, price respected the ascending support line, creating higher lows and confirming sustained buying pressure. This gradual advance led to a consolidation phase, where price formed a clear range, reflecting temporary balance before continuation. Following the range, XAUUSD broke out to the upside, confirming trend continuation. This breakout was supported by a clean impulse move and acceptance above the former range high. After the breakout, price successfully retested the Buyer Zone around 4,820, which aligns with the prior resistance turned support and the lower boundary of the bullish channel. This area is acting as a strong demand zone, where buyers are actively defending the structure. Currently, price is moving higher within the ascending channel and approaching a key Resistance Level and Seller Zone near 4,950. This zone represents a major upside objective and a potential area for profit-taking or seller reaction. The bullish momentum remains intact as long as price holds above the Buyer Zone and respects the rising support line. My scenario: as long as XAUUSD stays above the 4,820 Buyer Zone, the bullish structure remains valid. Continued strength could drive price toward the 4,950 resistance level (TP1). A clean breakout and acceptance above this seller zone would open the door for further upside continuation. However, a decisive rejection from resistance could lead to a corrective pullback toward the Buyer Zone. A breakdown below support would weaken the bullish bias and signal a deeper correction. For now, the market structure favors buyers while price remains supported within the ascending channel. Please share this idea with your friends and click Boost 🚀

GBPAUD LONGS - RANGE TRADE
GBPAUD has found support at the 2.0000 zone, this is in confluence with the price stabilising above the weekly 100MA.
Given this areas level of strong support I am anticipating buyers to enter the market with TP 1 @ 2.012 & TP2 @ 2.01800 if the range is completed with the expected buy pressue

EURUSD: Bullish Setup After Corrective Channel PullbackHello everyone, here is my breakdown of the current EURUSD setup.
Market Analysis
EURUSD is trading within a broader bullish structure, supported by a rising trend line that has guided price action from the recent swing lows. Earlier in the move, price formed a clear accumulation range, where the market consolidated before initiating an upside breakout. This breakout was followed by continuation to the upside, confirming strong buyer participation and a bullish shift in market control. After the impulsive move higher, EURUSD entered a corrective phase, forming a well-defined descending channel. This pullback appears corrective rather than impulsive, as price action remains orderly with overlapping candles and decreasing momentum — a typical bullish retracement behavior. Importantly, this correction is occurring above the higher-timeframe ascending trend line, preserving the overall bullish structure.
Currently, price is reacting from the Support Zone around 1.1600–1.1620, which aligns with: The lower boundary of the descending channel. A key horizontal support level. The rising trend line from prior lows. This confluence increases the probability of buyers stepping in. On the upside, the Resistance Zone near 1.1680 represents the prior breakout level and the top of the corrective structure. A successful reclaim of this zone would confirm the end of the correction and signal bullish continuation.
My Scenario & Strategy
My primary scenario remains bullish as long as EURUSD holds above the 1.1600 Support Zone and respects the rising trend line. I expect buyers to defend this area and attempt a push higher toward the 1.1680 Resistance Level (TP1). A clean breakout and acceptance above 1.1680 would confirm bullish continuation and open the path toward higher targets.
However, a decisive breakdown below the support zone and trend line would weaken the bullish structure and suggest a deeper corrective move or potential range formation. For now, structure favors buyers while price holds above support. As always, manage your risk and wait for confirmation at key levels.
That’s the setup I’m tracking. Thank you for your attention, and always manage your risk.

Gold Price Respects Ascending Trend Line - Next Target 4,680Hello traders! Here’s my technical outlook on XAUUSD (4H) based on the current chart structure shown in the screenshot. XAUUSD is trading within a broader bullish structure, supported by a well-defined ascending trend line that has guided price action since the market formed a solid base and started to grow. After the initial recovery, gold transitioned into a consolidation range, where price moved sideways, showing temporary balance between buyers and sellers. This range was eventually resolved to the upside with a clean breakout, confirming renewed bullish momentum. Following the breakout, price continued higher along the rising trend line, forming higher highs and higher lows. During this advance, the market experienced several false breakouts and shallow corrections, all of which were absorbed above the trend line, highlighting strong demand on pullbacks. The area around 4,540–4,560 is clearly defined as a Buyer Zone / Support Level, where previous resistance flipped into support and buyers repeatedly stepped in. Currently, XAUUSD is trading above the Buyer Zone and holding above the ascending trend line, which keeps the bullish structure intact. Price is now approaching the Seller Zone / Resistance Level around 4,660–4,680, which aligns with a descending resistance line from prior highs. This area represents a key supply zone where selling pressure may emerge and cause a reaction or short-term consolidation. My scenario: as long as XAUUSD remains above the Buyer Zone and continues to respect the rising trend line, the bullish bias remains valid. I expect buyers to defend pullbacks into support and attempt a continuation move toward the 4,680 Resistance Level (TP1). A clean breakout and acceptance above this resistance would confirm further bullish continuation and open the door for higher targets. However, a strong rejection from the Seller Zone followed by a decisive breakdown below the Buyer Zone and trend line would weaken the bullish structure and signal a deeper corrective move. For now, price is at a key decision area near resistance, and patience with proper risk management is essential. Please share this idea with your friends and click Boost 🚀

BTCUSD Facing Rejection at Seller Zone - Short Scenario in PlayHello traders! Here’s my technical outlook on BTCUSD (1H) based on the current chart structure. BTCUSD is currently trading within a broader corrective-to-bearish structure after failing to sustain bullish momentum near the recent highs. Earlier in the session, price moved inside an ascending channel, where higher highs and higher lows suggested temporary buyer control. However, as price approached the major Resistance Level / Seller Zone around 97,100, bullish momentum began to weaken significantly. At this resistance, BTCUSD printed a fake breakout, signaling exhaustion of buyers and strong seller presence. The inability to hold above the Seller Zone marked a local top and triggered a structural reaction. Following this rejection, price started to compress between a descending resistance line and a rising support line, forming a tightening structure that reflects increasing selling pressure and distribution near the highs. Prior to this move, BTCUSD had traded within a well-defined range, where price consolidated before breaking out impulsively to the upside. That breakout led directly into the Seller Zone, but the lack of acceptance above resistance confirms that the breakout was likely a liquidity grab rather than a true continuation. Since then, price has moved back below the resistance level and is now trading under the key intraday structure. Currently, BTCUSD is holding below the Seller Zone (97,100) and failing to reclaim the resistance line, which keeps the short-term bias tilted to the downside. Below current price, the Support Level / Buyer Zone around 93,100 stands out as the next key area of interest. This zone aligns with previous range support and represents a logical TP1 target, where buyers may attempt to step back in. My scenario: as long as BTCUSD remains below the 97,100 Resistance Level and continues to respect the descending resistance structure, the bearish bias remains valid. I expect price to continue lower toward the 93,100 Support Level (TP1). A clean breakdown and acceptance below this support could open the door for a deeper corrective move. However, a strong bullish reclaim and acceptance above the Seller Zone would invalidate the bearish scenario and signal a potential continuation to the upside. For now, market structure favors sellers while price trades below resistance. Please share this idea with your friends and click Boost 🚀

Options Blueprint Series [Intermediate]: Lunar Timing and ThetaIntroduction
This edition of the Options Blueprint Series focuses on gold futures and micro gold futures, using an iron condor options structure to explore how time decay (theta) can be positioned in an environment where signals conflict rather than agree.
Gold has been trading at elevated levels, attracting strong participation from momentum-driven traders while simultaneously showing signs of short-term exhaustion. This creates a valuable learning environment for options traders, particularly those interested in non-directional strategies that rely more on time and range behavior than outright price direction.
This article is presented as a case study. All tools, indicators, and trade structures discussed are used for educational purposes only. Lunar timing, in particular, is included as a belief-based analytical lens used by some market participants, not as a predictive mechanism.
Market Context: Gold at Elevated Levels
Gold futures have experienced a powerful rally since the reopening of U.S. Sunday evening trading hours, extending an already strong longer-term uptrend. Price is now operating at new all-time highs, a condition that often amplifies emotional behavior among trend followers.
In such environments, markets frequently display two competing forces:
Continued upside pressure driven by momentum and fear of missing out
Short-term vulnerability driven by overextension, crowding, and mean-reversion dynamics
Rather than attempting to resolve which force will dominate, this Options Blueprint explores how options structures can be used to frame uncertainty itself.
Analytical Inputs Used in This Case Study
This framework combines multiple analytical perspectives. None are presented as definitive signals; instead, they are used to illustrate how diverse inputs can shape options structure selection.
Lunar Timing (Moon Phases Indicator)
The chart highlights waxing and waning moon phases:
Waxing moons are displayed in blue
Waning moons are displayed in gray
The current market condition coincides with a waxing moon phase, which some traders interpret as a potentially bearish timing window. It is important to stress that lunar analysis is belief-based, not empirically causal. Its inclusion here is intentional for educational diversity and contextual layering, not validation.
Bollinger Bands® on Multiple Timeframes
Two Bollinger Bands® sets are applied:
One based on the daily timeframe
One based on the weekly timeframe
Price is approaching, and in some instances penetrating, the upper bands on both timeframes simultaneously. This alignment often signals volatility expansion and late-stage trend behavior, increasing the probability of range stabilization or consolidation, even if the broader trend remains intact.
RSI and Divergence
The Relative Strength Index is set to standard parameters: Length = 14
A bearish divergence is visible, where momentum fails to confirm new price highs. Notably, the
RSI length coincides numerically with half of a lunar cycle. This coincidence is observational only and does not imply a functional relationship.
Structural Support Below Price: UFO Context
Below current price, the chart highlights UFOs (UnFilled Orders) clustered near 4,527. These represent areas where prior price discovery was incomplete, often acting as zones of liquidity and structural interest.
This region introduces an important counterbalance:
While short-term indicators lean bearish
Structural market mechanics suggest potential downside cushioning
This combination reinforces the idea of a bounded market environment, rather than a clean directional thesis.
Why an Iron Condor Fits This Environment
When markets present conflicting directional evidence, strategies that benefit from price containment and time decay become particularly relevant.
An iron condor:
Does not require a bullish or bearish forecast
Defines risk in advance
Benefits from theta as time passes
Allows strike placement around known volatility and structure zones
In this context, the iron condor serves as a framework for uncertainty, not a directional expression.
Iron Condor Structure (Illustrative Example)
This case study uses a January 27 expiration within the GCG contract cycle.
Call Side
Short 4,850 call
Long 4,900 call
Put Side
Short 4,500 put
Long 4,450 put
The strikes are positioned at approximately equal distance from current price, with the downside aligned near known UFO structural support.
Key Characteristics
Net theoretical credit: approximately 10.3 points
Theoretical maximum risk: approximately 39.7 points
Lower break-even: near 4,490
Upper break-even: near 4,860
As long as price remains within this range through expiration, the structure benefits from time decay. If price exits the range, losses are predefined and limited.
Theta: Time as the Primary Variable
In short-option structures, theta becomes the dominant driver of performance when price remains stable.
Key educational takeaways:
Theta accelerates as expiration approaches
Time decay is not linear
Volatility changes can amplify or offset theta
Direction matters less than location and pace
This structure highlights how patience and risk definition often matter more than directional conviction.
Managing an Iron Condor
There are many ways traders manage iron condors as conditions evolve. Without going into procedural detail, common approaches include:
Rolling positions forward in time
Adjusting strikes to rebalance risk
Reducing exposure on one side of the structure
Management decisions depend on price behavior, remaining time, volatility, and individual risk tolerance.
Contract Specifications: GC vs MGC
Gold Futures (GC)
Contract size: 100 troy ounces
Tick size: 0.1
Tick value: $10
Outright margin: $22,900
Micro Gold Futures (MGC)
Contract size: 10 troy ounces
Tick size: 0.1
Tick value: $1
Outright margin: $2,290
Both contracts follow the same structural logic, allowing traders to scale exposure while maintaining identical analytical frameworks.
Margin requirements for futures and futures options are dynamic rather than fixed, meaning they may vary over time in response to changes in market volatility, price levels, and risk conditions as determined by exchanges and clearing firms.
Depending on the broker and clearing arrangements, the specific margin requirement for an iron condor is frequently set near the position’s maximum theoretical risk; in this illustrative case study, that risk is approximately 39.7 points ($397), though margin treatment can vary.
Risk Management Considerations
Even defined-risk strategies carry meaningful risk. Key principles include:
Position sizing relative to account equity
Awareness of gap and volatility risk
Understanding assignment and expiration mechanics
Options limit risk by design, but do not eliminate uncertainty.
Final Thoughts
This Options Blueprint demonstrates how lunar timing, volatility structure, RSI behavior, and UFO context can coexist within a single framework, without requiring directional certainty.
The iron condor is not presented as a solution, but as a lens through which uncertainty can be structured, with time decay acting as the central variable.
Markets rarely offer clarity. Options allow traders to respond to that reality with structure, discipline, and predefined risk.
Data Consideration
When charting futures, the data provided could be delayed. Traders working with the ticker symbols discussed in this idea may prefer to use CME Group real-time data plan on TradingView: www.tradingview.com - This consideration is particularly important for shorter-term traders, whereas it may be less critical for those focused on longer-term trading strategies.
General Disclaimer
The trade ideas presented herein are solely for illustrative purposes forming a part of a case study intended to demonstrate key principles in risk management within the context of the specific market scenarios discussed. These ideas are not to be interpreted as investment recommendations or financial advice. They do not endorse or promote any specific trading strategies, financial products, or services. The information provided is based on data believed to be reliable; however, its accuracy or completeness cannot be guaranteed. Trading in financial markets involves risks, including the potential loss of principal. Each individual should conduct their own research and consult with professional financial advisors before making any investment decisions. The author or publisher of this content bears no responsibility for any actions taken based on the information provided or for any resultant financial or other losses.

XAUUSD Short: Rejection from Major Supply, Eyes On $4,520 DemandHello traders! Here’s a clear technical breakdown of XAUUSD (4H) based on the chart structure shown in the screenshot. XAUUSD previously traded within a consolidation range, where price moved sideways after a corrective phase, reflecting temporary balance between buyers and sellers. This range acted as an accumulation area before the next directional move. Following this consolidation, gold initiated a strong bullish breakout, shifting market control decisively to buyers. After the breakout, price developed a well-defined ascending channel, characterized by consistent higher highs and higher lows. This structure confirms a sustained bullish trend, with each pullback remaining corrective and contained within the channel. During the advance, XAUUSD experienced a sharp corrective drop from a local pivot high, briefly breaking internal structure. However, this move was quickly absorbed by buyers near a clear pivot point, from which price aggressively reversed and resumed the bullish trend, reinforcing demand strength.
Currently, XAUUSD is trading near a major Supply Zone around 4,620–4,630, where price has repeatedly shown signs of exhaustion. After a strong bullish impulse and formation of a well-defined ascending channel, buying momentum has started to weaken near the upper boundary of the structure. Multiple attempts to sustain price above the supply area have failed, indicating strong seller presence and lack of acceptance at higher levels. The most recent price action shows a rejection from the supply zone, followed by a pullback below the local resistance line. This behavior suggests that the bullish move is losing strength and that the market is transitioning into a corrective phase. Additionally, the break of the short-term internal structure increases the probability of a deeper retracement rather than immediate continuation higher.
My primary scenario favors a short setup while price trades below and continues to reject the 4,620–4,630 Supply Zone. A confirmed rejection or bearish reaction from this area may trigger a move lower toward the 4,520 Demand Zone (TP1), which aligns with previous breakout structure and acts as the first key downside objective. If selling momentum strengthens and price breaks below 4,520 with acceptance, this would open the door for a deeper correction toward lower support levels within the broader structure. However, a clean breakout and strong acceptance above 4,630 would invalidate the short bias and signal bullish continuation. Until that happens, the market structure favors a corrective move to the downside from supply. Manage your risk!

BTCUSDT Long: Buyers in Control Above 94K, Next Stop 98.5KHello traders! Here’s a clear technical breakdown of BTCUSDT (3H) based on the current chart structure shown in the screenshot. BTCUSDT previously traded inside a well-defined descending channel, reflecting strong bearish pressure and consistent lower highs and lower lows. This bearish phase ended near a clear pivot point, where selling momentum weakened and buyers stepped in aggressively. From this pivot, price initiated a recovery move and successfully broke out of the descending channel, signaling a shift in short-term market control. Following the breakout, BTC transitioned into a broad consolidation range, where price moved sideways for an extended period. This range represented a balance between buyers and sellers, with multiple internal reactions confirming accumulation and uncertainty before the next directional move. Eventually, BTC broke out from the upper boundary of the range, confirming renewed bullish interest. After the range breakout, price formed a well-structured ascending channel, characterized by higher highs and higher lows. This structure confirms a bullish corrective-to-impulsive transition, with buyers maintaining control. Within this channel, BTC recently broke above a key Demand / Support Zone around 94,000, which previously acted as resistance and is now acting as support.
Currently, BTCUSDT is approaching a major Supply Zone around 98,000–98,500, where selling pressure has previously appeared. This zone aligns with the upper boundary of the ascending channel, increasing the probability of a reaction or short-term pullback. The most recent price action shows hesitation near this area, suggesting that sellers are beginning to defend higher levels.
My scenario: as long as BTCUSDT remains above the 94,000 Demand Zone and continues to respect the ascending channel structure, the bullish bias remains intact. I expect buyers to defend pullbacks toward demand and attempt another push into the 98,000–98,500 Supply Zone (TP1). A clean breakout and acceptance above this supply would confirm bullish continuation and open the door for further upside. However, a strong rejection from the supply zone followed by a breakdown below the ascending channel and 94,000 support would signal weakness and increase the probability of a deeper corrective move back toward the prior range highs. For now, price is at a key decision area near supply. Manage your risk!

BTCUSDT: Pullback To 93K Support Before Return of Bullish TrendHello everyone, here is my breakdown of the current BTCUSDT setup.
BTCUSDT previously transitioned from a strong bearish impulse into a recovery phase, where price formed a well-defined upward channel, signaling a corrective bullish structure. Within this channel, Bitcoin produced higher highs and higher lows, confirming temporary buyer control after the sell-off. During this phase, price also formed a consolidation range, reflecting a pause and balance between buyers and sellers before the next move. As price advanced, BTCUSDT approached a major Resistance Zone around 95,500–96,000, where selling pressure became evident. Multiple tests of this area failed to produce acceptance above resistance, and a clear rejection / test occurred at the top of the channel. This behavior indicates supply dominance at higher levels. Following the rejection, price broke below the upper channel structure and pulled back toward the Support Zone near 93,000, which previously acted as both demand and a breakout level.
Currently, BTCUSDT is trading below the resistance zone and showing signs of weakness after the failed breakout attempt. The recent breakout below minor support suggests a potential continuation to the downside, while the broader structure remains vulnerable as long as price stays capped below resistance.
My Scenario & Strategy
My primary scenario remains bearish while BTCUSDT trades below the 95,500–96,000 Resistance Zone and continues to show rejection from the upper channel. Any pullbacks toward resistance that show weakness or rejection may offer short opportunities, with downside continuation toward the 93,000 Support Zone as the first objective. A decisive breakdown below support would open the door for a deeper corrective move.
However, a strong breakout and acceptance above resistance would invalidate the short bias and signal a shift back toward bullish continuation. I believe there will be a correction to around 93K, and then a resumption of the bullish scenario.
That's the setup I'm tracking. Thank you for your attention, and always manage your risk.

EURUSD: Sellers Take Control Below Key Resistance, Eyes 1.1600Hello everyone, here is my breakdown of the current EURUSD setup.
Market Analysis
EURUSD previously traded within a well-defined upward channel, confirming a bullish recovery phase after forming a strong base from the prior decline. Buyers maintained control by producing higher highs and higher lows, eventually pushing price toward a key Resistance Zone around 1.1690–1.1700. At this resistance area, price transitioned into a broad range, signaling a balance between buyers and sellers. Multiple attempts to hold above resistance failed, indicating growing selling pressure at the highs. Eventually, EURUSD broke down from the range, confirming a loss of bullish momentum and a shift in short-term market control.
Currently, EURUSD is trading within the descending channel and moving toward a key Support Zone around 1.1600, which previously acted as a demand area and a structural reaction level. This zone represents the next important area where buyers may attempt to slow or pause the decline.
My Scenario & Strategy
My primary scenario remains bearish as long as EURUSD stays below the 1.1690–1.1700 Resistance Zone and continues to respect the downward channel. Any pullbacks into resistance that show rejection can be viewed as potential short opportunities, with downside continuation toward the 1.1600 Support Zone as the first target.
However, a clean breakout and acceptance above resistance would invalidate the short bias and suggest a possible shift back toward consolidation or bullish recovery. Until that happens, market structure favors sellers, and rallies are considered corrective within the broader bearish context.
That’s the setup I’m tracking. Thank you for your attention, and always manage your risk.

XAUUSD Holds Bullish Structure Above Support - Eyes on $4,680Hello traders! Here’s my technical outlook on Gold (XAUUSD, 3H) based on the current chart structure. Gold is trading within a well-defined bullish trend after reclaiming key levels and establishing a sequence of higher highs and higher lows. Earlier on the chart, price formed a consolidation range, signaling accumulation before continuation. This range was later broken to the upside, confirming renewed buyer control and continuation of the broader bullish structure. Following the breakout, price moved higher but then entered a corrective phase, pulling back toward the rising trend line and the Support Level around the 4,510 area. This pullback appears corrective rather than impulsive, with buyers stepping in to defend the trend. Price respected the support line multiple times, forming fake breakouts to the downside before reversing higher, which further confirms underlying buying strength. Currently, XAUUSD has broken above the descending resistance line and is consolidating above it, signaling a successful breakout and potential continuation. Price is now trading above the Buyer Zone and approaching the Seller Zone / Resistance Level around 4,640. This area represents a key reaction zone where selling pressure may appear. My scenario: as long as Gold holds above the Support Level and continues to respect the rising trend line, the bullish structure remains intact. A clean breakout and acceptance above the 4,640 Resistance Level would confirm continuation toward the next upside target 4,680 (TP1). However, rejection from resistance could lead to a short-term consolidation or corrective pullback toward support before the next attempt higher. For now, the bias remains bullish, and price is positioned for a potential continuation move. Please share this idea with your friends and click Boost 🚀

EURUSD Short: Sellers Take Control Below 1.1680Hello traders! Here’s a clear technical breakdown of EURUSD (2H) based on the current chart structure. EURUSD previously traded within a well-defined ascending channel, confirming a strong bullish phase with consistent higher highs and higher lows. During this advance, price formed a consolidation range, which eventually resolved to the upside with a breakout, reinforcing bullish momentum. However, as price approached the key Supply Zone around 1.1680–1.1700, buying pressure started to weaken. Several attempts to hold above this area resulted in fake breakouts, signaling strong seller presence and exhaustion at the highs. Following the rejection from supply, EURUSD formed a clear rounding top near the pivot high, marking a structural transition. Price then broke below the range support and the ascending channel, confirming a short-term shift from bullish to bearish control. This breakdown led to the formation of a descending channel, where price is now producing lower highs and lower lows. Recent pullbacks into the channel resistance and supply area have failed, further confirming that the upside moves are corrective rather than impulsive.
Currently, EURUSD is trading below the 1.1680 Supply Zone and is moving toward the Demand Zone around 1.1600, which represents a key support level and the next potential reaction area. This zone aligns with previous structure and may attract buyers for a temporary pause or bounce.
My scenario: as long as EURUSD remains below the 1.1680 Supply Zone and respects the descending channel, the bearish bias remains valid. I expect sellers to maintain control and push price toward the 1.1600 Demand Zone (TP1). A clean breakdown and acceptance below 1.1600 would open the door for a deeper bearish continuation. However, a strong bullish breakout and acceptance back above 1.1680 would invalidate the short scenario and suggest a potential shift back toward consolidation or recovery. For now, market structure favors sellers. Manage your risk!

EURUSD Lower Highs Signal Continuation Toward 1.1590Hello traders! Here’s my technical outlook on EURUSD (2H) based on the current chart structure. EURUSD is currently trading within a broader bearish structure after failing to sustain bullish momentum near recent highs. Earlier on the chart, price formed a clear consolidation range, where the market paused before a breakout to the upside. However, this breakout lacked follow-through and eventually marked a local turning point, after which selling pressure began to increase. Following the rejection from the highs, EURUSD started to form lower highs and lower lows, confirming a shift in short-term market control. Price then broke below the key Seller Zone around 1.1680, which previously acted as support, flipping it into resistance. This breakdown signaled a bearish market structure shift and initiated a sustained move lower. Subsequent pullbacks into this Seller Zone were corrective and met with renewed selling interest, reinforcing its role as a resistance level. Currently, price is trading below the descending trend line, which continues to cap upside attempts. Recent corrective moves have failed to reclaim the trend line or the Seller Zone, suggesting that sellers remain in control. Below current price, the Buyer Zone / Support Level around 1.1590–1.1600 stands out as the next key area of interest, aligning with prior demand and a potential reaction zone. My scenario: as long as EURUSD remains below the 1.1680 Resistance Level and continues to respect the descending trend line, the bearish structure remains intact. I expect price to continue lower toward the 1.1600 Support Level (TP1). A clean break and acceptance below this support could open the door for further downside, while a strong bullish reclaim above resistance would invalidate the bearish scenario and signal a potential trend reversal. For now, the bias remains bearish while price trades below resistance. Please share this idea with your friends and click Boost 🚀

1/15 recap - Tears are real and we cannot have all winning daysPremarket POI map
Key levels I marked:
NY AM High: 25,954.25
PDH: 25,878.75
NY AM Low: 25,803.50
POIs above: 25,871.25 / 25,920.50 / 26,006.00 / 26,083.50 / 26,106.25
Lower POIs: 25,690.00 / 25,670.25 / 25,622.50 / 25,596.25 / 25,579.50 (and lower)
Gameplan (simple):
Bull case: reclaim/hold PDH + POI1 → push to POI2/POI3.
Bear/flush case: lose AM Low → next POIs below.
What price actually did (chart story)
Early session: Price was strong (green trend/structure), then sold off from the upper POI zone, showing “decision candle” rejection near your POI2 area.
Mid-morning: The drop drove into the NY AM Low (25,803.50) zone (I highlighted this). That level acted like the decision point.
Reversal confirmation: You caught the key idea—hold AM Low → reclaim back into PDH/POI1 area. Your later screenshots show LONG valid entry printing around the POI1 / PDH reclaim area and then continuation.
Clean takeaway: Today’s “A+” idea was the AM Low hold + reclaim (your circled 25,803.50).
Your Trades (QQQ 1/15 Calls) — lined up & totaled
From your trade screenshot list:
Sequence (CST)
11:18 – Buy QQQ 1/15 $627C x3 @ 0.43 → -129
11:23 – Buy $627C x3 @ 0.40 → -120
11:31 – Buy $627C x4 @ 0.28 → -112
12:05 – Buy $627C x5 @ 0.21 → -105
12:15 – Buy QQQ 1/15 $626C x2 @ 0.54 → -108
13:40 – Buy QQQ 1/15 $625C x1 @ 0.18 → -18
Late-day closes / salvage:
14:11 – Sell $625C x1 @ 0.05 → +5
14:17 – Sell $626C x2 @ 0.02 → +4
14:37 – Sell $627C x15 @ 0.01 → +15
P/L Summary
Winners: +$24
Losers: -$592
✅ Net P/L: -$568.00
What this means in plain English: you kept a bullish thesis (calls) while price/IV/theta didn’t pay fast enough, so the position decayed and you ended up “selling for pennies” into the close.

ETHUSDT M30 HTF Range High Rejection and Bearish Pullback Setup📝 Description
BINANCE:ETHUSDT has reached the previous range high and is reacting from a clear BSL zone. Price is showing rejection near local resistance, suggesting weakness after the recent bullish leg and increasing probability of a corrective pullback.
________________________________________
📈 Signal / Analysis
Primary Bias: Bearish while price remains below the range high and BSL
Preferred Setup:
• Entry: 3,375
• Stop Loss: Above 3,395
• TP1: 3,347
• TP2: 3,321
• TP3: 3,286 (HTF FVG draw / lower liquidity)
________________________________________
🎯 ICT & SMC Notes
• Clear reaction from BSL and range high
• No bullish continuation structure confirmed
• Downside targets aligned with HTF FVG and liquidity pools
________________________________________
🧩 Summary
CRYPTOCAP:ETH is showing signs of exhaustion at the range high. As long as price stays below BSL, the expectation remains a controlled bearish pullback toward lower HTF liquidity zones.
________________________________________
🌍 Fundamental Notes / Sentiment
With ongoing USD strength, financial conditions remain tight, pressuring risk assets. In this environment, Ethereum is vulnerable to downside, and a bearish continuation is favored as long as the dollar stays supported.
________________________________________
⚠️ Risk Disclosure
Trading involves substantial risk and may result in capital loss. This analysis is for educational purposes only and does not constitute financial advice. Always apply proper risk management, predefined stop-loss levels, and disciplined position sizing aligned with your trading plan.
