Rangebound

Everything you need to know about USD directionYou may have noticed USD not showing much direction, it's because of this little guy here, the US dollar index. Until this breaks out of the nice little wedge that's been holding it prisoner for months and months, we're likely to see USD pairs struggle. So we need to watch other currencies that have big strength or weakness. This doesn't mean USD pairs won't move, it just means the USD component will not be doing much of the push either direction. I love audusd, nzdusd, usdcad and others, but not for the USD side of it.
So this is more of a reference chart, there's no trade here for me it's just what I'm watching so I'll be ready for the big USD movement when the wedge finally breaks.

Butterfly Pattern in range-bound marketI'll be looking to enter near the drawn green trend-line at a butterfly point D completion via a price action or trend line break on a lower time frame. Adjust target 1 to .382 retracement of AD and I have target 2 as point C just below the psychological 1.1300 level.

EURUSD rangeboundAs a trend trader I like to trade trends.
EURUSD is devoid of any trend and has been trading within a range for a while as can be seen on the weekly chart. Will wait for a good set up based on low risk or a breakout on the daily.


bullish idea reversal on GBPAUD 1 HOURStrong uptrend so im following it. slight downtrend and choppyness has started because of heavy selling. price should come back up to normal. I could be wrong and price could touch the blue rectangle of support at 1.72619 level, if price does touch that rectangle a reverse is definitely going to happen. EITHER WAY I AM BULLISH

FX00101 - USDCAD - Sideways range bound Pair is in a bullish sidewards range bound channel. A daily pin bar rejecting the 8 and 21 EMA's has formed. This can be seen on the 4h chart as a bullish engulfing signal. Look to go long on a break of the doji (pin bar) or better still, wait to see if price retraces further towards to 8EMA before entering long as this will give a better R/R.

AUDCAD - Long term rangeThis pair has been in a ranging environment for pretty much 3 years now. Since this range held repeatedly it is likely that we will see another rejection from the resistance zone between 0.995 and 1.010.
If price manages to close above 1.01 on a weekly basis I would change my bias from neutral to bullish, long term. In that case 1.050 would be the logical level to target.

RANGE BOUND - USDJPY: TRADING STRATEGY - PART 2 Trading for this week:
1. My plan for next week focuses on point "3." from the previous post - I am waiting for risk-on or risk-off assets to confirm investor conviction by using USDJPY as a barometer for net risk sentiment. Despite the market uncertainty and high volatility UJ last week traded within a 200pip range for the between 101.3-103.3. Therefore, I consider a 60pip break of either level to confirm the conviction to a sentiment e.g. 60pips higher is risk-on (Yen selling), 60pips Lower is risk-off (Yen buying).
So of the two possibilities for this week (based on the previous post) Most likely i think is:
1) Global risk continues its recovery as I ask myself what possible risks/ events are there that could tip risk-off sentiment? My answer is none. However, there are several arguments for a risk-on bias e.g. 1) Central bank easing continues to offer risk higher e.g. a dovish RBA (5th) and BOE meeting (14th) price JPY lower and UJ higher
2) Implied vol continues dropping below realised vol, aiding bullish sentiment.
3) Brexit uncertainty continues its de-risking/ pricing as its unlikelihood increases. Further, I think Equities have another week of rallying to price before earnings uncertainty selling will become a factor.
Trading Strategy:
If Yen carries on Ranging I advise buying UJ at lows of the range e.g. between 101.3-101.9 - or you could buy at any price in the range as I have a target of 106 in the near-term and 110+ in the next 4+wks.
Alternatively, I advise placing BUY STOP orders at 103.9-104.2 (level that confirms a risk-on breakout) as there will be 80% of UJ short Stop-Losses at this level, so we will likely see a short squeeze take us 200pips up instantly once UJ trades to at or about 104.
I like owning UJ structurally in the medium term as even if UJ falls lower in the near term which is unlikely (what risk is likely to drive it lower?) as UJ trading at or below 101 (and the further it falls) the more likely the BOJ will be to launch emergency FX intervention and/or near term lower UJ increases odds of an aggressive BOJ cut at its July 28th meeting - which will make UJ trade 500pips+ higher, dependent on the measures/ aggressiveness taken.
For some background/ support for the UJ higher trade
1. based on BOJ easing, recently JPY retail sales disappointed at -1.9% vs -1.6%, as did inflation which was seen at -0.4% nationally for CPI and Core and -0.5% for the same in Tokyo + BOJ's own Core measure continued its strong MoM downtrend at 0.8% (from 0.9% last) - consistently unresponsive inflation is the single biggest driver for BOJ easing/ cutting policy, and the poor inflation has been problematic since the last cut in January 2016 so this gives further weight to another cut, especially since it was 6+ months ago.
- Also BOJ Kuroda and JPY Govt Aso and Abe had several emergency meetings last week as a result of the Brexit vote/ JPY appreciation, in which they discussed FX levels, although taking no action, such rhetoric and actions imply and give likelihood that the BOJ will take substantial action in July.
- Technically, UJ has been oversold for several weeks, even if UJ higher isnt structurally long, we should at least be able to realise a 600-800pip recovery rally before moving lower again.
Volatility
- USDJPY Realised Volatility is trading higher than implied (bullish signal) with 2wk and 1mth at 19.64% & 15.6% vs implied's trading at 11.25% & 13.43% + there are some large notional OTM call strikes at 104.2 and 105, indicating the market may have a bullish bias. Also, the UJ 1wk/1m 25 Delta Risk Reversals Trade at apprx -1.6%, and falling, indicating the market is becoming more bullish by 1) being positioned long in the spot market but buying less downside option coverage and/or 2) Speculative Demand for UJ downside puts is falling.
*Read my previous post "RANGE BOUND - USDJPY: IS THIS GLOBAL RISK RECOVERY REAL? PART 1" for analysis of last week and mo

RANGE BOUND - USDJPY: IS THIS GLOBAL RISK RECOVERY REAL? PART 1Expectations vs Reality:
1. Following the referendum decision on Friday, as expected GBP sold off 10%+, the FTSE plummeted in a similar fashion and global risk assets sold off across the board, but FTSE/ Risk recovered a significant amount of those losses into Fridays close and for the rest of the next week.. So what happened to BREXIT?
- Such behaviour would lead you to believe that the Brexit decision was all just a bad dream, with much of the price action volatility confined to Friday alone - rather where I had expected the decision on Friday to start a cascade of risk-on asset selling, as the brexit backdrop provides the perfect impetus to trigger the risk-off fear for the wider global risks e.g. US Election, Global growth, China Debt - and, ofc, the Brexit Macro economic spill-over itself.
Why did we witness this Risk Recovery Paradox?
1. I think the main reason that risk managed to avoid carrying its bid bias into this week from Friday was PM David Cameron's decision early on Friday/ Monday to 1) Resign in October and 2) Refuse to sign the Article 50 which formally/ actually starts the Brexit Negotiations - the net effect is that brexit risks have been shifted into 2017 (or never) rather than present, thus providing investor confidence to buy risk at its Friday discount (why not) and take bets on a Brexit no show (illustrated by a buoyed GBP which imo should have fallen more).
- What this combination of events now means is that Brexit now trades as a function of Political possibility rather than as a certainty because 1) By resigning in Oct and refusing to start the negotiations now, it means that Brexit itself is put on hold until at least October. Further, the fact that the above is the case, the whole "Brexit" likelihood is brought into question in itself as 1) How likely is the new PM in Oct going to sign the article 50 as soon as they get into office? I think VERY unlikely, its career suicide to start such a volatile process immediately when in office so that means the Brexit Negotiations are pushed further out and likely into 2017 (66.66% chance it occurs in 2017 now from odds-checker). 2) Will Brexit go ahead at all? I think Brexit absolutely is unlikely, as the new PM wont want the economic and political uncertainty that will follow - especially as the vote didnt happen under their leadership - imo its more likely that the new PM will forgo the blame onto Previous PM Cameron and/ or call for a re-referendum or scrap the idea completely and instead offer a solution to solve the "leave" voters problems e.g. Bid to fix EU immigration.
2. Worldwide Central Banks supportive/ Dovish statements - All Major CB have offered their support if their economy calls for it as a result of Brexit - namely the front-end of the FOMC's rate hike curve was severely flattened (Dec or 2017 hike now likely) and the BOE Gov Carney put 250bn in QE and 25bps of Int rate cuts on the cards - the net effect of these actions has been to smooth investor fear, and allow risk to rally, as low rates and QE has no doubt been the biggest driver for stocks in the last 8 years - the FTSE's recovery was/ is 100% underpinned by the BOE stance imo.
3. And the most interesting possibility is that - Investors don't believe in this risk-rally, instead it is just a micro unfolding that will eventually unravel, forcing risk to sell-off in the near future. And by looking at the stability of Gold, Bonds and Yen, this argument does carry alot of weight and is something ive been watching all week. All risk-off assets have traded flat/ higher, despite risk rallying - when risk-on and risk-off assets FAIL to maintain their negative correlation (as they are failing to do now, and are actually slightly positively correlated as they both rise) it usually means the rally is being undermined by a longer-term macro view - since liquidity is a 0 sum game in the long run, all assets cant grow at the same time, either risk must sell-off or

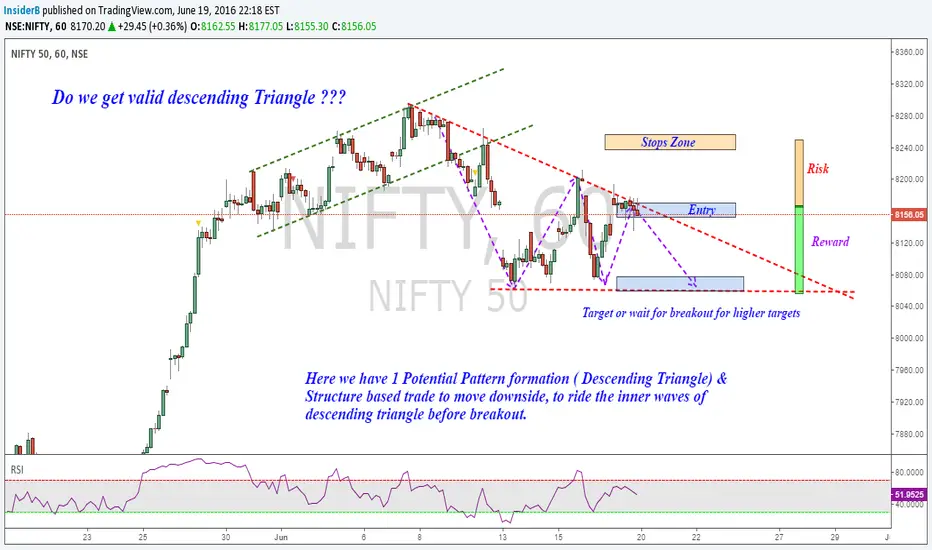
Nifty Hourly : Will descending Triangle complete ?We have news today which market has never expected : R3 won't be RBI governor for 2nd term.
That's Bad News, Atleast for Indian Economy & our banks which are high on NPA's. If I start on explaining this scenario & complex situation of our economy combined with Global scenes , it will go on, so let me cut here & jump back to what we do always - Analysis.
After the channel breakout , Nifty go into ranging mode and if you guys remember our Bearish Crab targets are still to be reached around 8000's. But here is another chance for who missed it.
We have potential triangle formation but the inner moves offers us a chance to short. Check chart for targets,stops. Determine Entry after checking your risk-reward.
Happy Trading !
POSSIBLE BEARISH BREAKOUT AUD/JPYAfter being range bound for a while now AUD/JPY finally looks like it is preparing to make a break. I am favouring a downside break for this pair to 75.848 and possibly beyond. i will be waiting for a breakout, retest and continuation to enter into this one which looks like it could offer a nice risk reward as well. If this market was to turn on its head and break the other way i would expect a move up to 82.993 however at this point in time I am heavily favouring a downside break.

Buy AUDJPY @ Bottom of Range - Potential Trade within 2 daysBuy FX:AUDJPY @ bottom of the range
Back side of the trend line; with StochRSI oversold and going up
Double Check Bullish CS Formation before place the trade
Counter Trendline Break

AUDCHF Sell TOP OF THE RANGESell FX:AUDCHF
Top of the Range!
StochRSI Over bought both 2H and Daily Chart

EURGBP Long opportunity on a Cypher formationHere on the EURGBP we are in a range bound market, down at the bottom structure support at the channel we got a Cypher formation forming, we have had a pretty free falling market, with some momentum bars today, which have made RSI go down near the oversold area, so let´s see if we catch price for another run at the range.
Kind Regards
Thomas Jeff

Long EURNZD range setupGood ~200-300 pip long setup
The pair is looking to stay range-bound within this wedge
Would look for consolidation at 1.63 level before taking long position
Also looking for a potential long-term buy opportunity with a break of the wedge resistance... I like the short NZD fundamentally
Here's a daily chart showing the wedge

USD Index nearing possible support areaWeekly candle chart
$DXY trading in a ~7% range since early 2015
Will the range hold? Will it break?
RSI looking bearish, but has also found support in the past, maybe looking to give the 61.8% retracement a proper test.
I could see the Fed just playing ping pong using their announcements for the rest of the year, curious to see how it goes. Also wondering if they're looking to do another round QE... these things I know little about.

GBPNZD H4 range breakPA is still in channel. Break to the downside has 2 targets, 2.07665 and 2.05053, that's if PA breaks the channel. Upper range break would target 2.13550 and perhaps 2.14570.
Keep in mind the weekly chart where a pennant is forming and the bullish bat completion at 2.00 is in progress!!!


Has OKE hit bottom? Has OKE hit bottom? Will it finally break out of the $19-$26 range it has been trading in since December? Stock RSI says back down. OKE heavily trades with oil. I think a mini correction is coming in the oil markets, and I think that OKE will revert back to its range. Of course set your stop loss tight, b/c if this goes the other way it could be one heck of a rally.

NZDUSD Short opportunity in play, using the Daily chart.With the Long-term trend being down and the break of a Short-term up-trendline, I see a Short opportunity together with Price Action Bars, ofcourse. Although We can see that Price currently is in an Range structure and we have to be Cautious for the Tests of Support and Resistance.
Further we see previous Divergence of the RSI with the Dominant trend and RSI at the present now being in a Downtrend. I have also drawn an horizontal Support/Resistance line at the number 0.6450, finding that price makes some nice opportunities there.
I am also using a 200Daily SMA and a 21 & 34 EMA, with the 200Dma being the Long-term indication and the 21 & 34 EMA being the Short-term trend indication. The crosses seem strong and on point as of how I like it .
As last I have set an Short position on the chart with a 1:1/R:R ratio target at 0.6500, though i do not use a Target in my trading,, I trail Stops.
Beneath a Snapshot image of the 4-hour chart at the time being:


Range bound based short set up on EUR/GBPEUR/GBP has been in a range since March 2015. Another retest of ~0.7400 at the top of the range and a high test close with oscillator bearish divergence offers a short position in the ranging pattern possibly reaching the bottom of the range at ~0.7000.
entry - below low of high test bar
stop loss - above high of high test bar
target - bottom of the range/support at ~0.7000
