EUF / USD 1.13291 - 0.28 % LONG IDEA * TREND CONTINUATION&PRICE HELLO EVERYONE
HOPE EVERYONE IS DOING GOOD HAVING A GOOD ONE, HERE'S A LOOK AT POSSIBLE SCENARIOS THAT COULD PLAY OUT IN THE COMING WEEK ON THE EURO / DOLLAR PAIR .
* The pair has been range bound in consolidation for some weeks now.
- Short term / intra-day entered an up trend as we had a (HH) break ABOVE on the 4h chart currently retracing towards the 61.8 fib level.
- Looking for LONG entries on the PAIR this week should all the rules of the formation be met.
lets see how it goes
IF THIS IDEA ASSISTS IN ANY OR IF YOU LIKE THIS ONE
SMASH THAT LIKE BUTTON & LEAVE A COMMENT.
ALWAYS APPRECIATED
____________________________________________________________________________________________________________________
* Kindly follow your entry rules on entries & stops. |* Some of The idea's may be predictive yet are not financial advice or signals. | *Trading plans can change at anytime reactive to the market. | * Many stars must align with the plan before executing the trade, kindly follow your rules & RISK MANAGEMENT.
_____________________________________________________________________________________________________________________
| * ENTRY & SL -KINDLY FOLLOW YOUR RULES | * RISK-MANAGEMENT | *PERIOD - SWING TRADE
Rangebound

$LCID - Rangebound Trading Until Lockup Expiry$LCID has been rangebound within this channel for the past few weeks, forming a nice little volume shelf in the process.
You can consistently trade this range and scalp a couple of percentage points each swing.
This range may become invalidated as of the Lockup Period Expiration which occurs on January 19th.
Traders beware!

Banknifty analysis for 29/12/2021Banknifty finding base from last 7 trading sessions and didn't break previous low.
And from last 7 days it is range bound also in wider range.
Immediate resistance is placed at 35350 let it break then we can see 35550 and 35700 level.
On the flip side 35000 will act as a strong support for this bounce back.
Trading level
Buy above 35350
Target 35480, 35550, 35650
Sl 35170
Sell below 35140 for 35000.

Cardano Breakout or more range bound action??Cardano (ADA) price is holding strong against the current upward and downward movements of BTC. $2.00 still remains strong support for this asset. (4hr chart)
Long-term we are still waiting for the move towards the $3.90-$4.00 mark (falling wedge)
Short-term ADA seems to be consolidating within the range between $2.00 and $2.32 (next resistance zone). This range bound action could continue for the next few weeks with another test of the $2.00 support which would create a triple bottom scenario (a good entry for new entrants).
*Note a downward move could see us test the $1.85-$1.90 levels.

ATOM/USDT RANGEBOUND! ACCUMULATION OR DISTRIBUTION?Hello my beauties.
It seems to me that ATOM/USDT has reached a rangebound condition.
We will wait for further development of price action, but the ST (second test) after the AR (automatic reaction) was pretty strong. This normally indicates a phase of reaccumulation, but it is too early to tell.
If you find this idea to be helpful like, follow, and drop a comment below if you'd want me to analyse a different pair.
Consider supporting me if you think I am providing you with value.
Peace.
Luca, TrickleDownFX

Range trading: Cryptocurrencies as for 26/08/2021Calculations of the fluctuations range for the present day are published in this section. That is, at the very beginning of the day, you can determine the maximum and minimum of this day (with a known probability).
What does this information give? In fact, a lot. But first of all, these are guidelines for trade. For example, if during the day the price approaches the upper (lower) mark, you know that it won’t go above (below) this mark with a particular probability today. Accordingly, you can open a position opposite to the current movement, knowing in advance what the probability is to be profitable.
BTCUSD
Long position 1
(The price today will not fall below this mark with a probability of 68%) 47102
Long position 2
(The price today will not fall below this mark with a probability 95%) 46456
Long position 3
(The price today will not fall below this mark with a probability 99%) 45810
Short position 1
(The price today will not rise above this mark with a probability of 68%) 49136
Short position 2
(The price today will not rise above this mark with a probability of 95%) 49781
Short position 3
(The price today will not rise above this mark with a probability of 99%) 50427
ETHUSD
Long position 1
(The price today will not fall below this mark with a probability of 68%) 3066.55
Long position 2
(The price today will not fall below this mark with a probability 95%) 3002.82
Long position 3
(The price today will not fall below this mark with a probability 99%) 2939.08
Short position 1
(The price today will not rise above this mark with a probability of 68%) 3292.21
Short position 2
(The price today will not rise above this mark with a probability of 95%) 3355.94
Short position 3
(The price today will not rise above this mark with a probability of 99%) 3419.68
XRPUSD
Long position 1
(The price today will not fall below this mark with a probability of 68%) 1.0826
Long position 2
(The price today will not fall below this mark with a probability 95%) 1.0297
Long position 3
(The price today will not fall below this mark with a probability 99%) 0.9767
Short position 1
(The price today will not rise above this mark with a probability of 68%) 1.2198
Short position 2
(The price today will not rise above this mark with a probability of 95%) 1.2728
Short position 3
(The price today will not rise above this mark with a probability of 99%) 1.3257
Calculations are based on the historical data and history doesn’t necessarily repeat this particular day. About mentioned probabilities are not 100% and do not guarantee risk-free trading

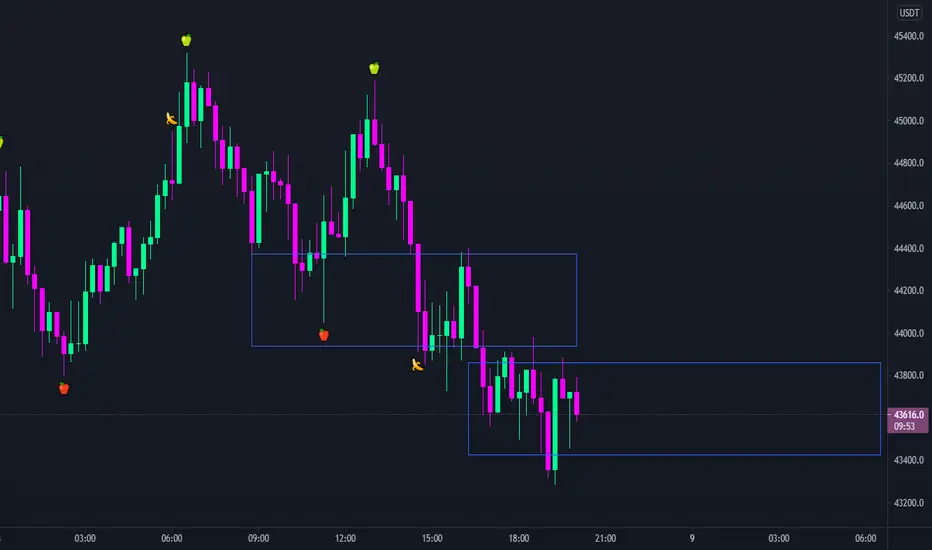
Easy range trades While BTC has had a tremendous run-up during the past couple of days, we may start to see some down that fits into my HTF plan and previous ideas shared. I had hoped for a quick and clean drop however it appears we're taking a slow approach. During the course of the next few days, we should expect hours of range-bound trading which provides the perfect scalping set-up.
Ive drawn some small boxes you may want to trade within or look for similar boxes while we drop.
BTC Confirming Support at 38,000BTC passively broke out from the descending channel and confirmed buyers within the 38-37000 range. Continuation of this could lead to a breakout or more resistance from sellers at the upper range of what appears to be a bull flag. A strong daily close would confirm an upwards reversal. FOMO could lead to a complete breakthrough on the initial bounce. On top of this, MACD is on its way to a bullish cross. Wait for daily close.

AMD looking to end year long consolidationAMD is looking to end its year long consolidation and look to new horizons.
Thoughts:
* Looking at the weekly or even monthly time frames you can see it's in a clear up trend
* It'll have to brake and close above $94.28 before it can attempt to break through its all-time-highs.
* Very high trading volume likely to push the price higher from here.
Trade idea:
* Judging by the price-action it seems like this may come back to retest the $87.40 area.
* Look for buying opportunities around the $87.40 area.
OR
* Wait for a weekly confirmation (break and close) above $94.28

EURNZD H1 POTENTIAL LongIf the demand support zone holds, AND we get bullish candlestick confirmation from the demand zone, go Long for marked areas of interest - TP1 and TP2
TRADING IDEA NOT INVESTMENT OPPORTUNITY!
YOU ARE RESPONSIBLE FOR YOUR OWN TRADING!
Good Luck.

Will ETH remains range bound between $1400 and $2000 for a bit?$ETH has seen sharp correction from its all time high over $4300 to levels below $2000 now. The current price range is an area $ETH hovered in for over 65 days on its way up to the all time high. Assuming a sense of symmetry is respected, could we see a long period of a range bound sideways market between $1400 and $2000 like we saw during the climb? The video uses channels drawn using the fibonacci retracement levels and tries to make sense of it all. Markets are not deterministic and so outcomes where we see a higher all time high later this year or we pullback to where it all started last December are possible.
Enjoy and hope these tools and analysis we share helps you understand the market better. Remember that northing we say here is investment advice. Please do you own research.

ETH Tired of Being Range Bound: Possible Breakout (Micro)My Fellow Crypto Traders,
Appreciate you taking the time to view my analysis which I hope you may find beneficial. Please be sure to “LIKE” if you indeed find my analysis useful and/or find my analysis intriguing.
Cheers & Happy Trading!

Apollo at attractive levelsAnother stock that came on my radar is apollo tyre.
The stock has been moving in a range for the past 4 months.
Last week its closed well near its highs.
Now if the stock sustains 190 levels on the weekly basis, the stock might test its upper range 240- 255.
And if the range breaks on the upside, the stock could test its all-time highs i.e. 307.25.


BTC has formed a range bound channel with inclination to riseI have demonstrated a four line channel with lots of hits and reactions and as we can see BTC is trapped in this bound giving opportunities to altcoins to to uprise.

T - Range Bound Upside Play.Stock has been trading in a range since late March of 2020 and made a clearly defined zone up until Sep 2020, that is now trending again in 2021 from March to current. Currently it's testing 30.75, holding a zone and setting up to break with help from the market being lifted by Earnings Season starting next week.
Upside Target: 31.50 +
Downside Pullback: 29.75, 29.25

Buy NaukriBuy Naukri above 4520 Stoploss 4450
Study: Stock is consolidating in 1 hour timeframe...Good price action...If breaks this range with volumes then stock can give good momentum

💡Don't miss the great buy opportunity in EURAUDTrading suggestion:
There is a possibility of temporary retracement to the suggested support line (1.5510).
. If so, traders can set orders based on Price Action and expect to reach short-term targets."
Technical analysis:
. EURAUD is in a range bound and the beginning of uptrend is expected.
. The price is above the 21-Day WEMA which acts as a dynamic support.
. The RSI is at 70.44.
Take Profits:
TP1= @ 1.5690
TP2= @ 1.5800
TP3= @ 1.5950
TP4= @ 1.6000
TP5= @ 1.6140
SL= Break below S2
❤️ If you find this helpful and want more FREE forecasts in TradingView
. . . . . Please show your support back,
. . . . . . . . Hit the 👍 LIKE button,
. . . . . . . . . . Drop some feedback below in the comment!
❤️ Your Support is very much 🙏 appreciated!❤️
💎 Want us to help you become a better Forex trader?
Now, It's your turn!
Be sure to leave a comment. Let us know how you see this opportunity and forecast.
Trade well, ❤️
ForecastCity English Support Team ❤️

CHFJPY RANGE. A possible move down to the daily support.The price has been trapped within this range since December last year. This last week, the price gave a fake break out of the resistance, then closed the week back within the range (forming a weekly pinbar). Within this upcoming week I can expect to see the price drop further down to the support once again around 166.305. Before I take entry on this pair, I'll wait for the price to once again retest and reject the range resistance at 117.613. If the price will give a daily rejection of that level, then I'll be interested in taking a short trade back to that support at 166.305.

CHF/JPY - Breakout failure.On the weekly chart , the price is stuck between two strong levels and is now moving in a range.
On the daily chart , we see that the price tried to break through the resistance level, but was unsuccessful.
New support levels also failed to act as a strong support zone.
So, the price moves down towards the beginning of the move to retest the support level in order to make another attempt to break the resistance level.
If you like ideas like this, please like and subscribe to this channel so as not to miss another technical analysis .
Write your opinion about it in the comments. I would like to discuss this with anyone.
This is NOT a FINANCIAL ADVICE . This is just my point of view on the current situation.

EUR/USD - Potential Range BreakoutLooking at the monthly chart , we see that the EUR / USD pair has made a correction, after which the upward movement is expected to continue.
On the daily chart , we see the possibility of a double bottom forming, which could try to break through resistance and establish a new support area before continuing to move higher.
If you like ideas like this, please like and subscribe to this channel so as not to miss another technical analysis .
Write your opinion about it in the comments. I would like to discuss this with anyone.
This is NOT a FINANCIAL ADVICE . This is just my point of view on the current situation.

EUR/USD - Range stuck possibilityA few days ago. EUR/USD pair made M patter, the price fell down and has already made a second correction with a downward movement.
The support zone was reached and the price moved up to retest the new resistance zone.
Now we can except rejection downward to the support zone.
It could be possible that the price will remain in a range for some time.
If you like ideas like this, please like and subscribe to this channel so as not to miss another technical analysis .
Write your opinion about it in the comments. I would like to discuss this with anyone.
This is NOT a FINANCIAL ADVICE . This is just my point of view on the current situation.

Short Term - XRP Trading is Range BoundLooks like XRP will be trading sideways in the short term (days)
Waiting on Breakout after SEC lawsuit.
